from the Bristol Avon Catchment website www.barcmp.webnode.com. ...
collaborative working, Training manual, Training for catchment pilots, Version 2.1
.
Catchment Guide Appendix 1: Methods and Tools
List of Methods and Tools 1. 2. 3. 4. 5. 6. 7. 8. 9. 10. 11. 12. 13. 14. 15. 16. 17. 18. 19.
A River Story Activity Mapping Axis Method Catchment Line Diagrams Catchment Mapping Portal Catchment Walkovers Climate Change Adaptation Collaborative Decision-Making Workshop Common Areas Tool Evidence Mapping Ketso Toolkit Multiple Benefits Mapping Participatory Options Appraisal Pop-up Workshops Sci-Map Stakeholder Matrix Timelines Terms if Reference – Task & Finish Groups Visioning
A River Story Intermediate
2 to 3 months
Ideal For: Members of the Public Equipment: Group Email Address Skills:
Communication, Video Editing, Public Engagement and Graphic Design Skills
Identifying issues Decision-making Public engagement Images from Bristol Avon’s River Story Competition: http://barcmp.w ebnode.com/ne ws-/#!
Provides stakeholders with the opportunity to review, comment and agree the outputs of working groups before their inclusion in the overall catchment plan Getting Ready • Decide on format for submissions and send guidance: • Some examples are: video diaries, photographs, films, drawings, poetry, original music and audio contributions • It could be left as an ‘open’ format, with all contributions considered regardless of their format • Decide on the criteria for submissions and send guidance, example ones include: • Film and images should only feature footage from the catchment • Material should be of their own copyright/ copyright free • They have permission to include people featured in them • Brainstorm communication methods that can be used to raise awareness of the initiative e.g. local newspapers, social media, school/university newsletters/websites, local/regional community groups • Decide how people can submit their work – email, website, post or other method? • Decide on the timescale for submissions to be received by • Decide on whether to hold a special event (if so, make arrangements for this event) • Instead of holding a special event, you could collaborate with an existing event and ask to screen the video story for your river • The final output was a double-sided illustrated, poster-sized map and a film
Be aware of the need to be able to store submissions electronically, the Bristol Avon’s River Story initiative received approximately 100GB of electronic submissions
Recipe for Success 1. Ask people to explore topic such as: • their awareness and use of their river • what they like and don’t like about it • how it affects their lives • how it shapes where they live and play • where it goes or comes from • their hopes and concerns for the river’s future 2. Draft a press release detailing the ‘River Story’ initiative (including topics for people to explore) • Provide contact details for enquiries and entry submissions 3. Actively promote the initiative until the deadline • At local groups/schools • At catchment group meetings and events After the deadline has passed: 4. All submissions should be ‘analysed’ and issues/problems/solutions should be noted as part of the information gathering aspect of the tool 5. Collate the submissions to produce a double-sided poster – this can be a map from the Environment Agency with annotations of submissions along the river 6. Collate the submissions into a video – this should try and include extracts from as many of the submissions as possible 7. Hold the event/collaborate with an existing event and present the video collation of submissions – your very own ‘River Story’!
From June 2013 onwards the map has been available to download as a PDF from the Bristol Avon Catchment website www.barcmp.webnode.com. It is also available as two huge vinyl banners which schools and communities around the catchment can borrow to make a colourful, lively and fascinating display. The River Story film can be viewed here: http://vimeo.com/62388027 Using the Results • Potential to form longer term links with schools and local groups. The project develops an identifiable ‘catchment community’- a base of ambassadors to build future engagement and action on. • A certain number of copies of the double-sided poster could be given away for free at the showing of the finalised River Story video and especially to those who participated. It is also possible to use the submissions in the following ways: • As a form of information gathering by analysing all of the submissions • As a way to measure public outreach, through the inclusiveness and awareness of initiative - numbers of schools/contributors contributing and numbers attending awards event
Further Information This has been used in the Bristol Avon catchment pilot. They started a River Story initiative in September 2012 with a November 2012 deadline. They plan to unveil their River Story video, and give-away copies of their double-sided poster, at the Bristol Festival of Nature in June 2013. If you would like more information then please contact Ruth Coleman, Curator/Producer
[email protected]
Activity Mapping
Specialist
2 - 20
Up to 1 month
Ideal For: Stakeholders & Steering Groups Equipment: GIS Software Skills: GIS Technical Skills , Data Collection and Analysis Skills
Identifying issues Information gathering Presenting information Decision-making Map: The severity of urban diffuse pollution from three sources (contaminated land, drainage and diffuse sewage discharge) that are affecting the Irwell catchment pilot area (Environment Agency map)
Identifies current activities and gathers evidence to prioritise issues that need action on a ‘needs and opportunity’ basis Getting Ready • • •
Prior to running the activity: Have a steering group or group of interested stakeholders in place Obtain information on significant issues for the catchment from EA and other relevant sources Collate data to understand wider issues and levels of activity Map data using GIS to create a baseline to develop initial outcomes for consultation Hold a session or workshop to explain method and get Steering Group/stakeholder support
• • •
Knowledge of the Water Frameworks Directive and role of the Environment Agency would be beneficial for participants Recipe for Success 1. 2. 3. 4.
Set up an ‘evidence to action’ sub-group GIS mapping of data relating to outcomes Map relevant catchment activities Prioritise activities based on need and opportunities
The Environment Agency may be able to provide you with GIS datasets that you can use for this! Using the Results • Allows prioritisation of activities • Can identify potential collaborators • The finalised map can quickly and easily convey complex information to a range of stakeholders (even those without a technical background) • Aids development of long term strategies and planning
Further Information This has been used in the Welland Pilot to identify and understand stakeholder groups. Irwell Pilot contact: Katherine Causer, Irwell Pilot Catchment Coordinator
[email protected]
Axis Method Basic 4-24
30 to 65 minutes
1 Facilitator for every 2 groups of 4-6 people
Ideal For: Stakeholders & Steering Groups Equipment: Flipchart, marker pens & post-its Skills: Group Facilitation
Identifying and understanding your target group of stakeholders Getting Ready • Undertake a brainstorming activity to try and identify all stakeholders in the catchment area and write them down as a list that can be referred to by group facilitators during the activity • Draw a set of axes on the flipchart • The x-axis should be labelled from ‘least affected’ to ‘most affected’ • The y-axis should be labelled from ‘least influence’ to ‘most influence’
Tip: Facilitators can refer to the list of identified stakeholders in the catchment area during the activities and provide prompts about stakeholders that groups may not have considered Recipe for Success 1. The participants should be split into small groups of 4-6 2. In these groups, they should identify all of the stakeholders that they believe are involved in the catchment area and should write them down on an A3 piece of paper 3. They should then draw out two axes on another sheet of A3 piece of paper (see image below) • The x-axis should be labelled from ‘least affected’ to ‘most affected’ • The y-axis should be labelled from ‘least influence’ to ‘most influence’ 4. The groups should then agree on the position of each stakeholder on the grid and write it down on the grid The small groups should be brought together to enable a whole-group discussion 1. Group facilitators should then use the flipchart with a previously drawn grid as the centre of a group discussion to place stakeholders in agreed upon areas 2. This will hopefully lead to discussions about the positioning of each stakeholder 3. It is important to note down when the positioning of a stakeholder led to a large discussion and the reasons for this discussion 4. It is also important to note down when the positioning of a stakeholder led to no/little discussion and was seen as unanimous by participants
Using the Results • Helps in identifying stakeholders to target as they will be affected most or have a lot of influence that can benefit the catchment group • Enables the identification of potential stakeholders for future events
Further Information Reference: Environment Agency & InterAct Networks, July 2011, Principles and practice for collaborative working, Training manual, Training for catchment pilots, Version 2.1.
Catchment Line Diagrams Basic
Ideal For:
Members of the Public and Steering Group Members
Equipment: A3 paper and basic drawing software Skills:
Data Collection and Analysis Skills, IT skills
Presenting Information Information gathering
Enables evidence from across the catchment to be presented clearly and visually without the need for GIS technical skills Getting Ready • Explain tool to stakeholders and recruit participants • Gather data on catchment issues from across the catchment area, ensuring all areas are covered as best as possible • Coordinate participants and organisations in data collection efforts • Create mechanism/process for collected data to be synthesised • Designate person(s) to analyse the data as it is being synthesised • Create a list of main issues affecting the catchment along with locations
Recipe for Success Creating a line diagram on paper (it can also be computerised to allow revisions to be easily made over the project’s duration): 1. Draw a thick central vertical line down a piece of A3 paper/on the computer software program 2. Mark on the line the source and end points of the river system 3. Along this line draw secondary horizontal lines that represent specific points in the river system 4. Label these lines with their river names, identification codes (if applicable) and distance from the main river 5. Add the previously prepared list of main issues to the appropriate locations 6. This line diagram is complete!
Colour coordination of the catchment line diagram is possible – The Ribble Pilot reflected WFD status through colours with Good Ecological Status being green Using the Results • The line diagram provides a baseline at the start of the project and can be updated and tracked as the project develops over time • The finalised line diagram can quickly and easily convey complex information to stakeholders
Further Information This tool has been used by the Ribble Catchment Pilot, for more information please contact: Helen Dix, Ribble Catchment Deliver Officer,
[email protected]
Catchment Mapping Portal Basic 2 to 10
Ideal For: Steering Group Members Equipment: Computer with internet access Computer Skills Skills:
Identifying issues Information gathering Presenting information Map: Part of the Ouse and Adur catchment area with water pollution incidents shown as markers: red makers show major incidents, orange and green markers show significant and minor incidents respectively. Created in the Rivers Trust Mapping Portal
Quick and easy tool for a pilot group to familiarise themselves with their catchment and to present information in a visually attractive manner Getting Ready • Visit the website: http://www.theriverstrust.org/catchment_mapping/index.html • Email The Rivers Trust to gain a password for the Catchment Mapping Portal • Read the basic user guide and watch the tutorial video on their website and spend some time exploring the catchment mapping portal • Discuss the mapping options and tools that you think would be relevant for your catchment with your steering group • Develop a consensus on the number of maps that need to be created and the issues to be included on each map
Catchments without GIS technical experts (or GIS software) can still make custom maps for their catchments using this portal! Recipe for Success After ‘Getting Ready’, you should be familiar with the catchment mapping portal website and know what types of issues you want to include in your maps. The next task is creating the maps! 1. This can be done by zooming into your catchment area on the map and then selecting the relevant options from the ‘Table of Contents’ 2. The map layers can be ‘faded’ in and out – this helps you to make the important map layers easier to read
It can help catchments identify and address reasons for failure in the Water Framework Directive assessment Using the Results • The mapping portal can identify areas where several issues exist at the same time – this could help with prioritising areas to work on • These maps can be used as a reference point in the future
Further Information The Catchment Mapping Portal is hosted on the Rivers Trust website and further information can be found on their website: http://www.theriverstrust.org/catchment_mapping/index.html A basic user guide, tutorial, contact details (to gain a password to use the mapping portal) and the catchment mapping portal itself are all included on this website.
Intermediate
Catchment Walkovers
Ideal For: Skills:
Stakeholders and Steering Group Members Computer Skills (Organisers)
Identifying issues Public & stakeholder engagement
Information for catchment walkover to promote collaborative engagement with stakeholders and members of the public with diverse interests Getting Ready 1. Members of the team carry out an initial walkover to identify issues along the river. A map and explanatory document are prepared (see Becton Bunny map below – this was prepared by the New Forest Pilot) . 2. Invite stakeholders and/or members of the public to join a walk along the catchment, following the route shown on the map. Distribute the prepared maps to all participants and use the document to explain to participants the issues identified during the initial catchment walkover and thought to be impacting a sub-catchment
Recipe for success 1. 2. 3.
Keep the information simple Allow time for discussion of the issues: participants may have additional information to contribute or want to understand the issues in detail. Make sure someone is making a note of the discussion and the names of the people or organisations who contribute, so that this can be written up afterwards and you can ask for further information if needed.
Becton Bunny walkover water sampling map This map was used to demonstrate to stakeholders where water samples had been taken during the detailed catchment walkover. It was used in conjunction with water quality and nitrate sampling charts .
Using the Results • Increases understanding of different issues in the catchment and their impacts. • Helps to gather stakeholder and members of the publics’ opinions on the issues identified
Us
Climate Change Adaptation
Intermediate
6-12
1 hour 45 mins
Insert Picture
River Dee. Credit: Bill Boaden
1 Organiser for every 6 participants
Ideal For: Stakeholders & Steering Groups Equipment: Flipchart, marker pens & post-its Skills: Group Facilitation
Design of measures Risk Assessment
Use for identifying robust measures for adapting to climate change Initial Preparation • • •
Use your list of initial catchment objectives and / or measures Gather group of stakeholders Provide stakeholders with a summary of information to help understand how the climate might change (see Further Information)
Tip: Start by considering how your catchment objectives and measures could be influenced by climate and weather. Recipe 1. The Coordinator or Facilitators introduces the session, explaining its purpose and how the objectives or measures being considered were developed (e.g. by a stakeholder group, by an organisation or expert working on their own, etc.) (15 minutes) 2. If necessary, divide the group into sub-groups of 4 – 6 people each and ask each group to discuss the following points, noting their conclusions on a flipchart: a. How is your catchment currently affected by climate and weather? Review the impact of recent weather events, e.g. drought, flooding, snowfall, high temperatures. b. How might these effects change in future? Consider how climate projections might affect the catchment. c. How do current and intended catchment measures contribute to and increase resilience to climate change? Are catchment measures flexible and lowregret with respect to the possible range of climate projections? Are currently expected multiple benefits likely to persist? (45 minutes) 3. Have a short break during which participants can look at the other group(s)’ answers to the questions. Invite one member of each group to stay beside their flipchart, to explain any points as necessary. (15 minutes) 4. In plenary, invite participants to review the approach to monitoring climate change. Long-term time series of local climate and impacts, both at ‘reference’ sites (those less affected by other pressures) and at impact ‘hotspots’, are essential in understanding climate change impacts, the success of catchment measures, and to inform the development of measures specifically aimed at adapting to future climate change. Do these exist? How might they be developed? (30 mins)
Tip: Encourage people to be realistic: what knowledge and resources already exist? How you these be built on?
Using the results 1. This session should yield a set of locally relevant actions that are robust to climate uncertainty and will increase catchment resilience. 2. Ask the group to decide how to take this work forward; this may be by setting up a subgroup to come up with proposals for climate change adaptation measures or by taking the results of the session to a wider stakeholder group meeting. 3. As part of developing the measures, these could be checked against the set of generic measures that have been identified, based on evidence gathered from the Catchment Pilots: • Tree planting: alongside rivers, in floodplains, in field margins and in the upper catchment • Soil erosion management: plant cover crops and shelter belts, minimise tillage, contour tillage and cropping, install and maintain silt and sediment traps, fence watercourses, block grips • Nitrate management: provide storage for slurry, adopt a solid manure handling system, optimise fertiliser application • Naturalise channels and reconnect floodplains: maintain rivers, provide refugia for fish species, remove weirs and/or create fish passage over obstacles • Water management: reduce water demand, reduce sensitive abstraction, increase winter storage, install intelligent irrigation A more detailed briefing on each of these generic measures is provided on the Catchment Change Network Hub.
Furthur Information CIS Guidance Document No. 24 River Basin Management in a changing climate (European Commission) Provides a set of guiding principles for integrating adaptation within key steps of River Basin Management Planning https://circabc.europa.eu/sd/d/a88369ef-df4d-43b1-8c8c306ac7c2d6e1/Guidance%20document%20n%2024%20%20River%20Basin%20Management%20in%20a%20Changing%20Climate_FINAL.pdf Guidance on Climate Resilience for Catchment Methods (Environment Agency) A spreadsheet tool that reviews the resilience of 228 land management measures to climate change. http://cascadeconsulting.co.uk/services/climate-resilience-for-catchment-methods-guidancetool/ Contact:
[email protected] Climate Change Information Sheets for River Basins (Environment Agency) These include a summary of climate change projections and a set of maps from the UK Climate Projections 2009 (for each River Basin), along with maps from the Future Flows project, and an overview of climate change impacts on WFD pressures. http://www.geostore.com/environment-agency UKCP09: http://ukclimateprojections.defra.gov.uk/ Future Flows: http://www.ceh.ac.uk/sci_programmes/Water/FutureFlowsandGroundWaterLevels.html Ecological Site Classification Decision Support System (Forest Research) A model developed to provide guidance on species choice and native woodland suitability in Britain. http://www.forestry.gov.uk/fr/INFD-5ZXFSD Climate change wetland management toolkit (CEH) A tool for assessing the sensitivity of UK wetlands to climate change. http://www.ceh.ac.uk/sci_programmes/Water/WetlandsandClimate.html
Collaborative Decision-Making Workshop Intermediate 5 - 30
1 hour (+15 minutes for each working group involved)
Ideal For: Stakeholders & Steering Groups Equipment: Large space, Tables, Chairs and Skills:
lots of Stickers Group Facilitation and Presentation Skills
Identifying issues Decision-making Public engagement
Provides stakeholders with the opportunity to review, comment and agree the outputs of working groups before their inclusion in the overall catchment plan Ideal tool to gain consensus; build commitment and ownership of the plan without continual amendment and review of proposed contents Getting Ready This tool is best employed after the designated working groups have agreed their priorities and have produced the issues/topics and actions for inclusion in the catchment plan. Before the workshop: • One person needs to be chosen from each of the working groups to act as that group’s representative • Each representative must receive a briefing and clearly understand what is expected from them. • Each working group should create a poster of ‘topics’ and ‘actions’ of the outputs from their group • Each representative must receive a briefing and clearly understand what is expected from them. • Another person – an independent scribe needs to be appointed for each of the working groups – perhaps from the pilot hosts and familiar with the required outcome of this exercise
Note this technique was used with a ‘mature’ stakeholder group where there had already been much joint discussion of issues. It might not be wholly successful with a new or unfamiliar group
Recipe for Success For the workshop: 1. The working groups should be spaced out from one another in the large space and set up their poster(s) 2. The stakeholders should be divided into small sub-groups – one for each working group 3. Each of the sub-groups start at a separate working group 4. At each separate working group space, the working group representative speaks on behalf of the working group 5. This representative talks through the topics and actions poster(s) and explains them to the sub-group 6. The scribe writes down feedback from each sub-group – feedback made for and against and any additional comments or suggestions 7. The representative has 15 minutes before their time is up and the sub-group visits the next working group Have a brief break for stakeholders to digest the information and talk to others. During this, the scribes write down the challenges made by all of the sub-groups on a voting sheet poster (see below for example voting sheet poster). 8. After the break, stakeholders are invited to vote for each of the challenges using either a green, yellow or red sticker (see the key on the example voting sheet poster) • Identical stickers mean that stakeholders can remain fairly anonymous in making their choices
After the workshop: 9. Photograph and type up voting sheets 10. Rank responses by number of votes to indicate the level of support for each challenge 11. Challenges where a single yellow or red vote had been cast against it may not be included (as the process it to create a joint plan rather than exercise editorial control over its content). [They were working with a large group and constrained by time. In other circumstances perhaps it would have been possible to explore some of the red stickered issues and maybe resolve any thing which was misunderstanding on the day.]
Using the Results • Widens ‘informed input’ in the creation of the catchment plan • Helps to gather stakeholder opinions on the outputs from the working groups • Helps gain “buy in” for the content of the plan
Further Information The Collaborative Decision Making Workshop was carried out by the Don and Rother catchment pilot. If you would like information on the Don Pilot and how it was managed, please contact: Stuart Jenkinson, Don Pilot Coordinator, Environment Agency
[email protected] If you would like any further information about the work on the Don and Rother into the future, please contact Joanne Briddock, Catchment Co-ordinator
[email protected] If you would like more information on the engagement techniques used in the Don Pilot, please contact: Helen Stuart, Environment Agency,
[email protected]
Common Areas Tool Basic 2 to 30 30 to 60 minutes
Ideal For: Steering Group Members Equipment: Paper and Flipchart Skills: Group Facilitation Skills
Identifying issues Engagement Information gathering
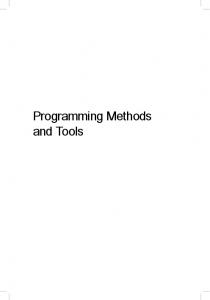
Initial step of identifying interests (top diagram) followed by exploring what participants can do together (bottom diagram)
Finding common ground and identifying areas for collaborative working Getting Ready • Identify groups, businesses, trusts etc. that operate in the catchment area • Invite them to send representatives to the workshop
If organisations can send multiple representatives then there is a greater chance that the organisations will be able to interact with all of those present Recipe for Success 1. Divide the invitees into pairs 2. In pairs, ask them to write both of their organisations’ names on the paper 3. Draw circles that overlap around the names and label the overlapping area ‘common ground’ Get each organisation to write down their interests in their circle 4. Ask them to identify common interests and put them in the middle area 5. Ask them to see if there is anything that they can do to work together on this common ground. The exercise can then be repeated with different pairs. After it has been repeated enough times, the group can be brought together and participants invited to make comments. These should be written on the flipchart so that everyone can see.
A time limit for pair work (15 minutes) may lead to more fruitful discussions and can inject some urgency! Using the Results • Help identify areas that organisations can work together on • Help build new links between organisations in the catchment area
Further Information This tool came from a training manual developed by InterAct Networks for the Environment Agency: Principles and practice for collaborative working. Training manual: Training for catchment pilots, Version 2.1. (July 2011)
Evidence Mapping
Specialist
5 - 30
1 - 2 months
Ideal For: Stakeholders & Steering Groups Equipment: GIS Software Skills: GIS Technical Skills , Data Collection and Analysis Skills
Identifying issues Information gathering Presenting information Map: A copy of the Evidence Map used by the Adur and Ouse catchment pilot . Specific features of the map are expanded upon in more detail through the use of text boxes
Enables evidence from across the catchment to be presented clearly and visually on a map Getting Ready • •
Decide on GIS software to use Explain tool to stakeholders and recruit participants
Saving the maps as PDF files is useful for sharing with others, but doing so may make the details harder to read in presentations Recipe for Success Catchment activities are summarised and presented on a catchment map. 1. Gather data from across the catchment area, ensuring all areas are covered as best as possible. This can include evidence on: • Surface water bodies, groundwater and coastal water bodies, population, land use, river morphology, industry and sewage treatment works • Dominant elemental failures such as river obstructions and effluent releases • Actions, by sector, that have already been identified 2. 3. 4. 5.
Coordinate participants and organisations in data collection efforts Create mechanism/process for collected data to be synthesised Designate person(s) to analyse the data as it is being synthesised Overlay selected data onto the GIS version of the catchment area map
Using the Results • The maps provide a baseline at the start of the project and can be updated and tracked as the project develops over time • The finalised map can quickly and easily convey complex information to a range of stakeholders (even those without a technical background) • The map is visually appealing and can be of benefit during workshops and in promoting the catchment project
Further Information Evidence Mapping has been in used in the Lower Wear and Adur & Ouse catchment pilots, for more information please contact: George Gerring (Lower Wear)
[email protected] or Jo Simmons (Adur & Ouse)
[email protected]
Ketso Image from Ketso website
Basic
4-50 45 mins – 3 hours
1 Organiser for every 24 participants Stakeholders & Steering Groups Ideal For: Equipment: 1 Ketso toolkit for up to every 24 people (available from ketso.com)
Skills:
Group Facilitation
A different and fun way to engage people that gives everyone an equal voice Getting Ready The Ketso toolkit works within the context of a normal workshop; it is a tool to aid stakeholder engagement and to help participants to record and structure their ideas on specific issues during group discussions. • The need for a workshop should be established before using a Ketso toolkit • Before using the Ketso toolkit, 1) Workshop themes and topic areas should be decided upon and 2) Organisers should identify what they want to get out of the sessions and how best to phrase their questions for participants (using elements of the Ketso toolkit to ask the questions) • Identify and book an appropriate area with space for tables (one per 8 people) and chairs
A trial run of the Ketso toolkit, amongst organisers, would help them become familiar with the tools, opportunities and limitations of the kit for participants Recipe for Success During the discussion sessions, the participants split into groups of 5-8 and an organiser facilitates a group discussion on a specific topic. The participants record their thoughts using the Ketso toolkit and branch/leaf structure: 1. Introduce each individual item of the Ketso kit (e.g. the leaves, pens and felt etc.) 2. Introduce the focus of the discussion and allow time for individuals to write their ideas about each question before sharing them with others 3. Ask participants to write their ideas on individual leaves 4. Use different coloured leaves for different aspects of the issue (i.e. problems and solutions) 5. Share ideas around the group and ask participants to place their leaves on branches on the Ketso felt; ask participants to describe their reasoning behind their ideas 6. Cluster ideas/leaves around themed branches; allow participants to question the positioning of leaves and discuss where else they might be positioned 7. These clusters can be moved around the Ketso felt, and between branches, if the group agrees (connections can be made across clusters on the felt using white icons) 8. Continue this until all ideas have been added and there are no further discussions continuing, or if the allocated time runs out After the group discussion, take a picture of the Ketso felt completed. After all comments have been recorded, the Ketso leaves can be cleaned.
Tip: Stick to the time initially allocated for answering each question – but participants can put ideas on at any time, even later in the day Using the Results • Use information gained to inform the catchment plan • Look for issues/problems/solutions that appear often or are highlighted with icons
Further Information This tool has been used by the Wandle Trust. For more information on using Ketso for a catchment plan, please contact: Bella Davies, Trust Director,
[email protected] . More in-depth information, free tutorials and practical workshop demonstrations on using the Ketso toolkit can be found at www.ketso.com or contact Joanne Tippet,
[email protected] .
Multiple Benefits Mapping Intermediate
1 to 10
Ideal For: Steering Group Members Equipment: GIS Software GIS Technical Skills Skills:
Identifying issues Decision making Presenting technical information
Map: The development of a multiple benefits map. On the left several maps showing different catchment characteristics are then combined into one overall map on the right.
Using a series of maps to find catchment areas that provide multiple benefits Getting Ready • Find external GIS data sources to create a GIS version of the catchment area • Decide on GIS software to use
The Environment Agency may be able to provide you with GIS datasets that you can use for this! Recipe for Success 1. Decide on appropriate criteria to include in analysis, such as: • Water Quality and Regulation (base-flows and high flows) • Recreational Resources and Spaces for Wildlife • Carbon Sequestration 2. Create separate maps for each criterion (with positive results being a darker colour than negative results) 3. Discuss and decide on the relative weight you will give to each criterion – which one is most important and which one is least important 4. Perform a multi-criteria analysis (where the separate maps are ‘merged’ together: resulting in an overall map that shows the compound result of the individual maps based on the relative weight that you have assigned to the individual criteria) 5. Darker areas of the map will show areas that provide a higher number of multiple benefits
This can be ‘reversed’ and used with multiple ‘issues of concern’ criteria, such as effluent discharge areas, in order to highlight the ‘areas of greatest concern’ Using the Results • These areas can then be prioritised for further action as they will have the most impact/affect more criteria than other areas • The finalised map can quickly and easily convey complex information to a range of stakeholders (even those without a technical background)
Further Information Multiple Benefits Mapping has been used by the Tamar Catchment Pilot, for more information please contact Nick Paling, Westcountry Rivers Trust :
[email protected].
Participatory Options Appraisal Basic
2 - 20
2 to 3 hours
Ideal For: Stakeholders & Steering Groups Information: Cost-Benefit Analyses of Options Skills: Data Collection and Data Analysis Skills
Identifying issues Decision-making Public engagement
Prioritising and addressing the catchment issues raised by stakeholders in an accountable process Getting Ready •
Create a long-list of catchment issues. This can be through: • Stakeholder workshops • Meetings with local representatives, members of the public and stakeholders • Identifying the issues for which there are numerous or competing solutions • Collating data on the actions to be reviewed through reviews of the existing literature (including any cost-benefit analyses)
Stakeholders in this context are representatives of organisations of interest groups rather than members of the public Recipe for Success 1. As a steering group: • Discuss the competing options in the long list • If there are clear reasons not to adopt an option then eliminate it 2. With the remaining options , carry out the ‘scoring exercise’ by awarding each option a score (-5 to +5) for impact/ benefits , effectiveness , and feasibility 3. Compare cost-benefit ratios across the options as part of the ‘scoring exercise’ This information can then be used to eliminate low-scoring options and create a shortlist of remaining options.
The remaining options can be selected as recommended actions – and be justified by the scoring exercise Using the Results • Improves stakeholders joint understanding of the costs and benefits of their activities and choices • Allows the prioritisation of activities and development of long term strategies and plans • Improves the accountability of the catchment group’s decision-making as it means that the reasons for selecting these options, over other potential options, can be explained to stakeholders and members of the public
Further Information The Participatory Options Appraisal was carried out by the Frome and Piddle catchment pilot, for more information please contact
[email protected]
Pop-up Workshops Basic
1 hour to 1 day
Ideal For: Members of the Public Equipment: Presentation materials, surveys,
Skills:
post-it notes, branding materials Communication Skills
Identifying issues Engagement Information gathering Public awareness
Taking engagement work out to the community, rather than trying to bring everyone together in one place at one time Getting Ready • Decide on the outcomes that you want to achieve from running a pop-in workshop • Create appropriate questionnaires/surveys/other data collection tools • Find out about existing events that are running in the area such as practical volunteering days and local community fairs • Approach event organisers and propose running a pop-up workshop at their event
If the event organisers turn you down, don’t be too disheartened and try approaching another event! • Source tables/presentation boards/chairs for the event • Design and create relevant presentation materials and branding materials
Recipe for Success The aim is to take the engagement work out to the community rather than trying to bring everyone together in one place at one time to form a traditional catchment group – taking your work to the people! 1. Turn up before the event begins (or as arranged with the event organisers), set up tables/presentation boards/chairs and presentation materials 2. Be friendly and approachable as people turn up to the event and perhaps look to engage with the workshop
Be ready to talk to potential participants about the project and then encourage them to ask questions, make suggestions or fill in questionnaires or surveys Using the Results • To inform decision-making • To inform evidence mapping tools with issues in the catchment
Further Information This tool has been used by the Tidal Thames Catchment Pilot, for more information please contact: Alice Hall (Thames21), Programmes Coordinator, Your Tidal Thames,
[email protected] Or Amy Pryor (Thames Estuary Partnership),
[email protected]
SciMap Advanced
1 to 10
Ideal For: Steering Group Members Equipment: GIS Software GIS Technical Skills Skills:
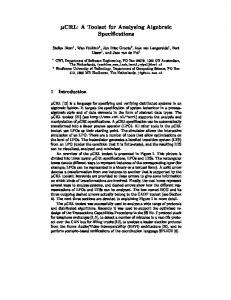
Identifying issues Decision making Presenting technical information Engagement Figures (top): The first figure shows the components of a SciMap, the second shows slope modelling with flows (arrows) from high to low. SciMap (bottom): The colours that follow the stream network are indicating the risk categories for fine sediment concentration/delivery from that stream. There is the clear distribution between low risk (green) areas and high risk (red) areas; most striking is the higher percentage of high risk streams in the upper catchment.
A tool to map areas where land use may present a pollution risk Getting Ready • Find external GIS data sources to create a GIS version of the catchment area • Decide on GIS software to use
Some data is free from the Environment Agency and Defra, such as slope and rainfall and perhaps land cover, but you may have to pay for higher resolutions Recipe for Success 1. 2. 3. 4.
Map areas where land use may present a pollution risk Map the slope in the catchment Map rainfall Combine these three maps to find areas at risk of sediment accumulation
You can create a 3D fly-through model, which is useful for connecting with farmers Using the Results • Areas at a high risk of sediment accumulation can be targeted in future catchment management actions • The finalised map can quickly and easily convey complex information to a range of stakeholders (even those without a technical background) • Outputs can be shared on the internet such as with the Rivers Trust Catchment Mapping Portal
Further Information The SciMap tool has been used by the Teme Catchment Pilot, for more information please contact Emma Buckingham, Teme Catchment Officer, Severn Rivers Trust:
[email protected] or Mike Morris, Severn Rivers Trust:
[email protected]
Stakeholder Matrix
Basic 4-24 45 mins – 3 hours 1 Organiser for every 4-6 participants
Ideal For: Stakeholders & Steering Groups Equipment: Flipchart, marker pens & post-its Skills: Group Facilitation
Identifying issues Engagement Planning
A tool to identify different approaches to engagement for stakeholder groups Getting Ready • Prepare activity space and set up flipchart • Draw influence and interest grid on flipchart (for each small group and one for the end discussion; for grid, see below) • Gather group of stakeholders • Provide brief overview of project background to stakeholders (5-10mins)
The exercise also ‘benchmarks’ where you are with engagement at a particular time and constantly evolves as communications increase! Recipe for Success Facilitators need to help their participants do the following to rank stakeholder groups by their influence and interest in the project: In small groups 1. Identify your stakeholders (perhaps using a brainstorm on the flipchart) 2. Prioritise your stakeholders – assess their influence 3. Understand your stakeholders – assess their interest 4. Place stakeholders in influence and interest grid on flipchart
The tool highlighted existing relationships with stakeholders and explored the possibility of working with these existing contact to share messages and increase awareness – it also helped to avoid stakeholders from being bombarded with the same message from lots of different people! Then bring all of the small groups together to form a larger group and: 5. Compare and discuss the position of stakeholders between groups 6. Reconcile any differences in the position of stakeholders 7. Agree a finalised stakeholder matrix
Using the Results • Use this increased and improved awareness to develop different approaches to engagement of different stakeholder groups
Further Information This has been used in the Welland Pilot to identify and understand stakeholder groups. Welland Pilot contact:
[email protected] An additional information sheet can be found at: http://www.mindtools.com/pages/article/newPPM_07.htm
Timelines
Basic
Ideal For:
1 hour to 1 day
Steering Group Members and Members of the Public
Equipment: Computer software that allows you to draw graphs
Skills:
Data Analysis and IT Skills
Identifying issues Engagement Information gathering Public awareness
Method to track changes that have occurred in the catchment area – from changes in biological water quality to river species diversity Getting Ready • Decide on what type of information you want to show in a graph • Find out if the necessary data is available • Request and access necessary data
Specialist software is not needed – even Microsoft Excel will do the trick! Recipe for Success 1. Analyse the data that you have and consider: • Whether the data relates to the project outcomes • The amount of data available and the timescale that it is available for 2. Select the data and timescale most appropriate 3. Decide upon the best type of graph – line graphs or bar charts are useful for showing data changes over time 4. Ensure that the timeline is presentable and: • Has an appropriate title • Has a scale that matches the data • Has an appropriate and clear key (if appropriate) • Is in colour (if possible)
Be ready to talk to potential participants about the project and then encourage them to ask questions, make suggestions or fill in questionnaires or surveys Using the Results • Effective way of show how chemical concentrations have changed over time (might be easier for stakeholders to understand and visualise as opposed to tables of data) • This method has been used in the Lower Wear pilot catchment
Further Information This tool has been used by the Lower Wear Catchment Pilot, for more information please contact: George Gerring,
[email protected]
Terms of Reference Terms of Reference The groups aims to accomplish X, Y and Z by a certain date. The group will be led by...and reporting to the Steering Group will be done in this manner…The membership of the group will consist primarily of…and can be extended to include…We have identified the following knowledge, expertise and skills necessary to complete our previously stated aims…
Basic
2 - 10
15 to 30 minutes
Ideal For: Steering Group Members Equipment: Paper and pens Skills: Communication Skills
Identifying issues Decision-making
Creating a Terms of Reference for Task and Finish Groups Getting Ready • •
Establish the need for a Task and Finish group Define the aims and objectives of the Task and Finish group
The Terms of Reference should be developed when the Task and Finish group first begins Recipe for Success This activity can be run as a group discussion that could cover the following: 1. Scope of the group (what are its key aims and will the group end after it has accomplished its aims, or by a set date etc.) 2. Leadership of the group – who will chair the meetings, but also how group decisions are made (majority vote or similar) 3. Reporting to the steering group (when does this happen and who does this?) 4. Size of the group (a maximum of 6 might be best, but it depends on the task) 5. Membership of the group (which interests may need to be represented in this task and how many representatives from a single group can attend) 6. Knowledge, expertise and skills needed in this group
The Terms of Reference provides direction to the Task and Finish group, and allows progress towards the group’s key objectives to be measured Using the Results • Provides a structure for the Task and Finish groups • Allows potential Task and Finish group members to be identified and approached
Further Information Reference: Adapted from material by Environment Agency and InterAct Networks (2012) Collaborative working in practice: Planning collaborative work. Training course for pilot catchment staff, version 2. March 2012. InterAct Network partners: Lindsey Colbourne, Penny Walker, Lynn Wetenhall and Helena Poldervaart.
Visioning Start
Basic
2 - 12
30 to 60 minutes
Desired Future Steering Group Members and Stakeholders Equipment: Flipchart, A3 paper, Post-it notes and Marker pens Skills: Group Facilitation Skills
Ideal For:
Necessary Changes
Outcome
Catchment Plan
Identifying issues Decision-making
A tool to identify a desired future scenario and then plan how to reach it from the current situation Getting Ready •
• •
Set up equipment and put out a sheet of flipchart paper for each group of up to 4-6 participants Gather group of stakeholders Provide brief overview of project background to stakeholders, including a description of the main commonly-agreed characteristics (5-10mins)
You could call this activity ‘future planning’ if you think that your participants will find the term ‘visioning’ too airy-fairy Recipe for Success 1. Divide the participants into groups of 4-6 2. Ask each group to brainstorm the characteristics/components that they want the catchment to have at a specific future data (e.g. in 5 years’ time, in 10 years’ time etc.) 3. Bring the groups together for a whole group discussion: ask for a representative from each group to provide feedback to the whole group on their discussions 4. Work with the group to agree and record on a flipchart the main characteristics/ components of the catchment for an ideal future; remove this sheet and pin it next to the flipchart 5. On a new page of the flipchart, identify the current situation of the catchment for each of the characteristics/components (depending on the time you have for this exercise, you may need to agree to focus on a small number of key components) 6. Get the group to discuss and record how to move from the current situation to the idealised future (identify problems and solutions with post-it notes) 7. Once the pathways between the current situation and idealised future have been identified, move on to suggesting actions and delegating responsibility for tasks
Using the Results • Promotes the creation of a shared vision of desired project outcomes • Achieves a shared understanding of current problems • Allows stakeholders to think about the process and complexity of delivering desired project outcomes
Further Information Similar to Backcasting, however Visioning looks at what needs to be done to achieve an idealised future with the existing groups/structures, while Backcasting works from the idealised future and so allows for the possibility of change (or even elimination) of existing groups/structures, should this be necessary to achieve the idealised future.