Categorization of Display Ads using Image and Landing Page Features Kin Kan, Vijay K Narayanan, Dragomir Yankov
Andrew Kae Department of Computer Science University of Massachusetts, Amherst MA
[email protected]
Yahoo! Labs, Santa Clara CA
{kkan,vnarayan,yankov}@yahoo-inc.com
ABSTRACT
Categories and Subject Descriptors
We consider the problem of automatically categorizing display ad images into a taxonomy of relevant interest categories. In particular, we focus on the efficacy of using image features extracted by OCR techniques from the ad images, in addition to the features from the text in the title, keywords and body of the landing page of the ad, and the features of the advertiser, in predicting the category of the display ad. An automated ad categorization tool has multiple uses in display advertising including increasing the ad categorization coverage, scaling up the ad categorization capacity to handle large volumes of ads by reducing the amount of human editorial effort and better utilizing the human editorial experts to focus on categorizing difficult ads. The ad image and landing page features extracted in this ad categorization system can also be used to improve the matching and ranking steps of ad selection algorithms in display ad serving systems. We learn multiple one-versus-rest SVM models to categorize the display ads, from a historical dataset of ads labeled into these categories by human editors. The OCR features extracted by common open source tools are by themselves noisy, and models trained using only the OCR features are not competitive with the performance of models trained using the landing page features. However, for categories with a small number of training examples, the OCR features improve the categorization performance metrics when used in addition to the features from the landing page. The OCR features also provide a useful signal to predict the category of an ad when features from the landing pages are not available. Our models have an average precision of 0.6 and recall of 0.37 over more than 1200 categories when evaluated on a hold out dataset. The precision and recall values are considerably higher for categories with larger amounts of training data, with precision larger than 0.84 and recall larger than 0.7 in all the categories that have more than 100,000 samples in the training dataset. Features from the text in the body of the landing page of the ads increase the recall of the categorization models and to a lesser extent increase the precision of these models, especially in categories with a smaller number of training samples.
H.4.m [Application and Experience]: Web content categorization, display advertising; D.2 [Software Engineering]: Multi-class classification; I.4.9 [Image Processing and Computer Vision]: Applications
Permission to make digital or hard copies of all or part of this work for personal or classroom use is granted without fee provided that copies are not made or distributed for profit or commercial advantage and that copies bear this notice and the full citation on the first page. To copy otherwise, to republish, to post on servers or to redistribute to lists, requires prior specific permission and/or a fee. LDMTA 2011 San Diego, USA Copyright 2011 ACM 978-1-4503-0844-1 ...$10.00.
General Terms Display Ad Categorization
Keywords Display Advertising, Multi-Class classification, OCR
1. INTRODUCTION Advertising is a critical economic driver of the internet ecosystem, with internet advertising revenues estimated to be around US $5.9 billion in the first quarter of 2010 alone1 . This online revenue stream supports the explosive growth of the number of web-sites and helps offset the associated infrastructure costs. There are two main types of advertising depending on the nature of the ad creative: textual advertising in which the ads contain text snippets similar to the content of a web-page, and display advertising in which the ads are graphical ad creatives in various formats and sizes (either static images or interactive ads that change shape and size depending on the user interaction). Text ads are typically displayed in response to a search query on the search results page, while display ads are shown on other content pages. Advertisers book display advertising campaigns by specifying attributes of the site where their ads should be displayed and/or the attributes of users to whom the ads can be shown. Then, ad serving systems select the ads to show based on the relevance of the ad to either the content of the page, the user, or both. This serving typically involves 2 steps: (i) a matching step which first selects a list of ads that are eligible to be displayed in an ad-serving opportunity depending on the user, attributes of the page, and requirements from the advertiser (ii) a ranking step which then orders the list of eligible ads based on some objective function (such as relevance or expected revenue). The algorithms in these matching and ranking steps leverage data about the available ads, the content of the pages on which the ads are to be shown and the interests of the user. Typical display ad campaigns do not require the advertiser to give much more information about the ads themselves, other than that they meet certain quality requirements (for example, the image should not contain any offensive content and should render correctly on the browser). 1
http://www.iab.net/AdRevenueReport
One common feature used in these matching and ranking steps is the category of the component entities (pages, queries, ads), from among a set of relevant user interest categories (e.g. Travel, Finance, Sports). These categories are either assigned manually by editors or automatically using machine learned categorization tools trained from some historically labeled set of entities. It is easy to train machine learned categorization tools to categorize content pages [15], queries [17] and text ads by using standard feature construction techniques used in information-retrieval (bag of words representation, term-frequency-inverse-document frequency feature weights). Display ad images on the other hand do not lend themselves to easy feature representations. Categorization of display ads typically involve large scale manual labeling by a large team of human editorial experts. In this paper, we investigate the efficacy of extracting features from display ads using optical character recognition (OCR) tools and leveraging them for use in categorization. Specifically, we present results from training machine learned categorization models using the features extracted from the text in the display ads themselves along with other features from the web-page of the advertiser that the user is re-directed to when clicking the ad (also known as the landing page of the ad). An automated machine learned categorization system to categorize display ads has multiple uses including:
example, Flash or animated ads typically also had a corresponding static image creative in order to display on browsers that do not support Flash or animation. Similarly, some ads had multiple landing pages, depending on which part of the ad is clicked. On the other hand, some campaigns had ads served by third party ad servers in which case the image URLs were single pixels that redirected to other ad servers and were therefore no longer available, or had image URLs which were not valid any longer and hence did not return valid ad image creatives during the crawl. In addition, some of the landing page URLs are Javascripts that generated the landing pages dynamically and were not supported any longer, or required the user to login to see the contents. In both these cases, the landing page crawls returned empty crawl results. We assign a unique identifier called an adid to each pair of a display ad and its corresponding landing page. Many of these ads were also categorized into relevant nodes in a taxonomy by a team of human editors. Table 1 shows the statistics of the dataset assembled from these crawls. There are a total of 3,100,125 total adids in this sample, of which 1,501,192 (48.4%) are categorized into a taxonomy of user interests by a team of human editors. All of the display ad categorization experiments presented in this paper are on this dataset of editorially categorized ads. Some salient characteristics of this dataset are:
• Improve the efficiency of manual categorization by suggesting a list of plausible categories from which the human editors can choose the best set of categories.
• An editor has assigned category labels to each ad according to an interest taxonomy that is also used to categorize online content (pages, queries) and advertisers.
• Backfill the categories of ads which the human editors are not able to classify on time. This is especially useful for ads from advertising campaigns of short duration where the campaigns may even end by the time the ads pop up in the ad categorization editorial queue.
• The dataset is multi-label, that is, a single adid can be labelled with multiple categories. On average, there are 4 labels for each adid.
• Better utilize the human editorial judgments by classifying the ads that are easy to categorize using the tool itself, and request human editorial help only for those ads that are difficult to categorize in an automated manner. • The features from the ad image creatives and their landing pages can be used as a channel of attributes in matching and ranking algorithms used in ad-selection. The outline of the paper is as follows. Section 2 describes the dataset and the features used to train the categorization models to predict the category of the display ad. Section 3 discusses the experiment set up, the training pipeline and the evaluation metrics. Section 4 presents the performance results of the ad categorization models and Section 5 concludes with some ideas for future work to improve the categorization models.
2.
DISPLAY AD CATEGORIZATION
2.1 Dataset We analyzed a random sample of display ads from the display ad campaign database of a large ad network which contains the URLs of the display ad images and the URLs of the landing pages, along with other attributes of the advertiser. These display ads were used in a sample of display ad campaigns that have run in the past on the ad network. However, since the display ad images and landing pages were not saved, we crawled both the image and landing page URLs to extract the image creatives and the contents of the landing pages. Some of the ads contained multiple images. For
• There are a total of 1239 categories in this dataset, of which 110 categories have more than 10,000 ads labeled into them. The six most popular categories in this dataset include Travel, Finance, Retail, Technology, Entertainment, Consumer Packaged Goods. Table 2 shows the fraction of ads in this dataset with non-empty images and landing pages. About 53% of the adids in the categorized dataset contain a landing page greater than 100 bytes, and about 46% of the adids contain at least 1 image with more than 100 pixels in area. 2 Figures 1 and 2 show the distribution of pixel areas and landing page size respectively, for the 3.1 million ads. For each ad, the largest creative or landing page associated with that ad is used to generate the figures. Most of the valid display ad images are of sizes between a few hundred pixels to a few hundreds of thousands of pixels in area, and most of the landing pages are about a few hundreds of thousands of bytes in size. Figure 3 shows the distribution of adids in each of the 1239 categories, sorted in decreasing order. Most of the examples in the dataset are in the top 100 categories by volume, and these top categories contain at least 10,000 ads categorized into them.
2.2 Features Table 3 shows the types of features used to train the ad categorization models: (i) advertiser category, (ii) features extracted from the text characters recognized from the ad image (OCR features), 2 It is necessary to enforce this minimum area of 100 pixels because some image URLs are used to redirect ads to third party ad servers and consist of only a single pixel. Almost all the valid display ad images contain more than 100 pixels
Table 1: Statistics of the ad dataset Description whole dataset ads with at least one image larger than 100 pixels in area ads with at least one landing page over 100 bytes in size ads with human labeled categories categorized ads with at least one image larger than 100 pixels in area categorized ads with at least one landing page over 100 bytes in size unique categories among the categorized ads
Statistic Dataset Image Landing Page Categorized Dataset Categorized Image Categorized Landing Page Total Number of Categories
Frequency 3100215 1116334 1926001 1501192 692201 795962 1239
Percentage 100.00 36.0 62.1 48.4 22.3 25.7 -
Table 2: Coverage of Images and Landing Pages in the categorized ads dataset Statistic Description Frequency Percentage Categorized ads ads with manually labeled categories 1500192 100 Images only ads with only images 189160 12.6 Landing Page only ads with only landing pages 292921 19.5 Both Images and Landing Page ads with both images and landing pages 503041 33.5 Neither Images nor Landing Page ads with neither images and landing pages 516070 34.4
Distribution of Ad Filesizes 1.2e+06
500000
1e+06
400000
800000 Number of Ads
Number of Ads
Distribution of Image Area Ranges 600000
300000
600000
200000
400000
100000
200000
0
0 0
50
100 500
1K
5K
10K 50K 100K 500K 1M
5M
0
50
100 500
Image Area Ranges
Figure 1: Distribution of pixel areas of the creative with the largest area for each ad. The spikes at 0 pixel and 1 pixel correspond to ads that did not have a valid image creative from the crawl, and images that were single pixels used to re-direct the ad calls to third party ad servers.
(iii) content features extracted from the text in the body of the landing page of the ad, and (iv) features extracted from only the text in the title and the meta tag of the landing page. We elaborate more on each of these four feature types below.
2.2.1 Advertiser Category Feature This feature is the category of the advertiser from the same taxonomy into which the ads are categorized. These advertiser categories are assigned by human editors depending on the industry of the advertiser. Of the total 1,501,192 categorized ads, 848,786 (56%) also have an advertiser category. Less than half of the categorized ads do not have a corresponding advertiser category. Among the ads with advertiser categories, there is no overlap between the advertiser and ad categories in about one-third of the ads. Hence, in more than two-thirds of the ads the advertiser category cannot be used to reliably categorize the ads. However, when the advertiser category is available, the advertiser category and the ad category are
1K
5K
10K 50K 100K 500K 1M
5M
Filesize Ranges
Figure 2: Distribution of sizes of the largest landing page for each ad. The spike at 0 bytes corresponds to ads where the crawl was not successful in retrieving the contents of the langing page.
identical in about one-third of the ads and one set of categories is a subset of the other set in about 40% of these cases. The advertiser category may not cover all the products for which the advertiser might run the advertising campaigns. For example, an entertainment electronics advertiser may be categorized into the categories: TV, Cameras, Game systems; however, a specific campaign, and the corresponding display ad may be about DVDs which is more appropriately categorized into Movies/DVDs. Thus, the advertiser category is a useful feature for predicting the ad category when available, but it has limited coverage and may not always be identical to the ad category. Hence, we always use the advertiser category in addition to the various subsets of features in each experiment.
2.2.2 OCR Features Many display ads contain text which can be used as an additional channel of information about the ad. In particular, this feature will be especially valuable in cases where we are unable to crawl the landing page and thus have to rely on OCR features alone to cate-
Types of Features Advertiser Category OCR Content Title+Meta (LP)
Table 3: Types of Features Description the advertiser category of ad bag of words from OCR output of ad image bag of words from text in body of landing page bag of words in the TITLE + META tags of landing page
Number of Adids 1269767 729063 2068365 1475722
% 40.96% 23.52% 66.72% 47.60%
Number of Unique Features 430 451607 1422893 163468
of text. In our dataset, 23.5% of ads have at least one OCR feature, and ad images with at least one OCR feature have an average of about ten OCR features.
250000
200000
Number of adid’s
2.2.3 Content Features 150000
100000
50000
0
1
10
100
1000
10000
Categories in descending order of number of adid’s
Figure 3: Distribution of Categories
gorize a display ad. Note that in Table 2, about 13% of the ads have only images and no landing pages. We extract text features from display ad images using the popular open-source OCR program, Tesseract [1]. Tesseract is a commandline tool that takes a tif image as input and outputs the text found in the image. As described in [16], Tesseract follows a pipeline design where ink blobs are first grouped together and then lines of text are detected. The text is recognized by comparing the ink blobs to pre-stored training data. A novel feature of the current version of Tesseract is that it performs recognition in two passes. In the first pass, it selects certain highly confident words to be used as additional training data to better recognize the text in the second pass. Tesseract is mainly used to process images containing blocks of text (found in scans of books, for example), where the font is mostly fixed, and the image consists of black text on white background, with limited variability in the layout. This is different from the setting seen in typical display ad images such as in Figure 4. Tesseract performs best for display ads with text that is written in a font that is already known to Tesseract, and is written mostly in a straight line. However, in a typical display ad image, the amount of text is sparse in comparison to the image size (which makes line detection difficult) and there can be multiple fonts with different background and foreground colors, and text in arbitrary layouts (for example, text can be written vertically). Since Tesseract was not designed or optimized to detect text from these types of images, the extracted text output can be noisy. Therefore, we perform simple post-processing of the output of Tesseract on display ads by converting all extracted text to lower-case letters and keeping only the alpha-numeric strings. We also used ImageMagick [2] to resize the display ad images and convert them to grayscale before processing with Tesseract since we found these pre-processing steps lead to better extraction
The landing pages of display ads are dynamic in nature with advertisers constantly updating the content that users see once they click on an ad. Regardless of the frequent updates of the content we decided to include it as an additional information source in our system. The implicit assumption here is that even if the advertisers modify the landing page content they have an incentive to keep it semantically relevant to the category of their ad. We therefore crawled the landing pages for a significant amount of the ads in our data (see Table 3) and extracted their content as seen at the time of the crawl. Note that for over 30% of the ads in the system, the corresponding landing page has already been removed by the advertiser; still for the remaining examples, as will be shown shortly, the landing page content provides extremely valuable signal to categorize the corresponding ad. We parse the page content by using the generic Mozilla html parser. All non-alphanumeric characters are removed and the words are lower cased. We then construct a bagof-words representation using the unigrams that appear within the body tag of the page. We choose the unigram bag-of-words representation because of its simplicity and its superior performance for large scale datasets (such as the one discussed here) over the more complex entity or n-gram based representations [5]. Unigrams that do not appear in at least five training examples are ignored and a stop-word list is further applied to remove high frequency uninformative unigrams, such as the, of, and.
2.2.4 Title+Meta Features Often, looking at the body of the landing page may introduce a lot of noise in the feature space. Some landing pages for example contain only links to other pages or offers (in terms of links or banners) for more products or services. There are also many landing pages with a lot of dynamic content embedded in them including scripts, Flash, and CSS. Parsing and extracting the text from the body tag of such pages is prone to numerous errors and ultimately the obtained signal does not significantly boost the performance of the categorization system. We therefore extract the unigrams appearing in the title and the meta tag (if present) of a landing page as a separate set of features. Our assumption is that they are a cleaner source of information which stays semantically related to the topic of the ad even in cases when the rest of the page content is not so descriptive. The title and meta tags are processed in a similar fashion to the text from the body tag (see Section 2.2.3). We treat these features as a signature of the landing page and hence refer to them as LP features as opposed to Content which we reserve for the textual features extracted from the body tag of the page. Note, that though Content features may include some or all LP features adding them together produces different results as the unigrams that appear in both sets are being assigned higher weights during training which boosts their importance.
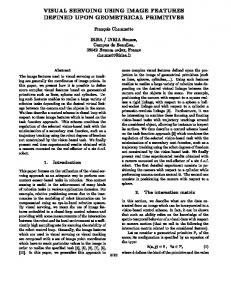
Figure 4 shows an example of a display ad along with its associated landing page, and Table 4 lists the four sets of generated features for this particular ad.
(a) Ad image
Such words could be terms that occur frequently when the landing page contains comments (comment, post) or frequently asked questions (reply, faq). Using the above representation we now train multiple linear onevs-rest binary models for each category in the data. As a specific underlying algorithm we use linear SVMs and more precisely we use the publicly available implementation LIBLINEAR [11]. The choice of linear SVMs as an underlying model is based on one hand on the overwhelming evidence from the literature that the method is practically the best off-the-shelf classifier for large scale (both in terms of examples and features) text categorization [12]. On the other hand, we also performed experiments using Naive Bayes, boosted decision trees and logistic regression as underlying models but the results were inferior or on par with the ones obtained using linear SVMs. We used default values for the parameters in this training algorithm; the tradeoff parameter C was set to one and we weighted equally the train errors on both positive and negative examples. It is known that SVMs are not perfectly calibrated especially in the case of unbalanced classes [14]. Therefore, before computing the accuracy of the individual one-vs-rest models we also convert their scores into calibrated probability scores using the pairadjacent violators method [21]. For evaluating the system (see Section 3.2) we take as threshold the calibrated score of 0.5, and not the default SVM threshold of score 0, i.e. examples with calibrated scores larger or equal to 0.5 are assumed to be predicted as positive and the rest as negative.
3.2 Metrics (b) Landing page Figure 4: An example of a travel ad: an ad image and its associated landing page.
Table 4: Features of the ad and landing page shown in Figure 4 Feature Advertiser Category OCR Content Title+Meta
3.
Value travel travel, hotels, under, per, click, here flights, compare, prices, popular, cheapest yahoo, travel, flights, book, cheap, cheapest, flights, online, yahoo, travel, uk
EXPERIMENTS
3.1 Experimental Setup We test the performance of our ad categorization system using the dataset of over 1.5 million multi-labeled display ad examples (see Table 1). We split the data uniformly at random into 70% train and 30% test sets. We combine the features extracted from the four types of sources discussed in the previous section into a single feature map - each feature is assigned a unique identifier representing a dimension in a high dimensional vector space. The vector spaces used in the evaluation contain around 200,000 dimensions. Finally, the vectorized examples are L2 -normalized, i.e. we map them into points on the high dimensional unit sphere. We find that L2 -normalization improves the categorization performance when some pages contain multiple occurrences of words that are not semantically significant in the context of display ad categorization.
We compute a number of metrics that illustrate the gains introduced to display ad categorization by combining the described feature sources. Specifically, we compute: Accuracy The number of correct guesses by the model at the operation point divided by the total number of test cases: (TP + TN) / (TP + TN + FP + FN), AUC, Precision at operation point: TP / (TP + FP), Recall at operation point: TP / (TP + FN), F1 score at operation point, and max-F1 score, the maximum F1 score achieved for any point along the Precision-Recall curve. TP are the true positives at the operation threshold, TN the true negatives, FP the false positives, and FN the false negatives. Accuracy and AUC are the two most widely explored measures throughout the information retrieval literature. However, for unbalanced datasets, AUC can often indicate misleadingly high values [9]. Furthermore, in large scale production systems, business rules are usually set with respect to precision and recall, i.e. a system is required to achieve certain levels of precision and recall in order to be deployed. The harmonic mean, F1 score, is a suitable single measure to consider when practitioners are not certain how to interpret the tradeoff between the precision and recall they achieve with a certain model. Note again that accuracy, precision, recall and F1 are computed using as operation point the calibrated probability score of 0.5. Finally, max-F1 shows the optimal F1 score for any possible operation point.
4. RESULTS Table 5 shows the performance of the ad categorization models on the test dataset, when using different sets of features to train the categorization models. The performance metrics are averaged over all 1239 categories in the test dataset. There are 2 main conclusions from these experiments with different feature sets. • OCR features provide incremental performance lift, especially in the accuracy, precision and recall metrics, over and above the models using either the LP and Content features or
• Both the precision and recall (and consequently, the F1 score) are consistently higher for models using Content features. The Content features increase the precision and recall by almost 0.04 when added to a model using LP and OCR features, even though the accuracy is comparable.
Table 5: Ad categorization experiments with different feature sets Features OCR LP LP, OCR Content OCR, Content LP, Content LP, OCR, Content
AUC 0.9 0.91 0.91 0.92 0.92 0.92 0.92
Max-F1 0.4 0.50 0.49 0.54 0.53 0.54 0.53
Acc 0.94 0.90 0.96 0.94 0.97 0.95 0.97
Prec 0.51 0.58 0.6 0.63 0.63 0.63 0.64
Rec 0.26 0.37 0.36 0.39 0.39 0.39 0.4
F1 0.27 0.35 0.39 0.41 0.44 0.42 0.44
Table 6 shows a similar comparison of the metrics for models trained using different feature sets, when averaged over only those categories that have at least 10,000 instances in the training dataset. It is clear that the performance metrics are on average significantly higher for the categories with a large number of training instances. Specifically, • The precision is above 0.8 for all models, except for the model with OCR features where it is marginally lower (0.79). The precision for the OCR features only model is more similar to that of the models using other feature sets, compared to the previous case considering all 1239 categories where the OCR features only model had a much lower precision.
Table 8 shows the performance of the best performing model with LP, OCR and Content features on subsets of the test data containing only OCR features, only LP and Content features. The results show that the OCR features improve both the precision and recall when added to the LP and Content features, although the performance with only OCR features is inferior to that using LP and Content features alone. This incremental value of OCR features is more pronounced in the categories with smaller number of training examples. Table 8: Value of feature sets in the LP, OCR, Content model averaged over all 1239 categories Experiment Both OCR only LP, Content Neither
Features (Num. categories) OCR (94) LP (97) LP, OCR (100) Content (99) OCR, Content (101) LP, Content (99) LP, OCR, Content (101)
AUC
Max F1
Acc
Prec
Rec
F1
0.95 0.97 0.97 0.98 0.98 0.98 0.98
0.66 0.76 0.73 0.78 0.75 0.78 0.76
0.98 0.99 0.99 0.99 0.99 0.99 0.99
0.79 0.83 0.81 0.83 0.82 0.83 0.82
0.46 0.61 0.59 0.65 0.63 0.66 0.65
0.54 0.69 0.67 0.71 0.7 0.72 0.71
Table 7 shows the performance metrics of the model trained using the LP, Content and OCR features, for the five categories with the largest number of training instances in the data. While the precision is above 0.84 in all of these categories, the recall is significantly higher than the average recall in the 2 tables shown earlier (viz. 0.37 and 0.61). Specifically, the recall varies between 0.7 to 0.92, with 7 categories having recall above 0.8. The only exception is the Miscellaneous category with a lower recall of 0.59. This category is a default category containing a variety of different interests and is quite heterogeneous.
Max-F1 0.58 0.34 0.54 0.5
Acc 0.97 0.97 0.97 0.97
Prec 0.59 0.44 0.55 0.18
Rec 0.49 0.22 0.42 0.14
F1 0.52 0.26 0.45 0.13
Figure 5 shows the increase in average precision and recall when OCR features are added in addition to the LP, Content features as the number of training examples in the categories is varied. It is clear that both metrics increase monotonically with the number of training examples, with the precision improving significantly when there are more than 100 training examples and the recall improving significantly when there are more than 1000 training examples. The figure also shows that the OCR features improve the metrics when the number of training examples is smaller than these corresponding volumes, by providing an additional channel of features. However, for categories with a larger number of training examples, the noise in the extracted OCR features increases the number of unique features, and results in a small decrease in the overall metrics.
• Content features increase the recall consistently, when compared to models without using these features.
1
Precision
Table 6: Ad categorization experiments with different feature sets for categories with at least 10,000 positive instances in the training dataset
AUC 0.83 0.67 0.81 0.79
1
0.9
0.9
0.8
0.8
0.7
0.7
0.6
0.6
0.5
0.5
0.4
0.4
0.3
0.3 LP,OCR,Content Precision LP,Content Precision LP,OCR,Content Recall LP,Content Recall
0.2 0.1
Recall
the Content features alone.
1
10
100 1000 10000 Number of positive examples
100000
0.2 0.1 1e+06
Figure 5: Variation of Precision and Recall with the number of positive training examples in the categories, for models with and without the OCR features over the baseline model with LP and Content features. Table 9 shows the features with high weights in each of the feature sets used in the categorization experiments, in the two most popular categories in the dataset. It is clear that the OCR features with high weights are quite relevant to the ad category.
5. RELATED WORK
Table 7: Categorization performance of the LP, OCR, Content Model in the categories with the highest number of training records Category Num Positive Instances AUC MaxF1 Accuracy Precision Recall F1 Travel 224931 0.99 0.94 0.98 0.97 0.92 0.94 Finance 182837 0.99 0.92 0.98 0.94 0.90 0.92 Retail 170211 0.97 0.83 0.95 0.85 0.80 0.82 Travel/Destinations 163553 0.99 0.88 0.97 0.87 0.88 0.88 Technology 159962 0.96 0.78 0.95 0.85 0.68 0.76 Entertainment 136396 0.96 0.80 0.96 0.91 0.71 0.80 Consumer_Packaged_Goods 120235 0.96 0.77 0.96 0.84 0.70 0.76 Travel/Hotels_and_Lodging 116747 0.99 0.94 0.99 0.96 0.92 0.94 Miscellaneous 110837 0.93 0.70 0.96 0.84 0.59 0.70 Automotive 95910 0.99 0.93 0.99 0.95 0.90 0.93 Life_Stages 86073 0.98 0.87 0.98 0.84 0.83 0.83
Table 9: Salient features in the LP, Content, OCR model in each of the feature sets. Category Advertiser category OCR Content Title Meta Travel Cruises hotels tourism hamshire visit Budget Airlines airlines voyage airways rentals Online Travel Aggregator fares skylights explore airlines Finance Currency Trading mortgage homes insurance account Real Estate insurance annuity investments billing Student Loans refinance disclosures markets job
Most works on ad categorization discuss the problem within the settings of textual advertising. The textual content of the ad (creative and/or bid phrases and title) is categorized within some taxonomy and then matched against the category of a query [3][4] or a web page [6][8][13] on which the ad will potentially be shown. Having such textual content facilitates the categorization task significantly, but as argued here and also pointed by [10] is not readily available in display advertising. Beker et al.[3][4] study the effect of landing page categorization on user experience by defining a small taxonomy (with four nodes) into which landing pages are classified. However, they do not try to infer a correlation between the topical category of the ad and its landing page. Instead, here we demonstrate landing page (augmented with OCR features) categorization within a much larger interest taxonomy of over 1000 nodes which is a significantly harder task, but provides us with a topical category for the ad. This is essential for applying successfully subsequent advertising strategies such as content matching or behavioral targeting. Choi et al. [7] also study the effect of landing page features in improving ad relevance in textual advertising. They show that augmenting the ad textual features with features from the content of the page increases metrics such as the Discounted Cumulative Gain (DCG) when computing the relevance quality of query-augmented textual ad pairs. Again the authors do not try to learn a multi-topic model for their ad in order to be able to categorize them which is the goal of the system described here. Ad and placement page categories are learnt in [6] and then used to infer proper matching for the purpose of contextual advertising, yet as already noted the textual content of ads in contextual advertising is much richer and cleaner than their display ad counterparts. Furthermore, pages used for placing contextual ads also typically contain rich and clean content such as financial web sites and news articles. Landing page are usually sparser in content and often contain poorer content quality, containing links to other web sites, multiple images or links offering other products with diverse and uncertain origin.
In a study of display ad categorization, Edelman[10] discusses the problem of brand safety or sensitivity [15] at the Right Media ad exchange. Advertisers there are required to mark their ads into several categories, such as suggestive, violent, deceptive, and publishers then decide whether such ads are safe to show on their content. As advertisers do not have a clear understanding of these categories, they often end up manually labeling their ads into categories which prevent them from being displayed effectively. Therefore, Right Media builds an automatic system for categorizing the ads. Again, the taxonomy is much more limited (between ten and fifteen nodes) than the interest taxonomy discussed here. In addition, the system does not utilize OCR and landing page features and the objective is significantly different - obtain high precision to ensure brand safety, while in our system we aim for reach (recall) along all interest categories with reasonable precision. There have been earlier efforts to categorize offline media [18], and to extract text from images such as print advertisements using a system which roughly follows the same pipeline structure as Tesseract [20]. More recently, there are efforts in the field of Scene Text recognition to extract the text from an image of a natural scene, such as store fronts or billboards [19]. However, the problem domains are fairly different in that display ad images are generally of lower resolution and contain more variations in fonts, colors and layouts. To the best of our knowledge, this is the first attempt at using visual features for large scale categorization of display ads.
6. CONCLUSIONS AND FUTURE WORK We have developed a system to automatically categorize display ads into a set of categories using machine learned categorization models trained on historical data of ads labeled into these categories by human editors. We have explored the efficacy of using features extracted from the display ad images using OCR techniques, features from the landing pages of the ads including the title, keywords and the body of text, and the attributes of the advertiser. The precision of these models is above 0.8 for categories with a large number
of training examples, when evaluated on a hold out evaluation set. The recall of the models increases substantially when adding features from the body of text in the landing pages. The OCR features are quite noisy and by themselves are not competitive when used in isolation, but provide incremental value when added to the features from landing pages, especially in categories with a small number of training examples. The OCR features also provide valuable feature sets to predict the display ad category when the features from the landing pages are not available (due to crawl failures). To our knowledge, this is the first attempt at using OCR features to automatically categorize display ads on a large scale. We are currently working on enhancing the quality and coverage of the categorization models by post processing the noisy OCR features (correcting them using edit distance metric to the nearest word in a dictionary), performing feature selection to reduce the dimensionality of features by either retaining features with higher support or features with the highest tf-idf values in the corpus, and experimenting with the category of the landing page itself as a feature both instead of and in addition to the LP and Content features. We are also experimenting with using different modeling techniques, including (i) training models using different feature sets in isolation, and combining the results using voting methods, (ii) using unlabeled data in a semi-supervised setting to increase the volume of labeled data. Finally, encouraged by the initial results from this experiment of using image features to train categorization models, we are experimenting with more advanced image features using computer vision techniques including the texture, and whether an image contains a face or not.
7.
REFERENCES
[1] http://code.google.com/p/tesseract-ocr/. [2] http://www.imagemagick.org/script/index.php/. [3] Hila Becker, Andrei Broder, Evgeniy Gabrilovich, Vanja Josifovski, and Bo Pang. Context transfer in search advertising. In SIGIR ’09: Proc. of 32nd International ACM SIGIR Conference on Research and Development in Information Retrieval, pages 656–657, 2009. [4] Hila Becker, Andrei Broder, Evgeniy Gabrilovich, Vanja Josifovski, and Bo Pang. What happens after an ad click?: quantifying the impact of landing pages in web advertising. In CIKM ’09: Proc. of the 18th ACM Conference on Information and Knowledge Management, pages 57–66, 2009. [5] Ron Bekkerman and James Allan. Using bigrams in text categorization, 2003. [6] Andrei Broder, Marcus Fontoura, Vanja Josifovski, and Lance Riedel. A semantic approach to contextual advertising. In SIGIR ’07: Proc. of the 30th Annual International ACM SIGIR Conference on Research and Development in Information Retrieval, pages 559–566, New York, NY, USA, 2007. ACM. [7] Yejin Choi, Marcus Fontoura, Evgeniy Gabrilovich, Vanja Josifovski, Mauricio Mediano, and Bo Pang. Using landing pages for sponsored search ad selection. In WWW ’10: Proceedings of the 19th international conference on World wide web, pages 251–260. ACM, 2010. [8] M. Ciaramita, V. Murdock, and V. Plachouras. Semantic associations for contextual advertising. Journal of Electronic Commerce Research, 9:1–15, 2008. [9] J. Davis and M. Goadrich. The relationship between precision-recall and roc curves. In In ICML ’06: Proc, of the
[10] [11]
[12]
[13]
[14]
[15]
[16]
[17]
[18]
[19]
[20]
[21]
23rd International Conference on Machine Learning, pages 233–240, 2006. Benjamin Edelman. Ad classification at right media. Harvard Business Publishing, 2009. Rong-En Fan, Kai-Wei Chang, Cho-Jui Hsieh, Xiang-Rui Wang, and Chih-Jen Lin. Liblinear: A library for large linear classification. J. Mach. Learn. Res., 9:1871–1874, 2008. Thorsten Joachims. Text categorization with support vector machines: learning with many relevant features. In ECML ’98: Proc. of 10th European Conference on Machine Learning, pages 137–142, 1998. Vanessa Murdock, Massimiliano Ciaramita, and Vassilis Plachouras. A noisy-channel approach to contextual advertising. In ADKDD ’07: Proc. of the 1st International Workshop on Data Mining and Audience Intelligence for Advertising, pages 21–27, New York, NY, USA, 2007. ACM. Alexandru Niculescu-Mizil and Rich Caruana. Predicting good probabilities with supervised learning. In ICML ’05: Proc. of the 22nd International Conference on Machine learning, pages 625–632, 2005. Suju Rajan, Dragomir Yankov, Scott J. Gaffney, and Adwait Ratnaparkhi. A large-scale active learning system for topical categorization on the web. In WWW ’10: Proc. of the 19th International Conference on World Wide Web, pages 791–800, New York, NY, USA, 2010. ACM. Ray Smith. An overview of the tesseract ocr engine. In ICDAR ’07: Proceedings of the Ninth International Conference on Document Analysis and Recognition, 2007. Lei Tang, Suju Rajan, and Vijay K. Narayanan. Large scale multi-label classiification via metalabeler. In WWW ’09: Proc. of the 18th International Conference on World Wide Web, pages 211–220, New York, NY, USA, 2009. ACM. Jinqiao Wang, Lingyu Duan, Lei Xu, Hanqing Lu, and Jesse S. Jin. Tv ad video categorization with probabilistic latent concept learning. In MIR ’07: Proc. of the International Workshop on Multimedia Information Retrieval, pages 217–226, New York, NY, USA, 2007. ACM. Jerod J. Weinman, Erik Learned-Miller, and Allen Hanson. Scene text recognition using similarity and a lexicon with sparse belief propagation. IEEE Trans. on Pattern Analysis and Machine Intelligence, 2009. Victor Wu, Raghavan Manmatha, and Edward M. Riseman. Textfinder: An automatic system to detect and recognize text in images. IEEE Trans. on Pattern Analysis and Machine Intelligence, 1999. Bianca Zadrozny and Charles Elkan. Transforming classifier scores into accurate multiclass probability estimates. In Proc. of the 8th ACM SIGKDD International Conference on Knowledge Discovery and Data Mining, pages 694–699, 2002.