Categorization of Sales Patterns to Use Blog Information as Book Sales Prediction Geun Chol Moon, Go Kikuta, Takashi Yamada, Atsushi Yoshikawa, Takao Terano Tokyo Institute of Technology, Japan Interdisciplinary Graduate School of Engineering Sciences
[email protected]
ABSTRACT This paper analyzes four bestselling books in series to find leading indicators of domestic book sales from conventional Blog information. Although Blog information is different from actual purchases, it will influence customer behaviors. They consider it would be useful for decision making of businesses and organizations. Main contributions of the paper are three fold: 1) confirms relationships between on-line information of the number of Blog reference and off-line information of book sales data; 2) observes different sales patterns by analyzing series books and identify factors and classify books into category; and 3) attempts to predict sales pattern based on sales data of three books.
Keywords word of mouth, blogs, Web marketing, demand forecasts, leading indicators, Internet sales, real retail sales
1. INTRODUCTION Currently, publishing industry in Japan has faced with difficult situation. Market size of publishing industry in last 10 years has been drastically decreased. Approximately 1.1 trillion yen of the market size in 1996 was decreased to 900 billion yen in 2007. More than 20% of the market was diminished within 10 year. Reasons for this market shrinking are the decline of youth population, the rapid transition from paper to electronic media, and less time on reading. Effective solution for this issue is not yet found [1]. Moreover, a factor that exacerbates the publisher's profit is not only the market shrinking but also the high return rate of 40%. Because of consignment inventory agreement between bookstores and publishers, most of publishers are not able to estimate accurate demand through numbers of order taking
Permission to make digital or hard copies of all or part of this work for personal or classroom use is granted without fee provided that copies are not made or distributed for profit or commercial advantage and that copies bear this notice and the full citation on the first page. To copy otherwise, or republish, to post on servers or to redistribute to lists, requires prior specific permission and/or a fee. ICEC’10, August 2-4, 2010, Honolulu, Hawaii, USA. Copyright 2012 ACM 978-1-4503-1427-5/12/04 …$15.00.
from bookstores. In previous research observed that there is lack of basic trust among bookstores, wholesalers and publishers. Each player seeks own profit rather than book industry as whole [2]. In other words, publishers are trying to avoid the risk of return from wholesalers and bookstores avoid opportunity loss by overstocking. For this reason, a decision making of additional printing for publishers is more likely to be delayed. Because publishers know that bookstores make multiple orders to keep their stock in secure. Thus, publishers are not able to make a decision of additional printing unless massive amount of order is actualized. In many cases, the timing of additional printing is delayed and ends up with oversupply of the book. In our previous research, we analyze relationship between number of Blog reference and sales date of books by using lag crosscorrelation coefficient to address this issue [3]. As a result, one of books has the strongest coefficient of 0.84 at -14 days in advanced that meets practical lead-time of Japanese publishers’ requirement. This result implies that Blog reference as possibility of an independent indicator of book sales. However, this research doesn’t mention any condition required to be success indicator. In this paper, we identify key requirements of leading indicator by analyzing different sales pattern of bestselling books.
2. NECESSITY OF EXTERNAL INFOMATION To find external information as a leading indicator of book sales predication for bookstore, wholesaler and publisher, we address to information on the Internet which has been flourishing in recent years. Only using a traditional source of information for managerial decision-making is not enough to solve complicated problem. Both quantitative and qualitative information on the Web should be used [4]. In addition, corporations should see consumers as a source of information producers rather than just an online shopper, also the information shared by other buyers [5]. As consumers increased means that "word of mouth on web" is a significant impact on purchasing and no longer ignore the information on the Internet [6]. Also information on the Internet is used by not only corporation but also researcher of marketing, politics, social psychology and government. They use the internet media to express own opinion and utilize others’ expression to help on research or decisionmaking [7]. Especially, Blog information that is available in large quantities and the real-time expression which taking advantage of the features has been actively used [8]. For these reasons, Blog information may be powerful information for decision making of publishers.
1
3. RELATED WORK Three previous studies found in the field of relationship between off-line information and on-line information of Blog. Hasegawa and Fujiwara conducted research on TV viewership rating, the number of votes in the Tokyo governor’s election, CD sales raking, and they informed that there is strong correlation between these statistical indicators and number of blog reference in all field. They also show Blog information as potential indictor to predict market share [9]. In order to improve correlation, they added other condition. For example "Name of Drama" AND "Interesting" ends up with higher correlation than name of drama alone. In other words, the Japanese name is not enough for TV dram search query, because generic noun may be contained. For TV viewership rating, the highest correlation observed after six days of broadcasting and the highest correlation for CD sales ranking is same day of CD sales releasing. This implies that reflection time on Blog is depending on the fields. Yoshida studies on relationship with movie sales and number of Blog reference and inform that movie sales and number of Blog reference are similar and following same pattern. According to movie industrial knowledge, sales of the first week is always the highest in the entire weeks of movie road show and dropped by 6% every week. To maximize revenue from each movie, all promotion is intensively in place a month before releasing until two weeks after releasing as industrial rule. They propose that reviewing the time allocation of promotion and invest more long period than typical intensive method to protect from the decline of the number of Blog reference which ends up with the decline of the movie box office sales [10]. This is very interesting insight yet, no practical evidence presented. In addition, this study is to evaluate all Blog to sort either positive, negative or middle categories. High performance film tends to contain large proportion of positive information, but low performance film also included fairly large proportion of positive information. For further analysis, consideration of other elements needs to be verified.
months period, confirms strong correlation between sales rankings and the number of Blog reference [13]. In addition, Blog information is classified as leading indicators, latter indicators, simultaneous indicators or irrelevant in this study. They inform possibility of leading indicator of sales ranking by 13 days in on-line environment. But this research doesn’t list condition required for leading indicator and has not analyzed in off-line environment. Both researches of books show interesting insight and motive us to pursue further research in different environment in Japan. In our previous research, we examined relationship between off-line information of sales data and on-line information of Blog reference of Japanese books to find out the possibility of Blog as an independent leading indicator of book sales. As a result, one of books we analyzed could meet 14 days of practical lead-time required from Japanese publishes. In this paper aims at 1) research relationship between sale data of bestselling books in 2008 and Blog reference 2) categorize sales pattern of four books 3) identify factor or condition required to be success (unsuccessful) indicator and 4) conduct sale forecast of the last book published in the series by considering sales pattern of three books published before.
4. DATA USED Sales data of four series books provided by a major wholesaler is used. Reason we select this books is the highest sales ranking in 2008. As Miyata’s observation, bookstores willing to be overstocked to avoid opportunity loss rather than out of stock for top sellers; therefore, bookstore orders extra amount of books than necessary. Most likely, bookstore returns overstock after peak of sales and ends up with high return rate [2]. Figure 1 shows top 100 sales ranking of 2009 by higher order. More than 30% of all sales come from top 10 titles and 50% of all sales from top 23 titles. Thus, there is more room for improvement to focus on top-selling books, in other words, limited improvement for low selling books.
Mishne and Glance extracted all Blog information sort into four categories either positive in prerelease, positive in post-release, negative in prelease or negative in post-release[11]. As a result, the highest correlation between the box office sales and positive in prerelease was observed. Also this research showed that lower correlation between the box office sales and positive in post-release. As previous study shows, there is relationship between Blog information and these off-line statistical indicators, however, more research and improvement required for practical use. A couple of previous researches are specific in book sales. Cheavlier researches relationship between Amzon.com and Barnes and Noble.com’s book review with the number of stars. Firstly, five stars which is the highest in the readers’ review is more than 50% of all reviews in both Amazon.com and Barnes and Noble.com [12]. On the other hand, the lowest review of one star is less than 10%. They emphasize on high correlation between sales ranking and number of reviews. That means that books with higher sales ranking have more reviews than lowers’ ones and tend to obtain more stars. As a result, reviews have positive impact on sales ranking. Gruhl and Guha’s study is analysis of correlation between sales ranking of 2,340 books of an online bookseller Amazon.com and number of Blog reference from July to October 2004 for four
Figure 1: Top 100 Sale ranking 2009 Title of the first book published in series is “B gatajibunno Setsumeisyo” by Jamais Jamais. Meaning of the title is “Explanatory Booklet of Blood Type B” in Japanese. Title of second book released is “Explanatory Booklet of Blood Type A” and third one is “Explanatory Booklet of Blood Type AB” and the last on is “Explanatory Booklet of Blood Type O”. Observation period is approximately 1 year from 1st of September 2007 to 20th of September 2008. This sales data is real-time sales
2
data and aggregated over 2,000 bookstores nationwide. Total sales volume is 182,159 and the highest number of sales is 56,558 copies, the lowest sale is 46,176. Table 1 : Overview of Sales Data Explanation
Number of copy sold
Total number of copy sold
182,159
Max.
56,558
Min.
46,176
Ave.
45,540
Yahoo! Blog Search was used for this research. Yahoo! Blog search is one of search engine software that automatically collected from the database to patrol the Internet from time to time, and mechanical services to display the search results, Yahoo! Blog search the not only Yahoo! Blog but also others Blog on the Internet. For example, Blog related to a specific topic can be efficiently found by one keyword and daily trend also display in graph. As a major feature of Yahoo! Blog search is that Blog or article written within one minutes can be reflected to check the latest information and topics. Observation period for the numbers of Blog reference is set longer than sales data 640 days from 1st of January 2007 to 1st of October 2008 is gathered to grab early symptom as possible. The number of Blog reference of title of four books in this period is 2,674. The highest number of reference is 1,218 and the lowest was 387. Table 2: Overview of Number of Blog Reference
Hypothesis 2: Different sales pattern can be observed among four books. Earlier book published in series has longer running to catch up sales than later books published. Hypothesis 3: Identify different factors and classify books into category. By observing first three books of sales pattern and number of Blog reference, we are able to address to sale forecasting of Blood Type O which is published in the last. Hypothesis 4: We able to forecast sales volume and sales pattern of Blood Type O by applying sales pattern of previous books (Blood Type A, B and AB) and number of Blog reference.
6. ANALYZING SALES PATTERENS Sales amount, number of Blog reference and correlation between sales and number of Blog reference presented in Table 3. Blood Type B was Sold on September 1st of 2007. 6 month later, Blood Type A was sold on April 1st of 2008. Less than two months later, Blood Type AB came up. Finally, Blood Type O was sold on July 31st of 2008. Four books are released within 11 months. Table 3 : Detail data of four books Blood Type
Sales
Blog
Ref.
Correlat
Release
Ref.
Ratio
ion
Date
B
56,558
1,218
2.2%
0.76
2007/9/1
A
44,899
491
1.1%
0.77
2008/4/1
AB
34,526
387
1.1%
0.86
2008/6/12
O
46,176
578
1.3%
0.83
2008/7/31
Blood Type B has the highest sale of 56,558, the second highest sales is Blood Type O of 46,176. Third one is 44,899 of Blood Type A and Blood Type AB was the lowest of 34,526. Number of Blog reference is from 387 to 1,218. Blood Type B is the highest and AB is the lowest.
Hypothesis 1: Strong correlation between on-line information of number of Blog reference and offline information of sales data of bookstores
Reference ratio (Number of Blog reference / Number of sales in the same period) was defined as an indicator in our previous research. The number of Blog reference is depending on books and difficult to determine whether the number of reference is sufficient for analysis. However, reference ratio is purely related to sales of each book to utilize as an indicator. Reference ratio also can observe quantity of unrelated data within Blog to determine whether additional query is required [3]. Since range of reference ratio is 1.1% to 2.2%, the amount of unrelated data is limited and no additional query required. Reason for this is titles of four books are fairly long and unique.
Time author published the first book of this series, he was a new comer in publishing industry and not famous so that sales may go slower than following three books. In contrast, following books of A, AB and O may quickly catch up sales than previous ones, because of synergy effect.
The range of correlation is 0.766 to 0.86. Strong relationship between number of Blog reference and number of sales in four books are confirmed. Therefore, hypothesis 1 of Strong correlation between on-line information of number of Blog reference and off-line information of sales data of bookstores is supported.
5. THE HYPOTHESES OF THE RESEARCH Reconfirm sale data and Blog reference has a strong correlation.
3
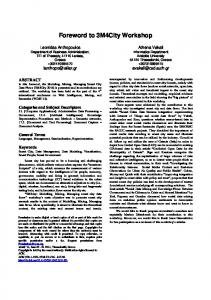
Figure 2 shows accumulated sales amount of each book. Blood Type B took 361 days to sell 56,558 books. However, Blood Type A took only 150 days to sell 44,899. To sell 34,526 books of Blood Type AB, 65 days needed. For Blood Type O, 31 days to sell 46,176. Although the total numbers of sales amount of four books are slightly different, different sales patterns may exist. In order to see sales patter of four books, break down of sales is presented in Table 4.
are different sales patterns. First category of sales pattern is Blood Type B. This book was not selling well at inception of book releasing and the sales grow slowly to become bestselling book. This book starts increasing its’ sales after releasing of 155 and gradually growing and remain the high and stable sales until the last day of observation. Table 4: Sales Speed and Pattern by Four Books
Figure 2: Accumulated Sales (Actual) This table shows days required to meet each scale of sales amount. Blood Type B took 155 days to sell 100 books. On the other hand, Blood Type A, AB and O took only 2 to 3 days to sell 100 books. It is noteworthy that Blood Type B (the first book published) took the longest period to achieve every single sales scale, Blood Type A (published in second) took second longest, AB is the third and O took the fastest in every sales scale. Importantly, this order follows at every scale and never cross the line. This observation implies that first book of Blood Type B increase recognition in marketplace so that later publications can be sold faster than previous one. In other words, this successful book series grow widely popular by a snowball effect. This is one of advantages for successful series to maximize synergy effect.
Figure 4: Sales Trend of Four Books from Day 1 Figure 3: Accumulated Sales (Modified) To visualize this effect, Figure 2 was modified into Figure 3. Because Blood type B took 155 days to sell 100 books, runway of 155 days was eliminated from Figure 2 to compare sales pattern. Sales pattern of four books are still same order. Hypothesis 2 of different sales pattern can be observed among four books and earlier book published in series has longer runway to catch up sales than later books published is supported.
Another category is Blood Type AB and O. No runway required to catch up sales. The highest sales at inception of releasing and sales quickly go down after the peak. Last category is Blood Type A. This is in the middle of Category B and Category AB and O, because no long runway as B and no large spike at inception as AB and O, but entire sales trend is more likely Category B. Trend of Sales data and Blog reference of Blood Type B and O is presented in Figure 5 and 6.
Sales trend of four books from publishing date of day 1 are presented in Figure 4. As mentioned in pervious chapter, there
4
can show a statistically whether the number of Blog mention could become a leading indicator of book sales.
Figure 5: Sales and Blog Trend of Blood Type B
Figure 7: Lag cross-correlation coefficient of Blood Type B Figure 7 is Lag graph shows Blood Type of B and Table 6 states highlight of Lag Cross-Correlation Coefficient. The peak value of Lag cross-correlation coefficient is 0.744 and time Lag of 0 days. Table 6: Lag Cross-Correlation of Blood Type B Range and Peak of Lag Cross-Correlation Coefficient Blood Type B Figure 6: Sales and Blog Trend of Blood Type O Table 5: Category of Sale Pattern with Factors
Trends of Blog reference between Blood Type B and O are also unlike. As sale of Blood Type B goes up, number of Blog reference is moving up and down and number of daily Blog reference start increasing for a long period as a shape of sales trend. On the other hand, Blog reference of Blood Type O is suddenly leaped on the date of publishing date and approximately 30% decreased every week. As far as we observe Blog reference against sale data, there is no symptom to predict huge amount of sales in advanced from trend of Blog reference for Blood type O. Discussion in this chapter is summarized in Table 5.
7. ANALYZING LAG CROSSES Another measurement of Lag cross-correlation coefficient is used for time series analysis. This is a measurement to see correlation between the number of book sold and the number of Blog reference, can be also seen the highest correlation by shifting time axis at same time; therefore, time lag of two variables can be analyzed simultaneously. In other words, Blog
Lag (days)
0.744 0.4 - 0.6
0.6 - 0.8
-43 ~ -18
-17 ~ 0
(Peak) 0
Figure 8: Lag cross-correlation coefficient of Blood Type O As shown in Figure 8, more than 0.6 Lag cross-correlation coefficient for -17 days and 0.4 days Lag cross-correlation coefficient for -43 days in advanced. In this case, the number of Blog reference is expected to meet 14 days of lead-time requirement from book industry. Same analysis applied to Blood Type O. Figure 8 shows that no time-lag between the peaks of the cross-correlation coefficient. Table 7 shows the detail analysis of Lag cross-correlation coefficient. Although the highest lag cross-correlation coefficient of Blood Type O is more than 0.9, time Lag of +1 day. Also the range of coefficient 0.4 to 0.6 is only -11 days. In this case, the number of Blog reference can’t be a leading indicator
5
of book sales. This result implies that different forecasting model needs to be developed for this category. Table 7: Lag Cross-Correlation of Blood Type O
8. SALE FORECASTING OF BLOOD TYPE O Although Hypothesis 4: We able to forecast sales volume and sales pattern of Blood Type O by applying sales pattern of previous books (Blood Type A, B and AB) and number of Blog reference is not supported, we utilize sales data of three books (B, A and AB) to predict sales pattern up to 30,000 books (accumulated sales with days) without Blog information. Because number of Blog reference under this condition, no longer useful. Predication method is fairly simple. We already know days required achieving specific sales amount from three books, as described previous Table 4. Table 7: Detail Calculation of Predication
Figure 9: Sales Predication against Actual Sales
9. CONCLUDING REMARKS Firstly, this paper reconfirms numbers of relationships between on-line information of the number of Blog reference and offline information of book sales data. Secondly, different sales patterns are observed by analyzing books in series. We identify different factors and classify books into category to determine whether number of Blog reference can be leading indicator of book sales or not. Finally, we attempted to predict sales pattern based on sales data of three books. Two points are issues for further improvement. First, factor listed for categorization is not enough for a decision making; therefore wide range of bestselling books need to be analyzed to indentify more factors. Secondly, usage of Blog reference for predication is not yet firm. Blog information needs to be integrated with predication model.
10. REFERENCES [1] Association of Corporate National Press Publications The publishing industry, Research Institute for Publications 2008 Annual Index, 2-25, 2008. [2] Kenzi Tanaka, Hideaki Miyata, "Bookstore development and product support system in the distribution forecast method book," The Information Society for Artificial Intelligence Research Workshop Species 2, 3-6, February 2008. [3] Geun Chol Moon, Go Kikuta, Takao Terano, “Using Blog information as a leading indicator to estimate book sales in Japan, Direct Marketing Review vol.9 33-48 pages, 2010. There are two assumptions; 1) sales speed of every sales scale is average growth rate of three books 2) 155 days of runway of Blood Type B eliminated from calculation. Table 7 shows the detail calculation of assumption. Colum with highlighted in gray are predication based on sales pattern of three books. Figure 9 is comparison of actual sales pattern and predication. That result may not far from actual sales and applied to real environment to reduce opportunity loss.
[4] Hiroshi Sasaki, Eiji tide, Imada Tomohito “Digital Research Practice Blog “, publisher Akashic records search, Doubunkan publishing, 8-14, 2009. [5] Philip Kotler, Gary Armstrong Translated by Wada Makoto "Principles of Marketing [9] version from theory to practice basic strategy" Diamond, 751-756, 2003. [6] Atsuko Takano, Yasuhiko Kitamura, "buzz focused on the evaluation of causal expressions extracted from the Web site," Journal of Population 24, No. 3, Institute of Intelligent Systems, 322-331, 2009. [7] Takahiro Hoshino, Netjyounoishihyoumeino Biastosnohoseinitsuite," Journal of Artificial Intelligence, Volume 23 No. 6, 791-797, 2008.
6
[8] Manabu Okumura, Yasuhiro Suzuki “Blog page automated monitoring and text mining”, journal of Artificial Intelligence, 101-108, 2007.
[11] G. Mishne and N. Glance., "Predicting movie sales from blogger sentiment", In AAAI Symposium on Computational Analyzing, Spring 2006.
[9] Shingo Hasegawa, Takashi Fujimura, "Blog-Blog Trends in market share by mining existing statistics and indicators related analysis," Information Processing inauguration, 3742, 2007.
[12] Chevalier. Judith A. and Dina Mayzlin.,“The Effect of Word of Month on Sales *online Book Reviews.” Journal of Marketing Research, 43(3), 34-54, 2006.
[10] Narihiko Yoshida, Hisashi Aragaki, Akira Ishii, Takafumi Hayashi, Sanae Umemura "in the hit movie hits Blog analysis of mathematical models of behavior," The Marketing Science Institute Conference on 83th show, 6-2, August 2008.
[13] Daniel Gruhl, R. Guha, Ravi Kumar, Jasmine Novak, Andrew Tomkins., "The predictive power of online chatter", In KDD'05: Proceedings of the eleventh ACM SIGKDD international conference on Knowledge discovery in data mining, 78- 87, 2005.
7