Categorizing Compiler Error Messages with Principal Component Analysis Brett A. Becker∗ and Catherine Mooney Abstract: Being a competent programmer is critical for students in all computing disciplines and software engineering in particular. Novice programming students face a number of challenges and these have been shown to contribute to worrying dropout rates for students majoring in computing, and the growing number of non-majors who are learning to program. Methods of identifying and helping at-risk programming students have been researched for decades. Much of this research focuses on categorizing the errors that novice programmers make, in order to help understand why these errors are made, with the goal of helping them overcome these errors quickly, or avoid them altogether. This paper presents the first known work on categorizing compiler errors using Principal Component Analysis. In this, we find a new way of discovering categories of related errors from data produced by the students in the course of their programming activity. This method may be used to identify where these students are struggling and provide direction in efforts to help them. Keywords: Compiler errors; Compiler error messages; Novice programmers; CS1; Error message categorization; Java programming; Principal component analysis
1
Introduction
Novice programming students face a number of challenges, and difficulties with computer programming in particular have been cited as a contributing factor in worrying dropout rates [1]. Globally one third of students fail their introductory programming course [2, 3], often referred to as CS1 [4]. One source of difficulty is struggling with basic programming concepts themselves – some students may struggle with repetition statements, others with relational operators, etc. Another challenge comes in the form of notoriously cryptic compiler error messages (CEMs), which result from the coding errors made by students in source code [5]. One line of effort to understand these challenges is • Brett A. Becker is with the Beijing Dublin International College, 100 Ping Le Yuan, Chaoyang District, Beijing 100124, China, and School of Computer Science, University College Dublin, Belfield, Dublin 4, Ireland.
[email protected] • Catherine Mooney is with the Physiology and Medical Physics Department, Royal College of Surgeons, 123 St. Stephen’s Green, Dublin 2, Ireland.
[email protected] ∗ To whom correspondence should be addressed. Manuscript received: year-month-day; revised: year-monthday; accepted: year-month-day
categorizing novice errors. Generally these studies fall into two camps, those that categorize errors committed by students in source code (referred to in this paper as simply errors), and those that categorize the compiler error messages (CEMs) resulting from these errors. Often, both camps focus on the most frequent errors as for many languages the majority of students spend the majority of their time on a minority of error types [6, 7]. This paper presents the first known work on categorizing compiler errors using Principal Component Analysis (PCA), a non-parametric method of reducing a complex data set to reveal hidden, simplified dynamics within it. This is accomplished by converting a set of observations of variables (which may be correlated) into a set of values of linearly uncorrelated principal components. These principal components may then reveal relationships between the variables. Using this technique, we attempt to ‘relate’ two or more CEMs. In this way we identify several CEMs which if generated by a student, indicate that the same student has a high likelihood of generating other identifiable errors. In effect this forms categories of (related) errors. We focus on Java errors as Java is the most popular programming language for teaching novices to program [8, 9] and is
Becker et al.: Categorizing Compiler Error Messages with Principal Component Analysis
also the most popular language in general [10]. We feel that approaches such as that presented in this paper are made more necessary as more data-driven metrics appear [11]. This paper is organized as follows. Section 2 presents related work, Section 3 presents our aims, methodology and principal component analysis. Section 4 presents our results and Section 5 presents our conclusions.
2
Related Work
Both student-committed errors and CEMs lend themselves to many types of categorization, for instance: frequency; type (syntax, semantic, logic, runtime, etc.); defined categories (bracketing, repetition, variable declaration / initialization, scope, etc.); nonliteral errors (discussed later); and more. Hristova et al. [12] compiled a list of common Java errors committed by students, combining data from sources including teaching assistants, students and professors from 58 institutions, and members of SIGCSE. This list of 62 errors was reduced to 20 as some were deemed too advanced for their students to encounter, or because the editor they used was capable of identifying the error in a useful enough way (their goal was to enhance CEMs). Of these 20, 13 were syntax errors (such as ‘= versus ==’, ‘&& versus &’, etc.), 6 were logic errors (such as ‘improper casting’), and 1 was a semantic error (‘invoking class method on object’). Nine years later Chan Mow [13] gathered the most common errors generated by her students and categorized them in the same way as Hristova et al. 94.1% of these errors were syntax, 4.7% semantic, and 1.2% logic. One problem that these studies reveal is the lack of a one-to-one mapping between errors and CEMs – that is, a single error may, in different contexts, produce difference CEMs, and the same CEM may be produced by entirely different and distinct errors. As the ultimate goal of these studies is to help students learning to program, not being able to identify an error based on the CEM it generates (or vice versa) complicates the approach, and draws a distinction between research on errors and research on CEMs, despite both approaches normally having a common end goal. Dy and Rodrigo [14] explored ‘non-literal errors’ where the CEM does not match the actual error committed by the student. In doing so they compiled a list of the most common CEMs encountered in their
2
data. ‘Similar’ errors were grouped together, for instance all cannot find symbol errors formed one category, regardless of if the symbol was a variable, method, or class. Unfortunately, such categorization can introduce difficulty when comparing results to those of others. However due to the sheer number of possible CEMs, and the fact that they are not guaranteed to be stable across Java versions [15], such categorization is hard to escape, particularly when a study is done without considering generalization. McCall and Kölling [16] sought to improve this situation by developing and validating error categories. Their results showed that error causes can be manually analyzed by independent researchers with good reliability, and that work (using CEMs only) tended to group some distinct errors together in single categories, which can be listed more accurately. They identified a total of 80 categories which were divided into syntax, semantic, and logic errors. They found that in general, semantic errors showed a greater tendency to correspond to CEMs when compared to syntax errors, showing that categorization scheme can achieve a higher precision in describing these errors. Many studies either categorize errors by frequency [17], or categorize errors (into types, etc.) after being arranged by frequency. Again, this is because educators are most concerned with the most frequent errors, which normally only feature a small subset of possible errors, particularly in the case of novices who generally do not utilize many advanced features of a language and therefore do not encounter errors arising from their use. Categorizing errors by frequency alone can provide insight and direct efforts to aid students, but also opens questions. In [18] Jadud noted that the distributions of the most frequent errors across six languages including COBOL, Fortran, Haskell, Java, LOGO and SOLO are very common given the diversity of these languages. Of these, Haskell stood out most, with 50% of all errors encountered being one type. Jadud felt that a refinement of type error (the most frequent) would bring the distribution more into line with the other languages. In [6], we showed that the distributions of the ten most frequent CEMs from six different studies all focusing on Java had very similar distributions. This similarity is despite the fact that some of these studies categorized some errors together before ranking them by frequency, while others did not. In fact, four of the top five errors were common to all six studies, subject to minor
Becker et al.: Categorizing Compiler Error Messages with Principal Component Analysis
differences due to using different Java versions, or study-specific groupings such as some grouping all cannot find symbol CEMs together, and others reporting cannot find symbol (variable/method/class) separately. Recent work by Pritchard [19] examined the link between errors (in this case CEMs) and statistical distributions. A good fit was found between Python and Java error frequency distributions and Zipf-Mandelbrot distributions. This work gives one possible way to contrast languages or compilers quantitatively and holds promise for future research. Also recently, the Blackbox dataset [15] has begun storing large-scale naturally accumulating process data (NAPD). This data is available to researchers and holds significant potential to explore the behavior of programmers including categorization of errors. Altadmri and Brown [20] used a year of this data involving 250,000 users to investigate 18 errors from their previous work [21], ultimately derived from [12]. The results are intended to inform tools to target the most frequent (or hardest to fix) errors. Jadud and Dorn [22] used this data to explore repeated errors at a largescale applying Jadud’s error quotient [18]. Providing novel insight, but complication in using such large-scale data for such purposes, their results show quantifiable and statistically significant country-specific differences. They conclude that external, objective measures of student performance, either integrated at the time of learning or applied post-hoc, hold promise to radically transform our understanding of novice programming behavior at both small and large scales. Rounding out recent developments, Ahadi et al. [23] explored analyzing NAPD with machine learning methods to identify high- and low-performing students. Although not focused on categorizing errors, this approach holds promise for potential use in categorization, which would provide another avenue to detecting at-risk students. Further, such advanced techniques are most likely required for the analysis of the large-scale NAPD data that is now available. The current state of play is summarized by McCall and Kölling’s conclusion: ‘There still is no real agreement about the most common problems students encounter’ [16] and by Brown and Altadmri [21] who found that educators only have a weak consensus about the frequency of student errors. Nonetheless the availability of NAPD and tools to analyze such large scale data hold promise, but currently the complications of such large
3
data sets make smaller more controlled studies still very relevant.
3 Categorizing Errors Component Analysis
Using
Principal
3.1 Aims In this work we seek to categorize CEMs, by relating them to each other by analyzing how users encounter them. In other words, we would consider two CEMs to be related if it can be shown that if a student commits an error generating a particular CEM, that student has a high likelihood of also committing an error generating a different CEM. For instance, if a particular student frequently forgot closing braces, we would reasonably expect that student to generate some number of reached end of file while parsing CEMs as omitting a closing } at the end of the final class in a file will generate this CEM. However we might also expect a relatively large number of ‘else’ without ‘if’ CEMs, as this can result from omitting a closing brace at the end of an if statement which is followed by an else. In this hypothetical case it is fairly easy to predict that this student will most likely have higher than expected frequencies of both of these CEMs, thus relating them. However, would it be possible to analyze the behavior of a large group of students in a way that may reveal hidden (or at least not obvious) relations between two or more errors? In other words is it possible to say that finding a high frequency of error x is an indication of a high frequency of error y, or conversely a low frequency of error z? The ultimate goal of establishing these error categories is to help students overcome these errors quickly, or avoid them altogether. 3.2 Methodology In this study we analyze the compilation behavior of over 100 students who undertook a CS1 course learning Java as part of a BSc in Information Technology as described in [5]. Students used a custom editor that had the capability of enhancing CEMs, although this feature was disabled for this group. Student data was logged during normal activity (working on assignments, labs, etc. as well as any other programming, such as individual practice, following along in lecture, etc.) and no skeleton code or other structures were provided. The data was filtered to remove students with very low levels of activity, as there was not necessarily a one-to-one
Becker et al.: Categorizing Compiler Error Messages with Principal Component Analysis
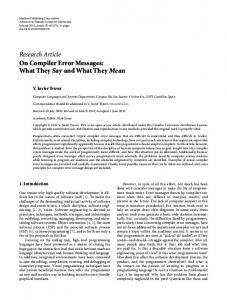
mapping between anonymous compiler IDs and actual students, as described in [5]. Data was logged for six weeks, resulting in 39,127 errors, across 76 unique CEMs. This group was typical in that the most frequent errors accounted for the vast majority of errors: the 15 most frequent errors accounted for 85.3% of all errors, with the 15th accounting for only 1.7% of all errors in isolation. Figure 1 shows the number of errors per CEM for the 15 most frequent CEMs.
4
between any two arrows represents the correlation between those CEMs (90% is linearly uncorrelated). Thus, for example we could say that the correlation between CEMs 20 and 12 for PCs 1 and 2 is minimal.
Figure 2. PC2 vs PC1 (