Content Repurposing
Categorizing Images in Web Documents Jianying Hu IBM T.J. Watson Research Center Amit Bagga Avaya Labs Research
The Web provides an increasingly powerful and popular publication mechanism. Web documents often contain a large number of images that serve various purposes. Identifying the functional categories of these images is an important task in Web repurposing. This article describes a study on the functional categorization of Web images using data collected from news Web sites.
22
A
s an online publishing mechanism, the Web has become increasingly oriented to multimedia content. Many Web documents contain a number of images, and these images tend to be heterogeneous. For example, a news Web page might contain images corresponding to specific news stories, icons representing forecasts, and images containing mostly text to serve as section headings. Automatically identifying the functional image categories could be useful for many Web-based information-processing tasks, including information extraction, Web mining, Web page summarization, and mobile access. Web page analysis for repurposing content for wireless devices has become an active research area.1-4 Functionality-based categorization of images in this case can help in setting priorities for transmission to devices that have limited bandwidth. While there has been some research of this kind on Web image analysis, the research has largely focused on two particular areas. One is the extraction and recognition of text contained in Web images.5,6 The other is image search and retrieval on the Web.7-10 However, no research has systematically focused on functionality-based image categorization. While some projects have focused on the statistics of images containing text on the Web,11 no statistics have been collected on the distributions of other image categories. This article addresses this issue. A major difference between this work and past work on the subject
1070-986X/04/$20.00 © 2004 IEEE
is that past work has been focused on the content—that is, on what the image is about. In contrast, the issue that is more relevant for Web repurposing is how to categorize an image on the basis of how it is used. For our initial study, we use data collected from news Web sites because they generally involve the most diverse set of images and thus pose the greatest challenge for automatic categorization. In addition to describing the image categories found in such Web pages and identifying the main research issues involved in automatic categorization, we present a case study that discusses an automatic-identification algorithm that makes use of visual image features and information contained in the surrounding text to separate images from other categories.
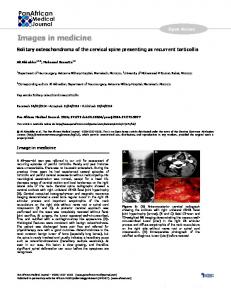
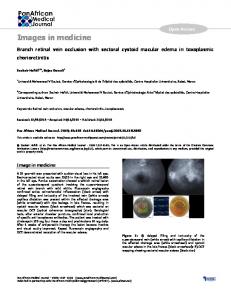
Image categories We collected the data we used in this study from a selection of front pages that correspond to 25 randomly selected news Web sites, as listed in Table 1. Because there has been no previous comprehensive study on identifying and classifying images found on news Web pages, we had to define both the categories and their descriptions. Our analysis yielded seven functional categories for the images. Each category is described in detail below with examples shown in Figures 1 and 2. Figure 1 shows the sample images while Figure 2 displays the images in their respective surrounding contexts, which are important in determining their categories. The story images category contains images whose content is associated with a story that appears on the page. The story associated with the image need not necessarily be present in its entirety on the page. The most common examples of such images are those associated with the top news stories of the day. Figure 2a contains an example image that is associated with the story on a game in the last soccer world cup: “Senegal Stuns France.” The preview images are those whose content is associated with a preview of a story. In other words, the text associated with the image refers to an actual story appearing elsewhere in the news site. For example, Figure 2b contains an image that previews an upcoming movie. The text corresponding to the image shown in Figure 2b is “Summer movie preview: Get a sneak peek at this season’s hot flicks.” Commercial images act as advertisements.
Published by the IEEE Computer Society
Authorized licensed use limited to: KnowledgeGate from IBM Market Insights. Downloaded on December 11, 2008 at 16:47 from IEEE Xplore. Restrictions apply.
Table 1. List of Web sites used for our sampling. Description Arizona Home Page BBC BBC News BBC Sport Boston Globe Boston Home Page Chicago Tribune CNN CNN Sport CNN Money Canada Home Page Canoe Home Page Dallas Morning News
URL http://www.azcentral.com http://www.bbc.co.uk http://news.bbc.co.uk http://news.bbc.co.uk/sport http://www.boston.com/globe http://www.boston.com http://www.chicagotribune.com http://www.cnn.com http://sportsillustrated.cnn.com http://money.cnn.com http://canada.com/national http://canoe.ca http://www.dallasnews.com
Figure 1c shows an example of such an image. As Figure 2c shows, commercial images are often inserted randomly among unrelated text items. Meanwhile, host images are images of hosts of regular columns or programs. These images are often used to represent the column or program on the front page—for example, Larry King’s image that represents his show at the CNN Web site. An example is shown in Figure 1d. Heading images usually contain text and serve as headings for columns and sections. Figure 2e contains an example of such an image. The images that are icons and logos consist of those that represent specific concepts, such as company logos or other commonly used icons such as the image of the sun used to represent a sunny weather forecast. An example is shown in Figure 1f. Finally, formatting images are used for formatting purposes. Some examples include horizontal and vertical lines on a Web page. The 25 news front pages contained a total of 899 images. We manually annotated these images according to the categories. Table 2 (next page) shows the distribution of the images per category. Because our classification categories are functional, the analysis yielded some unexpected results. In particular, three of the numbers in Table 2 stand out: 32.6 percent for icons and logos, 22.0 percent for headings, and 12.2 percent for commercials. First, the number of commercials is lower than expected, especially when compared to the number of headings and icons/logos. In addition, while the numbers for the story and preview categories fit with our expectations, the number for the formatting category is higher than expected.
Description Denver Post Detroit Free Press Economist Guardian Unlimited Houston Chronicle LA Times Miami Home Page New York Times SF Chronicle Sun Spot Telegraph USA Today
URL http://www.denverpost.com http://www.freep.com http://www.economist.com http://www.guardian.co.uk http://www.chron.com http://www.latimes.com http://www.miami.com http://www.nytimes.com http://www.sfgate.com/chronicle http://www.sunspot.net http://www.telegraph.co.uk http://usatoday.com
(b)
(c)
(d)
(e)
(a)
(f) Figure 1. Examples of images found on the Web: (a) story, (b) preview, (c) host, (d) commercial, (e) heading, and (f) icon logo.
(d) (a) (e)
(b)
(c)
(f)
Figure 2. Examples of images found on the Web within their contexts: (a) story, (b) preview, (c) commercial, (d) host, (e) heading, (f) icon logo.
23 Authorized licensed use limited to: KnowledgeGate from IBM Market Insights. Downloaded on December 11, 2008 at 16:47 from IEEE Xplore. Restrictions apply.
Table 2. Distribution of the 899 images from the 25 Web sites listed in Table 1. Category Story (S) Preview (P) Host (A) Commercial (C) Icons and Logos (I) Headings (H) Formatting (F)
(a)
Number of Images 91 16 9 110 293 198 182
Percent 10.1 1.8 1.0 12.2 32.6 22.0 20.3
(b)
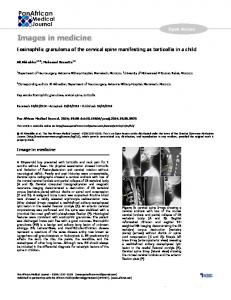
Figure 3. Sample Web images: (a) an image that can only be correctly classified as commercial through text analysis and (b) an image where the associated text is uninformative and image-based analysis is needed to achieve correct categorization.
The large number of images in the icons/logos, headings, and formatting categories is likely to be a reflection of the serious efforts of Web content providers to maintain the unique style and appearance of their Web front pages.
Automatic functionality-based categorization
IEEE MultiMedia
Images contained in Web publications fall into a diverse set of functional categories. As each category has a different functional role, each demands a different treatment in various Web document analysis tasks. For example, to summarize and reformat a Web page for display on a small PDA screen, story and preview images should have the highest priority for transmission, either as is or as down-sampled images. On the other hand, commercial images should have the lowest priority for transmission. For icons/logos and headings, it might be desirable to recognize
their content through image recognition for the icon/logo category and optical character recognition (OCR) for the heading category so that they can be replaced by text labels. This saves both bandwidth and screen space. The task of automatic classification of images into these categories ranges from straightforward to highly challenging, depending on the category. The formatting category can conceivably be identified with high accuracy using simple image features such as uniformity, size, and aspect ratio. Many banner ads also have a distinct aspect ratio. However, the accurate classification into the rest of the categories is much more challenging and requires a combination of sophisticated image understanding and text-analysis techniques. Figure 3 shows two examples that demonstrate such challenges. The image in Figure 3a is a photograph that could well pass as a story image. However, the surrounding text reveals that it is actually an advertisement. Figure 3b shows the reverse situation: Here the surrounding text is uninformative. Only by identifying the image as a graphics image containing mainly text, and further recognizing the text, can the image be correctly classified as a heading image. We have identified three important research areas for functional image categorization: the classification of images into broad categories (such as photos and graphics), the classification of the surrounding text, and the extraction and recognition of text from images. In the following sections, we analyze these three research areas as components of functional image categorization. Image classification The image characteristic that stands out most at the first glance of a Web page is whether an image is photographic or graphic. This feature has strong correlation with the functional categories. For example, an image in categories S and P is more likely to be photographic, while the other categories tend to contain more graphic images. We consider text images a subset of graphic images. The first question you might ask is whether the image format could be used for this classification. The two most common formats used for images in Web documents are GIF and JPEG. GIF is a lossless format more suitable for graphics. JPEG, developed by the Joint Photographic Experts Group, is a lossy compression scheme more suitable for photographic images. However, despite this distinction, the conven-
24 Authorized licensed use limited to: KnowledgeGate from IBM Market Insights. Downloaded on December 11, 2008 at 16:47 from IEEE Xplore. Restrictions apply.
Classifying the surrounding text Web images are almost always accompanied by text and such text often contains useful information about the images’ nature and content. Much research has attempted to discover the associated text for image searching and indexing
on the Web. For that particular task, the most relevant text fields are image file names, image captions, and alternate text defined by the tag in HTML. The functional classification of images is a different problem requiring a different set of features as well as techniques. Because the goal is not to search for a particular image, but rather to classify any given image into one of several broad functional categories, the text fields mentioned above are too specific. Instead, as we can see in Figure 2, an image’s surrounding text plays a much more important role in identifying the image’s functionality. For the same reason, text classification and categorization techniques are more relevant in this case than IR techniques. In particular, text classification will help distinguish between the S, P, and C categories, because images in these categories are often closely associated with their textual context. While a large amount of research exists in text and story classification, the problem of classifying image functionality on the basis of textual context hasn’t been thoroughly studied. In addition, although there has been work done on classification of text corresponding to stories versus text corresponding to commercials, the work was done on broadcast news data and the technique used was tied into the nuances of such a data source. Extraction and recognition of text For images containing mainly text, it’s often desirable to extract and recognize such text. For example, in some cases the only way to distinguish a heading image from a commercial is by analyzing the extracted and recognized text from the image. Furthermore, once the text content of a heading is identified, it can be transmitted in place of the original image to achieve higher efficiency in both bandwidth and screen space, or used to generate a text summary of the page. The extraction and recognition of text from Web images is a difficult task because of the high complexity involved in both the background and the foreground in text regions and the relative low resolution compared to scanned images. While many interesting algorithms have been developed, text extraction and recognition remains a very challenging research area. A related research area is the extraction and recognition of text from video scenes. While the research in this area has been largely motivated by information-retrieval needs until this point, this technology is also important for content-repurposing applications.
January–March 2004
tion of using GIF for graphics and JPEG for photographic images isn’t always followed. In the database described in the previous sections, 14 of the 91 images in category S are photographic images in GIF format, while 13 of the 127 JPEG images are graphic images. Other researchers have also observed similar mixtures of image classes within each single format.7 Thus, we can’t use image format as the primary indication of photographic or graphic image types. It should only be used as secondary evidence to resolve ambiguities after image-based classification. Much of previous research on image-based classification in the document-analysis community has focused on the classification of text versus nontext regions within an image,12-14 predominantly using frequency domain analysis of image intensity. While this is clearly related to the classification of photographic versus graphic images, there are some important distinctions. On the one hand, the common characteristics used by previous algorithms to identify text regions do not necessarily hold in the broader category of graphic images. On the other hand, a photographic image might very well contain text as part of the scene. Another community that has applied frequency domain analysis to photographic versus graphic image classification is the computer graphics community. In this community, researchers have explored the statistical nature of natural images for the purpose of making computer-generated images look more natural. Some of the findings in this community will likely be applicable to the classification problem here. Because most images on the Web are color images, it’s natural to explore the color characteristics of different classes of images. Besides photographic and graphic categories, there are also finer image categories that are relevant to functional classification, and whose identification presents challenges. Examples include text images that occur most often as headings or ads, face images that are often used as logos to represent regular columns or shows, and symbolic images such as images representing rainy or partially cloudy weather.
25 Authorized licensed use limited to: KnowledgeGate from IBM Market Insights. Downloaded on December 11, 2008 at 16:47 from IEEE Xplore. Restrictions apply.
Identifying story and preview images A quick study of the image categories reveals that the seven categories identified above can be grouped into two superclasses. The first superclass, called SPA, includes categories S (Story), P (Preview), and A (Host). The second category, called CIHF, contains the rest of the categories: C (Commercial), I (Icons and Logos), H (Heading), and F (Formatting). The first superclass is more likely to contain photographic images of regular aspect ratios, and they are often associated with some story. On the other hand, images in the second superclass are more likely to be graphic, have irregular aspect ratios, and often aren’t associated with a story. On the basis of these observations, we designed our classification procedure as follows. First, we apply a simple size-screening process to remove very small images and images of irregular aspect ratios. To be more specific, what we are doing is prefiltering with the size aspect ratio. Almost always, the filtered images are those that belong in the CIHF class. Our experiments showed that this simple procedure reduces the total number of images to be considered by about half without removing any images from the desired SPA class. For the remaining images, the main classifier to separate the SPA and CIHF classes is built using both image features and features extracted from the associated text. Then we use a secondary classifier using only text features to separate out host images from the SPA class. The remaining images are considered story and preview images.
IEEE MultiMedia
Separating photographic and graphic images Features from the frequency domain and the color domain have been proposed separately in previous research for problems related to the separation of photographic and graphic images. After investigating these previous approaches, it became clear to us that the two domains are complementary to each other and a combination of the two would likely lead to improved performance. We thus designed a new algorithm to incorporate features from both the frequency and color domains. Frequency domain features. Many of the characteristics separating photographic and graphic images are reflected in spatial features of image intensity. For example, graphic images tend to have many sharp edges whereas photographic images usually have less well-defined
regions and exhibit a smoother transition between regions. To exploit such characteristics, we derive features from the Discrete Cosine Transform coefficients of 8 × 8 subregions (blocks) of an image. Such features have been used successfully before for text versus nontext image classification. The main innovation in our algorithm is that we introduce a clustering procedure because the images we’re trying to identify— namely generic graphic images of various types— are much less uniform compared to text images. The 8 × 8 DCT results in 64 coefficients. A subset of these are selected using a discriminative analysis carried out on data extracted and handlabeled from a set of training images. First, we take the absolute values of the coefficients. We refer to these values as absolute coefficients hereafter. We then normalize the values corresponding to each absolute coefficient by the standard deviation. To estimate the class discriminative power of each coefficient, we compute the within-class and between-class variances. Suppose there are a total of np photographic image blocks and ng graphic image blocks in the training set. Let P = {p1, p2, ... , pnp} and G = {g1, g2, ... , gng} represent the indices of photographic and graphics image blocks, respectively. Let αk refer to the absolute value of the kth DCT coefficient. Let (αk)P and (αk)g represent the means of αk over set P and G, respectively. We define the within-class variance as
We define the between-class variance as
We measure the discriminative power of the kth coefficient by δk =
τk σk
We then select the top M < N coefficients with largest δk as the DCT features. While DCT features similar to that described
26 Authorized licensed use limited to: KnowledgeGate from IBM Market Insights. Downloaded on December 11, 2008 at 16:47 from IEEE Xplore. Restrictions apply.
above were used directly with success in past efforts to classify an image block as text or nontext, our experiments showed that such a strategy doesn’t work well for photographic and graphic image classification. This is because both categories contain a large range of different image blocks. For example, while graphic images tend to contain sharper edges, they often contain uniform blocks as well. On the other hand, photographic images sometimes contain regions of high-frequency variation such as scene text and fences, as well as the more typical smooth-transition areas. To accommodate the large variation within each class, we apply unsupervised clustering on the training image blocks using the M-selected DCT coefficients. To be specific, we used the Kmeans clustering algorithm to group the training image blocks into a predetermined number of K clusters.15 We then label each training image block by its cluster index. Finally, we compute a normalized cluster histogram for each image, yielding a K-dimensional feature. We choose parameters M and K empirically. In our case study, we settled on M = 18 and K = 15. For classification, we assigned each image block to the cluster with the nearest cluster center and we computed the same Kdimensional cluster histogram as the feature representing the whole image.
higher values because they tend to contain purer colors.
tend to contain purer colors. We chose T = 50. In the most common colors feature, we find the N most common colors in the images, given a predetermined number N. Then we define the feature simply as the fraction of pixels in the images that have one of those colors. This feature again has a range of 0,1 and is a rough measure of the degree of color concentration. Again, graphic images tend to get higher values because they’re often dominated by a few colors. We chose N = 10 in our experiments. Combining frequency and color features. There are two possible ways to combine the 18 frequency domain features and two color features we described. The most straightforward approach is to concatenate the two features directly, which would yield a 20-dimensional feature vector. Our experiments indicated that this approach, not surprisingly, doesn’t perform well. The large number of DCT features overwhelmed the color features and the technique didn’t improve the overall performance. The second strategy, which we adopted, is to use a two-stage approach. First, a frequency domain classifier is trained using the 18 DCT features. This classifier gives a classification score for each image that reflects how likely the image is graphic. We then use this single score as the frequency domain feature, which is concatenated with the two color features to form a threedimensional image feature. We then train the photographic-graphic image classifier using these three features. Text features Extracting the text surrounding an image introduces several challenges. Ideally, we could use spatial proximity to judge what text is near a particular image. Unfortunately, while tools for querying spatial information of nodes in an HTML Document Object Model (DOM) tree are being developed, they’re not yet widely available. To sidestep this problem, we used an approxima-
January–March 2004
Color features. Earlier research has proposed eight color-related features to distinguish graphic and photographic images. A study of those features revealed that many of them are various heuristic ways of implementing aspects of the frequency-domain characteristics that are better captured by the frequency-domain features described previously. We selected two of the color features that are completely independent from the frequency domain features and therefore add the most discriminative power. The two features are the band-different and the mostcommon colors features. For the band-different feature, we select a threshold T between 0 and 255 and initialize a counter C to 0. For each pixel in the image, if the difference between the largest and the smallest RGB components is greater than T, then we increase the counter C by one. After we have examined all pixels in the images, the band difference feature is calculated as C/S where S is the total number of pixels in the images. This feature has a range of 0,1 and is a rough measure of the degree of saturation in the image. Graphic images tend to get higher values because they
Graphic images tend to get
27 Authorized licensed use limited to: KnowledgeGate from IBM Market Insights. Downloaded on December 11, 2008 at 16:47 from IEEE Xplore. Restrictions apply.
❚
In Larry King Live, 66.67 percent of the words belong to the name Larry King.
tion in our experiments. For each image, we extracted text nodes in the neighborhood of the image node in the DOM tree within a maximum of two levels. We extracted a maximum of 20 words for “before text” (from text nodes to the left of the image node) and “after text” (from text nodes to the right of the image node). We preserve structural features, such as whether each node is a hyperlink, during extraction. For each image, the classifier analyzes the set of extracted text nodes from the neighborhood of the image. The following feature values are computed over the set of text nodes:
Combining image and text features We use the classification score from the graphic-photographic classifier described above as the final image feature. We then concatenate this feature with the five text features previously described to form a six-dimensional feature vector for each image. We then train a classifier for the two super classes SPA and CIHF using these six features.
❚ Nondictionary word count computes the num-
Host image identification Once we identify the SPA superclass, we use a secondary rule-based classifier to separate out the host images. We then classify the remaining images in the SPA superclass as story and preview images. For each text node corresponding to an image, we identify the proper names in the node (if any) and then compute the percentage of the words in the node that belong to the proper names. For example, in Larry King Live, 66.67 percent of the words belong to the name Larry King. Once this computation is performed for all text nodes corresponding to an image, we take the maximum value. If the maximum value is greater than 50 percent, then we proceed to the second rule. Otherwise, we determine that the image isn’t a host image. For the text node that contains the maximum percentage value, we check if the node is also a hyperlink. If so, then we identify the current image as a host. Otherwise, it is not. We wanted to reduce the number of false positives for the host class as each such instance directly reduces the recall of the story and preview class. For the Web filtering application we targeted, high recall of the story and preview class is more important than high precision, because missing an important image is a more serious error than having to transmit a small number of extra images.
ber of words in the text nodes that don’t belong to a dictionary. It complements the caps count feature and also tends to have higher values for images in the SPA superclass because most proper names aren’t found in dictionaries. The dictionary used is WordNet, an online lexical database developed at Princeton University.
Experiments The data collected from the 25 Web sites shown in Table 2 consists of 899 images. To increase the training and testing sets, we collected and labeled a second set of front pages from the same sites but from different dates. We subjected the resulting set of 1,859 images to the
❚
Hyperlink count is simply a count of the number of nodes that are hyperlinks. Images in class H are likely to have larger values for this feature as compared to images in the SPA superclass.
❚ Number count is a count of the number of all
numeric words in the nodes. Images in class C are likely to have larger values for this feature. ❚ Caps count is a count of the number of capital-
ized words present in the text nodes. If the first word of a node is capitalized, then it isn’t included in the count as we assume that it’s the beginning of a sentence. Images in the SPA superclass are likely to have higher values for this feature because their contexts usually contain proper names.
IEEE MultiMedia
Maximum word count computes the maximum number of words in any of the text nodes. Because SPA superclass images are likely to be accompanied by descriptions, the value of this feature for the superclass will likely be high.
28 Authorized licensed use limited to: KnowledgeGate from IBM Market Insights. Downloaded on December 11, 2008 at 16:47 from IEEE Xplore. Restrictions apply.
Table 3. Distribution of the images after the initial size screening. Category Story (S) Preview (P) Host (A) Commercial (C) Icons and Logos (I) Headings (H) Formatting (F) Total
Number of Images 169 45 26 71 136 13 2 462
Percent 36.6 9.7 5.6 15.4 29.4 2.8 0.4 100
ical choice. Finally, after host image removal, we had a 95.3 percent recall and an 82.6 percent precision for the story and preview class. With the very simple rules for host detection, we were able to achieve a rather high level of recall at an acceptable level of precision. The lower precision is largely due to the fact that many host images were left unidentified and points to the need for more sophisticated algorithms for host-image detection.
Conclusions As the popularity of the Web soars, the content on the Web is increasingly accessed from wireless devices that have small screens and different bandwidths. Because many Web documents contain a large number of images serving different purposes, how to identify the function of each image so that it can be handled accordingly is an important issue in Web content repurposing. Much work remains to be done in functionbased image classification of all images. For example, we plan to investigate algorithms to classify images in the heading category so an OCR system could be used to extract the text content. We also plan to explore image-recognition techniques to interpret images more effectively in the icon/logo category. Icons that appear regularly on Web sites (for example, newspaper logos) could be classified by analyzing different editions of the pages for repetitions. For the host class, a combination of detecting repetitive images and face recognition should help significantly. MM
January–March 2004
simple size screening test with a threshold aspect ratio of 2.5. After the size screening, the resulting set consisted of 462 images. Table 3 shows the distribution of the images in this set. We then divided the set of 462 images into five roughly equal parts containing an approximately equal number of graphic and photo images. We used four of these parts for training and one for testing, employing the five-fold validation method. In other words, we ran the experiments five times where, in each run, we designated one of the five parts as a test set with the remaining four acting as training sets. We rotated the process and pooled the five-part results together to arrive at the overall accuracy of the classification algorithm. For the trainable classifiers in the system, we chose to use the Support Vector Machines (SVM) because they’re one of the top performing classifiers for text categorization tasks.16 We tested the effectiveness of the image features in separating graphic images and photographic images. We experimented with both the linear and the Radial Basis Function (RBF) kernels for the SVMs. Our results indicated that the RBF kernels performed better than the linear kernel for both the intermediate frequency domain classifier and the final image classifier. The accuracy we achieved using different sets of features was 91.1 percent for the frequency domain, 89.4 percent for the color set, and 92.5 for the combined set. The combination of the frequency domain features and color features lead to better results than when either feature group is used alone. For the task of identifying Story and Preview images, we adopted the standard performance measures used in information retrieval—namely recall and precision. To be more specific, given a target class T, recall measures what percentage of instances of T are detected by the system, and precision measures what percentage of images identified by the system as belonging to class T are indeed instances of T. As mentioned before, for the purpose of filtering for important images, we have tuned the system to favor high recall over high precision. In terms of the SVM classifiers, we found from our experiments that the linear kernel performed better in this case. For the intermediate task of SPA superclass identification, we had a 90.5 percent precision measure and 95.4 percent recall measure. We were able to achieve high performance for both recall and precision, which indicates that the division of the SPA and CIHF superclasses is a log-
References 1. T. Bickmore, A. Girgensohn, and J. Sullivan, “Web Page Filtering and Re-authoring for Mobile Users,” The Computer J., vol. 42, no. 6, 1999, pp. 334-346. 2. O. Buyukkokten, H. Garcia-Molina, and A. Paepcke,
29 Authorized licensed use limited to: KnowledgeGate from IBM Market Insights. Downloaded on December 11, 2008 at 16:47 from IEEE Xplore. Restrictions apply.
3.
4.
5.
6.
7.
8.
9.
10.
11.
13. J. Li and R. Gray, “Text and Picture Segmentation by the Distribution Analysis of Wavelet Coefficients,” Proc. of The 1998 Int’l Conf. on Image Processing, Oct. 1998, pp. 566-570. 14. K. Perlmutter et al., “Text Segmentation in MixedMode Images Using Classification Trees and Transform Tree-Structured Vector Quantization,” Proc. IEEE Int’l Conf. Acoustics, Speech and Signal Processing, IEEE CS Press, vol. 4, 1996, pp. 22312234. 15. A. Jain and R. Dubes, Algorithms for Clustering Data, Prentice Hall, 1988. 16. T. Joachims, “Making Large-Scale SVM Learning Practical,” Advances in Kernel Methods: Support Vector Learning, B. Schlkopf, C. Burges, and A. Smola, eds., MIT Press, 1999.
Jianying Hu is a research staff member of the IBM T.J. Watson Research Center. Her research interests include Web document analysis, image and video analysis, document understanding, handwriting recognition, pen computing, and multimedia indexing, summarization, and retrieval. Hu received a PhD in computer science from SUNY Stony Brook. She is a senior member of the IEEE and a member of ACM.
Amit Bagga is a research scientist at Avaya Labs Research, the research division of Avaya Inc. His research interests include retrieval, extraction, and summarization of information from text. Bagga received a PhD in computer science from Duke University. Contact Jianying Hu at
[email protected] and Amit Bagga at
[email protected]. For further information on this or any other computing topic, please visit our Digital Library at http://computer. org/publications/dlib.
IEEE MultiMedia
12.
“Seeing the Whole in Parts: Text Summarization for Web Browsing on Handheld Devices,” Proc. of the Tenth Int’l World Wide Web Conf., ACM Press, May 2001. N. Milic-Frayling and R. Sommerer, “Smartview: Flexible Viewing of Web Page Contents,” Poster Collection of The Eleventh Int’l World Wide Web Conf., ACM Press, May 2002; http://www2002.org/CDROM/poster/172. G. Penn et al., “Flexible Web Document Analysis for Delivery to Narrow-Bandwidth Devices,” Proc. Sixth Int’l Conf. Document Analysis and Recognition, IEEE CS Press, Sept. 2001, pp. 1074-1078. A. Antonacopoulos and D. Karatzas, “An Anthropocentric Approach to Text Extraction from www Images,” Proc. Fourth IAPR Workshop on Document Analysis Systems, ACM Press, Dec. 2000, pp. 515-526. D. Lopresti and J. Zhou, “Locating and Recognizing Text,” Information Retrieval, vol. 2, 2000, pp. 177-206. C. Frankel, M. Swain, and V. Athitsos, Webseer: An Image Search Engine for the World Wide Web, Univ. of Chicago Technical Report TR96-14, 1996. E. Munson and Y. Tsymbalenko, “To Search for Images on the Web, Look at the Text, Then Look at the Images,” Proc. First Int’l Workshop on Web Document Analysis, University of Liverpool, Liverpool, England, Sept. 2001; http://http://www.csc.liv.ac.uk/ wda2001. S. Paek and J. Smith, “Detecting Image Purpose in World-wide Web Documents,” Proc. SPIE Symp. Electronic Imaging—Document Recognition, SPIE, Bellingham, Washington, Jan. 1998. J. Yang, Q. Li, and Y. Zhuang, “Octopus: Aggressive Search of Multi-modality Data Using Multifaceted Knowledge Base,” Proc. Eleventh Int’l World Wide Web Conf., ACM Press, May 2002. T. Kanungo and C. Lee, “What Fraction of Images on the Web Contain Text?” Proc. First Int’l Workshop on Web Document Analysis, University of Liverpool, Liverpool, England, Sept. 2001, pp. 43-46; http://http://www.csc.liv.ac.uk/ wda2001. I. Keslassy et al., “Classification of Compound Images Based on Transform Coefficient Likelihood,” Proc. 2001 Int’l Conf. Image Processing, Oct. 2001.
30 Authorized licensed use limited to: KnowledgeGate from IBM Market Insights. Downloaded on December 11, 2008 at 16:47 from IEEE Xplore. Restrictions apply.