Published December 8, 2014
Cattle selected for lower residual feed intake have reduced daily methane production1,2 R. S. Hegarty,*3 J. P. Goopy,†4 R. M. Herd,* and B. McCorkell‡ *New South Wales Department of Primary Industries, Beef Industry Centre, Armidale, New South Wales 2351, Australia; †University of New England, Armidale, New South Wales 2351, Australia; and ‡Tamworth Agricultural Institute, Tamworth, New South Wales 2340, Australia
ABSTRACT: Seventy-six Angus steers chosen from breeding lines divergently selected for residual feed intake (RFI) were studied to quantify the relationship between RFI and the daily rate of methane production (MPR). A 70-d feeding test using a barley-based ration was conducted in which the voluntary DMI, feeding characteristics, and BW of steers were monitored. The estimated breeding value (EBV) for RFI (RFIEBV) for each steer had been calculated from 70-d RFI tests conducted on its parents. Methane production rate (g/ d) was measured on each steer using SF6 as a tracer gas in a series of 10-d measurement periods. Daily DMI of steers was lower during the methane measurement period than when methane was not being measured (11.18 vs. 11.88 kg; P = 0.001). A significant relationship existed between MPR and RFI when RFI (RFI15d) was estimated over the 15 d when steers were harnessed for methane collection (MPR = 13.3 × RFI15d + 179; r2 = 0.12; P = 0.01). Animals expressing lower RFI had lower daily MPR. The relationship established between MPR
and RFI15d was used to calculate a reduction in daily methane emission of 13.38 g accompanied a 1 kg/d reduction in RFIEBV in cattle consuming ad libitum a diet of 12.1 MJ of ME/kg. The magnitude of this emission reduction was between that predicted on the basis of intake reduction alone (18 gⴢd−1ⴢkg of DMI−1) and that predicted by a model incorporating steer midtest BW and level of intake relative to maintenance (5 gⴢd−1ⴢkg of DMI−1). Comparison of data from steers exhibiting the greatest (n = 10) and lowest (n = 10) RFI15d showed the low RFI15d group to not only have lower MPR (P = 0.017) but also reduced methane cost of growth (by 41.2 g of CH4/kg of ADG; P = 0.09). Although the opportunity to abate livestock MPR by selection against RFI seems great, RFI explained only a small proportion of the observed variation in MPR. A genotype × nutrition interaction can be anticipated, and the MPR:RFIEBV relationship will need to be defined over a range of diet types to account for this.
Key words: beef cattle, feed conversion efficiency, genetics, methane production ©2007 American Society of Animal Science. All rights reserved.
INTRODUCTION Methane from enteric fermentation in ruminant livestock contributes approximately 12% of anthropogenic greenhouse gas emissions globally (Crutzen et al.,
1
This work was funded by the New South Wales Department of Primary Industries. 2 The assistance provided by R. Woodgate, S. McClelland, J. Brunner, W. Johns, and S. Sinclair of NSW Department of Primary Industries, as well as R. Geddes of the University of New England, and M. Wolcott of the Cooperative Research Centre for Cattle and Beef Quality is acknowledged. 3 Corresponding author:
[email protected] 4 J. P. Goopy was supported by a postgraduate scholarship funded by Meat and Livestock Australia. Received April 12, 2006. Accepted February 9, 2007.
J. Anim. Sci. 2007. 85:1479–1486 doi:10.2527/jas.2006-236
1986), and there are few practical strategies to reduce daily emissions from grazing animals without compromising their productivity. Methane production is dependent upon the quantity of feed consumed, although this effect is moderated by feed digestibility and other feed and animal characteristics (Blaxter and Clapperton, 1965; Pelchen and Peters, 1998). After discovery of variation among cattle in feed intake required for the same level of production (Koch et al., 1963), efficiency research progressed to define the trait of residual (or net) feed intake (RFI) as the difference between actual feed intake and the expected feed requirements for maintenance of BW and some measure of production (such as growth in beef cattle or milk production in dairy cattle; Arthur et al., 2001b). LowRFI beef cattle eat less than expected for their BW and ADG. Residual feed intake has been shown to be moderately heritable (Arthur et al., 2001b; Robinson
1479
1480
Hegarty et al.
and Oddy, 2004; Schenkel et al., 2004), enabling the establishment of divergent selection lines for low and high RFI (Arthur et al., 1996) and the development of an estimated breeding value (EBV) for RFI (RFIEBV; Exton et al., 1999) in Australia. Angus cattle divergently selected for RFI currently attain the same growth rates but differ by approximately 15% in their voluntary feed intake (Herd et al., 2002). Cattle selected for low RFI can therefore be expected to produce less methane than do high RFI cattle (Okine et al., 2001; Herd et al., 2002), and this was evident in a recent comparison of efficient and inefficient cattle (Nkrumah et al., 2005, 2006). The objective of this study was to quantify the relationship between RFIEBV and daily methane production of cattle consuming a feedlot diet. An initial analysis of part of the data from this experiment was reported by Hegarty et al. (2005).
MATERIALS AND METHODS
Table 1. Ingredient (as-is basis) and nutrient (DM basis; ±SD) composition of the ration fed to steers selected for low or high residual feed intake Ingredient Barley grain Cereal hay Cottonseed meal Molaphos1 Limestone (ground) Sodium bicarbonate Ammonium sulfate Nutrient DM ADF NDF Nitrogen DM digestibility GE, MJ/kg ME, MJ/kg
% 75 10 5 8 1 0.5 0.5 88.7 7.98 ± 17.83 ± 2.55 ± 81.9 ± 17.80 ± 12.1 ±
0.94 0.64 0.20 1.20 0.13 0.19
1 Molaphos is a molasses-based mineral, vitamin, and urea supplement (Champion Liquid Feeds, Brisbane, Australia) and was augmented with Monensin (Elanco Animal Health, Indianapolis, IN) to provide 22 to 25 ppm of Monensin in the total ration.
Selection and Allocation of Animals This experiment was approved by the University of New England Animal Ethics Committee and followed the University of New England code of conduct for research in meeting the Australian Code of Practice for the Care and Use of Animals. Lines of Angus cattle divergently selected for low or high RFI had been established at the Trangie Agricultural Research Center, New South Wales, Australia (Arthur et al., 1996, 2001a). Steer progeny (n = 189) generated by approximately 2.4 generations of divergent selection were reared on pasture before selection of 96 steers for entry into a feedlot for finishing at 20 mo of age (starting BW 557 kg ± 45.6 SD). The 96 steers selected for study of MPR were chosen based on their midparent RFIEBV and were selected on the basis that they covered the full range of estimated breeding values for RFI available within the divergently selected high and low RFI cattle lines. The RFIEBV for each steer was estimated as the mean of RFIEBV of the sire and dam derived from 70-d postweaning feed efficiency tests at Trangie (Arthur et al., 2001a). Steers were allocated using stratified randomization to 8 feedlot pens (12 animals/pen) such that the average weight and RFIEBV of the pens did not differ when allocated. Five steers were removed from the study before measurements commenced due to initial inappetence, so that 91 steers were available for RFI and methane measurement.
Feeding A total mixed ration based on barley and roughage (Table 1) was provided for ad libitum consumption, with the ration being dispensed through Ruddweigh automatic feeders (Ruddweigh, Guyra, Australia), with 12 steers and 1 feeder per pen (Bindon, 2001). These feeders recorded the number of feeding events and the dura-
tion and weight of feed consumed at each feeding session and were activated by electronic identification whenever an animal entered the feeding stall. A meal was defined as the period from which a new animal was detected in the automatic feeder and continued until the animal left, as indicated by the animal not being detected at the feeder for a period greater than 120 s or by a new animal at the feeder. Daily subsamples of the feed were frozen, with a composite sample for each 10-d measurement period being analyzed for nutritional content. Analyses of dietary ADF, NDF (Van Soest and Wine 1967), and N (Kjeltec series 2000; Foss Pacific Pty. Ltd.) were conducted by a commercial laboratory (Feedtest, Hamilton, Australia), whereas GE content was determined, using an IKA C7000 bomb calorimeter (IKA Werke, Staufen, Germany), on samples ground to pass through a 0.5-mm sieve and dried to 105°C.
Methane Production Rate Measurement Methane production rate (MPR) was measured in 2 randomly selected pens of cattle per period, and there were 4 consecutive experimental periods. The SF6 tracer principle developed by Johnson et al. (1994) was used to measure MPR. To obtain greater SF6 concentrations in collected samples, high-release rate, SF6 permeation tubes (HRPT) were used (Hegarty et al., 2003). All steers were fitted with the halter and gas collection apparatus for 5 d before measurements being made to enable them to adapt to the equipment. Gas collections were then made for up to 10 consecutive days, with five 2-d collection periods. Because of equipment blockages or damage to collection equipment by steers, data were lost for some 2-d collection periods. Every day the cattle being measured were walked through the cattle yards,
Feed efficiency and methane production of cattle
1481
with one 125-m thick permeation window and one 250m thick permeation window were used in subsequent periods to slow the permeation rate. In vitro incubations indicated that rumen fermentation was not affected by the levels of SF6 present in the rumen when HRPT were in use (Goopy et al., 2003). All HRPT were recovered at the abattoir after animals were slaughtered.
Gas Sampling
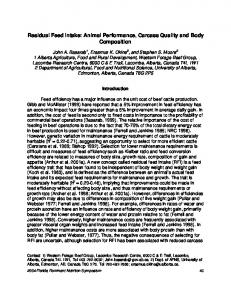
Figure 1. Steer fitted with methane collection apparatus. An aluminum collection canister (5 L) connected to air sampling points above the nose was mounted on a plastic saddle held in place by an elastic girth.
and the halter and collection apparatus were checked in the raceway for damage. The design of the automatic feeder prevented use of the standard collection yokes (Lassey et al., 1997), so collection canisters mounted on the back were required (Figure 1).
Permeation Tubes Intraruminal SF6 permeation tubes were prepared 7 d before use. The HRPT featured 2 large permeation windows and were maintained at 39°C in a dry oven during calibration and were weighed daily to give a gravimetric measure of SF6 release before insertion in the animals. The HRPT were maintained at 39°C during transfer from the oven to the animal, and additional tubes were transported and then returned to the laboratory to confirm that this transfer did not compromise the permeation rate. The HRPT were based on a tubular body machined from aluminum (series 2000), with threaded brass end-caps into which were fitted 2.5-cm diameter, 2.0-m porosity, stainless steel, sintered frits (Alltech Australia, Sydney, Australia). Beneath the frits, a Teflon permeation membrane (Unasco Pty. Ltd., Sydney, Australia) was held in by a polyvinylchloride washer, which faced onto the aluminum body (Hegarty et al., 2003). This design of permeation tube had previously been tested, and the release rate over the first 5 d was shown to not differ from the release rate over d 5 to 16 (Hegarty et al., 2003). In monitoring the rate of change of weight in HRPT during calibration, some tubes displayed a nonlinear release rate; this was accounted for by fitting a curvilinear model to the gravimetric data, and estimating the mean release rate over the methane measurement period. In the first measurement period, SF6 release rates averaged 275 mg/d, which was greater than required for analysis, so tubes
Air (∼0.8 mL/min) was drawn under vacuum from above the nostrils into 3.18-mm o.d. nylon tubing and into a coiled tube (Advanced Technology Pneumatics, Cleveland, OH), which carried the sample from the halter to the collection canister mounted on the back of the steer. A 10-m porosity gas filter (Parker, Otsego, MI) and stainless steel capillary tube (8 cm × 76-127 m i.d.; Alltech Australia, Sydney, Australia) were inserted after the coil tube and connected directly to the collection canister. Subsamples of air from above the steer’s nostrils were collected over 5 consecutive 2-d periods, with vacuum in the 5-L collection canister being typically 45 kPa after the 2 d of collection. Tests showed that the flow rate of air into the canister declined from 0.73 to 0.60 mL/min over the 48-h collection. It was assumed this slight change in sampling rate did not bias the methane:SF6 ratio of the collected sample because methane and SF6 would always have been drawn in the ratios in which they existed at the sampling site at any instant. The collection canister was constructed from welded aluminum pipe (150 × 320 mm) fitted with a 3.18-mm quick-connect female valve. Canisters were mounted on molded polyvinylchloride saddles attached to the steer by a girth strap (Figure 1). A piston pump (Model 2581C-02, Welch Thomas, Skokie, IL) was used to draw the sample out of the canister into a Tedlar sample bag, and the canisters were evacuated, flushed with N2, and reevacuated for reuse. Vacuum in the canisters was checked and recorded whenever canisters were placed on or removed from an animal. Tests with a mixed gas standard (methane:SF6, 206:1, vol/vol) indicated the methane:SF6 ratio was unchanged after storage in the aluminium canisters for 60 h and release by positive pressure (207:1) or extraction from the canister by mild vacuum (207:1) or strong vacuum (208:1).
Gas Analysis Samples were transferred from the canister into an evacuated, 5-L Tedlar bag (Supelco International, Bellefonte, PA) using the piston pump. Methane concentration was determined using an Innova 1312, photoacoustic multigas monitor (Innova Airtech Instruments, Ballerup, Denmark), and SF6 was determined by gas chromatography. All analyses were completed within 8 h of the samples being transferred to the Tedlar bag. A gas chromatograph (model 427, Packard Instrument Co., Downers Grove, IL) fitted with an electron
1482
Hegarty et al.
capture detector was used for SF6 analysis (Goldsack et al., 1979). Samples were analyzed in duplicate with a 5-mL sampling loop being flushed with 50 mL of sample before injection. The sample was carried in a N2 carrier stream (13 mL/min) through a 2 m × 3.175 mm stainless steel column packed with washed, 80 to 100 mesh, Molecular Sieve 5A (Alltech Australia, Sydney, Australia) and maintained at an oven temperature of 80°C. Nitrogen make-up gas was introduced to provide a total flow of 40 mL/min through the detector that was maintained at 300°C. Calibration was performed daily using a dilution series (118 to 0 ppb) prepared daily from a 5-ppm SF6 standard (BOC Limited, Sydney, Australia) and cross-checked against an independent 100-ppb SF6 standard (BOC Limited). Peak areas were determined using a Chromatopac, C-R1B Data Processor (Shimadzu, Kyoto, Japan). Detector response was defined daily using dilution of standards and the quadratic calibration curve: y = yo + ax + bx2, fitted in Sigmaplot (Hearne Scientific Software, Melbourne, Victoria, Australia).
Calculation of Predicted Methane Production Rate The equation of Blaxter and Clapperton (1965), as corrected by Wilkerson et al. (1995), was used to predict how much methane should have been produced from each steer during each measurement period: % GE = {1.3 + (0.112 × % digestibility / 100) + (ME intake/maintenance requirement for ME) × [2.37 − (0.05 × % digestibility / 100)]}, where % GE is the percentage of GE intake lost as methane, and % digestibility is the apparent digestibility of dietary energy, for which DM digestibility was taken as a proxy. In applying the equation of Blaxter and Clapperton (1965) to predict MPR, the maintenance energy requirement of the steers was calculated according to the AFRC (1994; Eq. 39), assuming A (activity allowance) = 0.0071 × BW and km (net efficiency of use of ME for maintenance) = [(0.02 × MJ of ME/kg of DM) + 0.5], as defined by CSIRO (1990). Predicted daily methane production (g/d) was then derived by allowance for the energy value of methane and GE intake.
Residual Feed Intake Measurement Three descriptions of RFI were used in analyses of the data. The RFIEBV used to select steers for this study was the midparent EBV calculated as described by Arthur et al. (2001a). The principal RFI determination in this study (RFI70d) was calculated as the residuals from the regression of daily feed intake on midtest metabolic BW and ADG over the test period. Steers were weighed weekly (when not being measured for MPR); their BW
was regressed against day of test; and a regression was fitted to predict their BW on d 0 and 69. Midtest BW was calculated from this linear regression as BW on d 35, and midtest metabolic BW was midtest BW0.75. The ADG was determined as the slope of the linear regression. Daily feed intake was the average daily intake over the first 68 d of test, whereas intake data from the final day of study was omitted because there was significant animal handling and activity at the closure of the study. The DMI was standardized to a ME content of 12 MJ/kg of DM and expressed on a DM basis. This standardization involved multiplying the measured DMI by the measured ME content of that batch of feed and then dividing by 12. This corrected the intake of feed as provided (ME content range, 11.8 to 12.2 MJ/ kg of DM) to the DMI of feed of 12 MJ/kg of DM, which would have been required to provide the same ME intake. The DMI for the 91 steers was then regressed against their midtest metabolic BW and ADG, and the residuals representing the differences between actual and predicted DMI were used as the measure of RFI70d. Although periods of at least 40 d are typically required to estimate DMI, and 70 d to estimate ADG with sufficient precision to allow RFI to be calculated (Archer et al., 1997), the RFI (RFI15d) over the short period in which methane was measured was also calculated for this study. The BW was determined every 2 d during the methane measurement period. The RFI15d was calculated using all intake and BW data collected during the 5 d of adaptation in which the steers were fitted with harnesses but were not sampled, plus the 10 d of methane collection.
Statistical Analysis Comparisons of feeding and growth characteristics for the animals during methane collection and noncollection periods were conducted using linear mixed modeling (Gilmour et al., 2002). The fixed model was: Constant + CH4 collection + Day, where Constant was the underlying mean for the variable being analyzed, CH4 collection was a factor that described whether the animal was wearing the methane collection apparatus or not, and Day was a covariate inserted to account for variation resulting from responses to changes in ambient temperature, daylength, etc., over the data collection period. These effects were evaluated using a least squares process, which ultimately produced Wald statistics. The random model in this analysis was Pen + Pen(eartag), which is the variation between groups of animals (i.e., pen) and the variation between animals within each group [i.e., Pen(eartag)].
1483
Feed efficiency and methane production of cattle
Table 2. Range in feeding characteristics, and growth and methane production of steers selected for low or high residual feed intake (RFI) averaged over the experimental period1 Item Initial BW, kg Final BW, kg ADG, kg Methane production g/d MJ/100 MJ of GE Eating characteristics during 10-d methane measurement DMI, kg/d Meal size, kg No. meals/d RFI70d, kg/d RFIEBV, kg/d
Minimum
Mean
Maximum
SD
432 494 0.76
541 642 1.46
666 782 2.11
44.4 52.1 0.32
84.4 1.94
179.6 4.92
395.8 10.60
63.7 4.92
5.87 0.59 3.50 −2.62 −0.70
11.31 1.46 9.50 0.00 −0.08
20.02 3.18 21.6 3.57 0.92
2.33 0.62 3.41 1.13 0.51
1 Data are only from steers for which 6 or more d of methane collection were achieved (n = 76; statistics for raw data).
Only cattle for which 6 d of methane production were available (n = 76) were included in statistical analyses involving MPR.
RESULTS Steers in this study (n = 76) consumed a mean of 11.3 kg of DM of the barley-based ration daily, with this ration being consumed in an average of 9.5 meals/d of 1.46 kg of mean meal size (Table 2). This intake equated to 2.0% of mean midtest BW and supported a mean ADG of 1.46 kg, which was comparable with the 1.6 kg/d growth rate predicted by the Australian feeding standards (CSIRO, 1990) as described in GrazFeed (Freer et al., 1997). Across the 70-d feeding period, there were positive associations between methane production and feed intake (MPR, g/d = 13.6 [±2.6] × DMI + 38.5; P = 0.001; r2 = 0.26), and between daily feed intake and RFIEBV (DMI = 1.17 [± 0.48] × RFIEBV + 11.36; P = 0.05; r2 = 0.054). Given these 2 relationships, it was expected that a direct relationship between MPR and RFIEBV would be observed, but this was not the case (MPR, g/ d = 2.2 × RFIEBV + 202.5; P = 0.88). Comparison of feeding characteristics of the steers when methane measurements were being made, in contrast to when methane measurements were not being made (Table 3), indicated that the process of measuring methane emissions did affect feed intake and feeding pattern. During the methane measurement period, cattle had a reduced DMI (P = 0.001) and ate a larger number of smaller meals, than when MPR was not being measured (P = 0.01). The change in intake during MPR measurement may have confounded the test for association between MPR (measured over 10 d) and RFIEBV (based on 70-d intake data), so RFI was recalculated for the shorter period when steers were being prepared and measured for MPR (RFI15d). Over this period there was a positive association between methane production and RFI15d such that MPR (g/d) = 13.30 [± 4.04] × RFI15d + 179.5 (P = 0.002; r2 = 0.12).
The relationship between RFI and RFIEBV was the same when RFI was measured over 10 or 70 d (RFI, kg/d = 0.99 × RFIEBV + 0.051; r2 = 0.11; P < 0.001), although the SE of the regression coefficient was greater for RFI15d than for RFI70d (SE = 0.321 vs. 0.201). The relationship established between MPR and RFI15d was adjusted for this RFI:RFIEBV relationship and the regression equation between MPR and RFIEBV calculated. By this procedure, a reduction in methane emission of 13.38 g/d was calculated to be associated with a 1 kg/d reduction in RFIEBV. To further evaluate the association between methane and RFI over the methane measurement period, the MPR and intake characteristics of the 10 steers with the lowest (L) and the 10 steers with the greatest (H) RFI15d were compared (Table 4). There was no difference (P > 0.05) in ADG between L and H steers, although L steers ate 41% less DM each day and expressed an improved feed conversion efficiency (P = 0.001) relative to H steers. The L steers emitted 25% less methane daily than did H steers, and their growth had a lower methane cost (24% less methane per unit ADG). The intake and growth contrasts between steers with the greatest and lowest RFI over 70 d were similar to those just described for RFI15d, with the 10 lowest RFI70d steers showing 41% lower DMI, no difference in ADG, but improved G:F (P < 0.001) compared with the 10 greatest RFI70d steers.
DISCUSSION The quantity of ration consumed is an important determinant of the daily methane emission of livestock and has been included in all widely used predictors of daily methane production (Blaxter and Clapperton, 1965; Benchaar et al., 1998; Pelchen and Peters, 1998). Review of recent studies, however, highlights that much of the variation in MPR is attributable to factors other than feed intake (Machmu¨ller and Clark, 2005). On all but the greatest digestibility diets, a positive
1484
Hegarty et al.
Table 3. Feeding characteristics of steers selected for low or high residual feed intake (n = 76) during methane measurement (4-d presampling and 10-d sampling) and during the remaining 56 d of feeding when steers were not harnessed for methane sampling Trait
Nonmeasurement period
Measurement period
SED
χ2 P-value
590.8 11.88 8.98 1.61 5,667
573.1 11.18 9.34 1.52 5,168
0.54 0.107 0.139 0.026 55.15