Dec 24, 2010 - Colin C. Venteres and Dr. Matthew Cooper, âA Review of Content-Based Image Retrieval Systemsâ, Available at:.
National Conference on Recent Trends in information/Network Security, 23rd – 24th December, 2010
CBIR: Content Based Image Retrieval 1
K.Kranthi Kumar, Associate Professor, Dept.of CSE, Netaji Institute Of Engg.& Tech.,Toopranpet,Nalgonda(dist) 2 Dr.T.Venu Gopal, Associate Professor, Dept of CSE, JNTUH College of Engineeering, Jagityal, Kaimnagar.
Abstract: The purpose of this report is to describe research and solution to the problem of designing a Content Based Image Retrieval, CBIR system. It outlines the problem, the proposed solution, the final solution and the accomplishments achieved. Due to the enormous increase in image database sizes, as well as its vast deployment in various applications, the need for CBIR development arose. Firstly, this report outlines a description of the primitive features of an image; texture, colour, and shape. These features are extracted and used as the basis for a similarity check between images. The algorithms used to calculate the similarity between extracted features, are then explained. Our final result was a MatLab built software application, with an image database, that utilized texture and colour features of the images in the database as the basis of comparison and retrieval. The structure of the final software application is illustrated. Furthermore, the results of its performance are illustrated by a detailed example. Keywords: Content Based Image Retrieval(CBIR), Similarity, Features and Image Database.
1. INTRODUCTION TO CBIR As processors become increasingly powerful, and memories become increasingly cheaper, the deployment of large image databases for a variety of applications have now become realisable. Databases of art works, satellite and medical imagery have been attracting more and more users in various professional fields — for example, geography, medicine, architecture, advertising, design, fashion, and publishing. Effectively and efficiently accessing desired images from large and varied image databases is now a necessity [1]. 1.1 Definition CBIR or Content Based Image Retrieval is the retrieval of images based on visual features such as colour, texture and shape [2]. Reasons for its development are that in many large image databases, traditional methods of image indexing have proven to be insufficient, laborious, and extremely time consuming. These old methods of image indexing, ranging from storing an image in the database and associating it with a keyword or number, to associating it with a categorized description, have become obsolete. This is not CBIR. In CBIR, each image that is stored in the database has its features extracted and compared to the features of the query image. It involves two steps [3]: Feature Extraction: The first step in the process is extracting image features to a distinguishable extent. Matching: The second step involves matching these features to yield a result that is visually similar. 1.2 Applications of CBIR Examples of CBIR applications are [4]: Crime prevention: Automatic face recognition systems, used by police forces. Security Check: Finger print or retina scanning for access privileges. Medical Diagnosis: Using CBIR in a medical database of medical images to aid diagnosis by identifying similar past cases. Intellectual Property: Trademark image registration, where a new candidate mark is compared with existing marks to ensure no risk of confusing property ownership. 1.3 CBIR Systems Several CBIR systems currently exist, and are being constantly developed. Examples are [5]: QBIC or Query By Image Content was developed by IBM, Almaden Research Centre, to allow users to graphically pose and refine queries based on multiple visual properties such as colour, texture and shape [5]. It supports queries based on input images, user-constructed sketches, and selected colour and texture patterns [2]. VIR Image Engine by Virage Inc., like QBIC, enables image retrieval based on primitive attributes such as colour, texture and structure. It examines the pixels in the image and performs an analysis process, deriving image characterization features [5]. VisualSEEK and WebSEEK were developed by the Department of Electrical Engineering, Columbia University. Both these systems support colour and spatial location matching as well as texture matching [5]. NeTra was developed by the Department of Electrical and Computer Engineering, University of California. It supports colour, shape, spatial layout and texture matching, as well as image segmentation [5]. MARS or Multimedia Analysis and Retrieval System was developed by the Beckman Institute for Advanced Science and Technology, University of Illinois. It supports colour, spatial layout, texture and shape matching [5]. 36
National Conference on Recent Trends in information/Network Security, 23rd – 24th December, 2010
Viper or Visual Information Processing for Enhanced Retrieval was developed at the Computer Vision Group, University of Geneva. It supports colour and texture matching [5]. 1.3.1. Problem Motivation Image databases and collections can be enormous in size, containing hundreds, thousands or even millions of images. The conventional method of image retrieval is searching for a keyword that would match the descriptive keyword assigned to the image by a human categorizer [6]. Currently under development, even though several systems exist, is the retrieval of images based on their content, called Content Based Image Retrieval, CBIR. While computationally expensive, the results are far more accurate than conventional image indexing. Hence, there exists a tradeoff between accuracy and computational cost. This tradeoff decreases as more efficient algorithms are utilized and increased computational power becomes inexpensive. 1.3.2. Problem Statement The problem involves entering an image as a query into a software application that is designed to employ CBIR techniques in extracting visual properties, and matching them. This is done to retrieve images in the database that are visually similar to the query image. 1.3.3. Proposed Solution The solution initially proposed was to extract the primitive features of a query image and compare them to those of database images. The image features under consideration were colour, texture and shape. Thus, using matching and comparison algorithms, the colour, texture and shape features of one image are compared and matched to the corresponding features of another image. This comparison is performed using colour, texture and shape distance metrics. In the end, these metrics are performed one after another, so as to retrieve database images that are similar to the query. The similarity between features was to be calculated using algorithms used by well known CBIR systems such as IBM's QBIC. For each specific feature there was a specific algorithm for extraction and another for matching. 1.3.4. Accomplishments What was accomplished was a software application that retrieved images based on the features of texture and colour, only. Colour extraction and comparison were performed using colour histograms and the quadratic distance algorithm, respectively. Texture extraction and comparison are performed using an energy level algorithm and the Euclidean distance algorithm, respectively. Due to the time it took to research the algorithm used to check colour similarity and the trials and failures with different image formats there was no time to go on to the next important feature, which was shape. This was unfortunate, since we had accomplished a lot in terms of research on the topic. 1.3.5. Overview of Report This report is divided into three main sections. The first section deals with a general introduction to CBIR. The second concerns the background of the features employed in CBIR. The third deals with the technical part which is a full explanation of the algorithms used, and how they worked, and a mention of the things that didn't work. 2. BACKGROUND 2.1 Colour 2.1.1 Definition One of the most important features that make possible the recognition of images by humans is colour. Colour is a property that depends on the reflection of light to the eye and the processing of that information in the brain. We use colour everyday to tell the difference between objects, places, and the time of day [7]. Usually colours are defined in three dimensional colour spaces. These could either be RGB (Red, Green, and Blue), HSV (Hue, Saturation, and Value) or HSB (Hue, Saturation, and Brightness). The last two are dependent on the human perception of hue, saturation, and brightness. Most image formats such as JPEG, BMP, GIF, use the RGB colour space to store information [7]. The RGB colour space is defined as a unit cube with red, green, and blue axes. Thus, a vector with three co-ordinates represents the colour in this space. When all three coordinates are set to zero the colour perceived is black. When all three coordinates are set to 1 the colour perceived is white [7]. The other colour spaces operate in a similar fashion but with a different perception. 2.1.2 Methods of Representation The main method of representing colour information of images in CBIR systems is through colour histograms. A colour histogram is a type of bar graph, where each bar represents a particular colour of the colour 37
National Conference on Recent Trends in information/Network Security, 23rd – 24th December, 2010
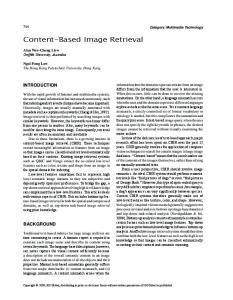
space being used. In MatLab for example you can get a colour histogram of an image in the RGB or HSV colour space. The bars in a colour histogram are referred to as bins and they represent the x-axis. The number of bins depends on the number of colours there are in an image. The y-axis denotes the number of pixels there are in each bin. In other words how many pixels in an image are of a particular colour. An example of a colour histogram in the HSV colour space can be seen with the following image:
Figure.1: Sample Image and its Corresponding Histogram
To view a histogram numerically one has to look at the colour map or the numeric representation of each bin. Colour Map (x-axis) H S 0.9922 0.9882 0.9569 0.9569 0.9725 0.9647 0.9176 0.9137 0.9098 0.8980 0.9569 0.9255 0.9020 0.8627 0.9020 0.8431 0.9098 0.8196 0.8549 0.8510 0.8235 0.8235 0.8471 0.8353 0.8353 0.7961 . . . . . .
Number of Pixels per Bin (y-axis) V 0.9961 0.9882 0.9765 0.9569 0.9176 0.9412 0.8980 0.8510 0.8078 0.8941 0.8941 0.8549 0.8392 . . .
106 242 273 372 185 204 135 166 179 188 241 104 198 . . .
Table.1: Colour Map and Number of pixels for the Previous Image.
As one can see from the colour map each row represents the colour of a bin. The row is composed of the three coordinates of the colour space. The first coordinate represents hue, the second saturation, and the third, value, thereby giving HSV. The percentages of each of these coordinates are what make up the colour of a bin. Also one can see the corresponding pixel numbers for each bin, which are denoted by the blue lines in the histogram. Quantization in terms of colour histograms refers to the process of reducing the number of bins by taking colours that are very similar to each other and putting them in the same bin. By default the maximum number of bins one can obtain using the histogram function in MatLab is 256. For the purpose of saving time when trying to compare colour histograms, one can quantize the number of bins. Obviously quantization reduces the information regarding the content of images but as was mentioned this is the tradeoff when one wants to reduce processing time. There are two types of colour histograms, Global colour histograms (GCHs) and Local colour histograms (LCHs). A GCH represents one whole image with a single colour histogram. An LCH divides an image into fixed blocks and takes the colour histogram of each of those blocks [7]. LCHs contain more information about an image but are computationally expensive when comparing images. “The GCH is the traditional method for colour based image retrieval. However, it does not include information concerning the colour distribution of the regions [7]” of an image. Thus when comparing GCHs one might not always get a proper result in terms of similarity of images.
38
National Conference on Recent Trends in information/Network Security, 23rd – 24th December, 2010
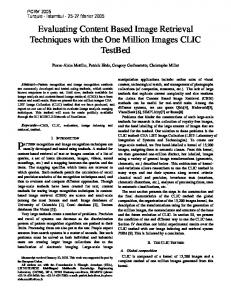
2.2. Texture 2.2.1 Definition Texture is that innate property of all surfaces that describes visual patterns, each having properties of homogeneity. It contains important information about the structural arrangement of the surface, such as; clouds, leaves, bricks, fabric, etc. It also describes the relationship of the surface to the surrounding environment [2]. In short, it is a feature that describes the distinctive physical composition of a surface. Texture properties include: Coarseness Contrast Directionality Line-likeness Regularity Roughness Texture is one of the most important defining features of an image. It is characterized by the spatial distribution of gray levels in a neighborhood [8]. In order to capture the spatial dependence of gray-level values, which contribute to the perception of texture, a two-dimensional dependence texture analysis matrix is taken into consideration. This two-dimensional matrix is obtained by decoding the image file; jpeg, bmp, etc. 2.2.2 Methods of Representation There are three principal approaches used to describe texture; statistical, structural and spectral… Statistical techniques characterize textures using the statistical properties of the grey levels of the points/pixels comprising a surface image. Typically, these properties are computed using: the grey level co-occurrence matrix of the surface, or the wavelet transformation of the surface. Structural techniques characterize textures as being composed of simple primitive structures called “texels” (or texture elements). These are arranged regularly on a surface according to some surface arrangement rules. Spectral techniques are based on properties of the Fourier spectrum and describe global periodicity of the grey levels of a surface by identifying high-energy peaks in the Fourier spectrum [9].
(a) Clou ds
(c) Roc ks
(b) Figure.2: Examples of Textures Bri For optimum classification purposes,cks what concern us are the statistical techniques of characterization… This
is because it is these techniques that result in computing texture properties… The most popular statistical representations of texture are: Co-occurrence Matrix Tamura Texture Wavelet Transform 2.2.2.1 Co-occurrence Matrix Originally proposed by R.M. Haralick, the co-occurrence matrix representation of texture features explores the grey level spatial dependence of texture [2]. A mathematical definition of the co-occurrence matrix is as follows [4]: - Given a position operator P(i,j), - let A be an n x n matrix - whose element A[i][j] is the number of times that points with grey level (intensity) g[i] occur, in the position specified by P, relative to points with grey level g[j]. - Let C be the n x n matrix that is produced by dividing A with the total number of point pairs that satisfy P. C[i][j] is a measure of the joint probability that a pair of points satisfying P will have values g[i], g[j]. 39
National Conference on Recent Trends in information/Network Security, 23rd – 24th December, 2010
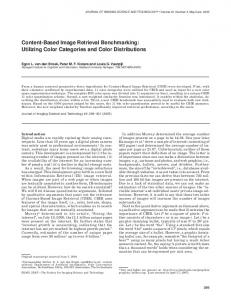
- C is called a co-occurrence matrix defined by P. Examples for the operator P are: “i above j”, or “i one position to the right and two below j”, etc. [4] This can also be illustrated as follows… Let t be a translation, then a co-occurrence matrix Ct of a region is defined for every grey-level (a, b) by [1]: Ct (a, b) card {( s, s t ) R2 | A[ s] a, A[ s t ] b} Here, Ct(a, b) is the number of site-couples, denoted by (s, s + t) that are separated by a translation vector t, with a being the grey-level of s, and b being the grey-level of s + t. For example; with an 8 grey-level image representation and a vector t that considers only one neighbour, we would find [1]:
Figure.3: Image example
Figure.4: Classical Co-occurrence matrix
At first the co-occurrence matrix is constructed, based on the orientation and distance between image pixels. Then meaningful statistics are extracted from the matrix as the texture representation [2]. Haralick proposed the following texture features [10]: 1. Angular Second Moment 2. Contrast 3. Correlation 4. Variance 5. Inverse Second Differential Moment 6. Sum Average 7. Sum Variance 8. Sum Entropy 9. Entropy 10. Difference Variance 11. Difference Entropy 12. Measure of Correlation 1 13. Measure of Correlation 2 14. Local Mean Hence, for each Haralick texture feature, we obtain a co-occurrence matrix. These co-occurrence matrices represent the spatial distribution and the dependence of the grey levels within a local area. Each (i,j) th entry in the matrices, represents the probability of going from one pixel with a grey level of 'i' to another with a grey level of 'j' under a predefined distance and angle. From these matrices, sets of statistical measures are computed, called feature vectors [11]. 2.2.2.2 Tamura Texture By observing psychological studies in the human visual perception, Tamura explored the texture representation using computational approximations to the three main texture features of: coarseness, contrast, and directionality [2, 12]. Each of these texture features are approximately computed using algorithms… Coarseness is the measure of granularity of an image [12], or average size of regions that have the same intensity [13]. Contrast is the measure of vividness of the texture pattern. Therefore, the bigger the blocks that make up the image, the higher the contrast. It is affected by the use of varying black and white intensities [12]. Directionality is the measure of directions of the grey values within the image [12]. 40
National Conference on Recent Trends in information/Network Security, 23rd – 24th December, 2010
2.2.2.3 Wavelet Transform Textures can be modeled as quasi-periodic patterns with spatial/frequency representation. The wavelet transform transforms the image into a multi-scale representation with both spatial and frequency characteristics. This allows for effective multi-scale image analysis with lower computational cost [2]. According to this transformation, a function, which can represent an image, a curve, signal etc., can be described in terms of a coarse level description in addition to others with details that range from broad to narrow scales [11]. Unlike the usage of sine functions to represent signals in Fourier transforms, in wavelet transform, we use functions known as wavelets. Wavelets are finite in time, yet the average value of a wavelet is zero [2]. In a sense, a wavelet is a waveform that is bounded in both frequency and duration. While the Fourier transform converts a signal into a continuous series of sine waves, each of which is of constant frequency and amplitude and of infinite duration, most real-world signals (such as music or images) have a finite duration and abrupt changes in frequency. This accounts for the efficiency of wavelet transforms. This is because wavelet transforms convert a signal into a series of wavelets, which can be stored more efficiently due to finite time, and can be constructed with rough edges, thereby better approximating real-world signals [14]. Examples of wavelets are Coiflet, Morlet, Mexican Hat, Haar and Daubechies. Of these, Haar is the simplest and most widely used, while Daubechies have fractal structures and are vital for current wavelet applications [2]. These two are outlined below: Haar Wavelet The Haar wavelet family is defined as [2]:
Figure.5: Haar Wavelet Example
Daubechies Wavelet The Daubechies wavelet family is defined as [2]:
Figure.6: Daubechies Wavelet Example
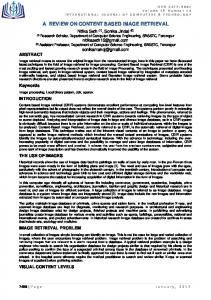
Later in this report, in the Project Details, further details regarding the wavelet transform will be touched upon. 2.3 Shape 2.3.1 Definition Shape may be defined as the characteristic surface configuration of an object; an outline or contour. It permits an object to be distinguished from its surroundings by its outline [15]. Shape representations can be generally divided into two categories [2]: Boundary-based, and Region-based.
41
National Conference on Recent Trends in information/Network Security, 23rd – 24th December, 2010
Figure.7: Boundary-based & Region-based
Boundary-based shape representation only uses the outer boundary of the shape. This is done by describing the considered region using its external characteristics; i.e., the pixels along the object boundary. Region-based shape representation uses the entire shape region by describing the considered region using its internal characteristics; i.e., the pixels contained in that region [17]. 2.3.2 Methods of Representation For representing shape features mathematically, we have [16]: Boundary-based: Polygonal Models, boundary partitioning Fourier Descriptors Splines, higher order constructs Curvature Models Region-based: Superquadrics Fourier Descriptors Implicit Polynomials Blum's skeletons The most successful representations for shape categories are Fourier Descriptor and Moment Invariants [2]: The main idea of Fourier Descriptor is to use the Fourier transformed boundary as the shape feature. The main idea of Moment invariants is to use region-based moments, which are invariant to transformations as the shape feature. 3. CONCLUSION The dramatic rise in the sizes of images databases has stirred the development of effective and efficient retrieval systems. The development of these systems started with retrieving images using textual connotations but later introduced image retrieval based on content. This came to be known as CBIR or Content Based Image Retrieval. Systems using CBIR retrieve images based on visual features such as colour, texture and shape, as opposed to depending on image descriptions or textual indexing. In this project, we have researched various modes of representing and retrieving the image properties of colour, texture and shape. Due to lack of time, we were only able to fully construct an application that retrieved image matches based on colour and texture only. The application performs a simple colour-based search in an image database for an input query image, using colour histograms. It then compares the colour histograms of different images using the Quadratic Distance Equation. Further enhancing the search, the application performs a texture-based search in the colour results, using wavelet decomposition and energy level calculation. It then compares the texture features obtained using the Euclidean Distance Equation. A more detailed step would further enhance these texture results, using a shapebased search. CBIR is still a developing science. As image compression, digital image processing, and image feature extraction techniques become more developed, CBIR maintains a steady pace of development in the research field. Furthermore, the development of powerful processing power, and faster and cheaper memories contribute heavily to CBIR development. This development promises an immense range of future applications using CBIR. 4. REFERENCES 1. 2. 3. 4. 5. 6.
7. 8.
Barbeau Jerome, Vignes-Lebbe Regine, and Stamon Georges, “A Signature based on Delaunay Graph and Co-occurrence Matrix,” Laboratoire Informatique et Systematique, Universiyt of Paris, Paris, France, July 2002, Sharmin Siddique, “A Wavelet Based Technique for Analysis and Classification of Texture Images,” Carleton University, Ottawa, Canada, Proj. Rep. 70.593, April 2002. Thomas Seidl and Hans-Peter Kriegel, “Efficient User-Adaptable Similarity Search in Large Multimedia Databases,” in Proceedings of the 23rd International Conference on Very Large Data Bases VLDB’97, Athens, Greece, August 1997. FOLDOC, Free On-Line Dictionary Of Computing, “co-occurrence matrix,” May 1995, Available at: http://foldoc.doc.ic.ac.uk/foldoc/foldoc.cgi?cooccurrence+matrix Colin C. Venteres and Dr. Matthew Cooper, “A Review of Content-Based Image Retrieval Systems”, Available at: http://www.jtap.ac.uk/reports/htm/jtap-054.html Linda G. Shapiro, and George C. Stockman, Computer Vision, Prentice Hall, 2001. Shengjiu Wang, “A Robust CBIR Approach Using Local Color Histograms,” Department of Computer Science, University of Alberta, Edmonton, Alberta, Canada, Tech. Rep. TR 01-13, October 2001. R. Jain, R. Kasturi, and B. G. Schunck, Machine Vision, McGraw Hill International Editions, 1995. FOLDOC, Free On-Line Dictionary Of Computing, “texture,” May 1995, [Online Document], Available at: http://foldoc.doc.ic.ac.uk/foldoc/foldoc.cgi?query=texture
42
National Conference on Recent Trends in information/Network Security, 23rd – 24th December, 2010 9. “Texture,” class notes for Computerized Image Analysis MN2, Centre for Image Analysis, Uppsala, Sweden, Winter 2002. 10. G. D. Magoulas, S. A. Karkanis, D. A. Karras and M. N. Vrahatis, “Comparison Study of Textural Descriptors for Training Neural Network Classifiers”, in Proceedings of the 3rd IEEE-IMACS World Multi-conference on Circuits, Systems, Communications and Computers, vol. 1, 6221-6226, Athens, Greece, July 1999. 11. Pravi Techasith, “Image Search Engine,” Imperial College, London, UK, Proj. Rep., July 2002, Found at: http://km.doc.ic.ac.uk/prp.techasith-2002/Docs/OSE.doc 12. Bjorn Johansson, “QBIC (Query By Image Content)”, November 2002, [Online Document], Available at: http://www.isy.liu.se/cvl/Projects/VISIT-bjojo/survey/surveyonCBIR/node26.html 13. FOLDOC, Free On-Line Dictionary Of Computing, “wavelet,” May 1995, [Online Document], Available at:http://foldoc.doc.ic.ac.uk/foldoc/foldoc.cgi?query=wavelet 14. Lexico Publishing Group, LLC, “shape”, [Online Document], Available at: http://dictionary.reference.com/search?q=shape 15. Benjamin B. Kimia, “Symmetry-Based Shape Representations,” Laboratory for Engineering Man/Machine Systems (LEMS), IBM, Watson Research Center, October 1999. 16. Marinette Bouet, Ali Khenchaf, and Henri Briand, “Shape Representation for Image Retrieval”,1999.
43