Gene Expression Profiling of Alveolar Rhabdomyosarcoma with cDNA Microarrays Javed Khan, Richard Simon, Michael Bittner, et al. Cancer Res 1998;58:5009-5013. Published online November 1, 1998.
Updated Version
Citing Articles
E-mail alerts Reprints and Subscriptions Permissions
Access the most recent version of this article at: http://cancerres.aacrjournals.org/content/58/22/5009
This article has been cited by 97 HighWire-hosted articles. Access the articles at: http://cancerres.aacrjournals.org/content/58/22/5009#related-urls
Sign up to receive free email-alerts related to this article or journal. To order reprints of this article or to subscribe to the journal, contact the AACR Publications Department at
[email protected]. To request permission to re-use all or part of this article, contact the AACR Publications Department at
[email protected].
Downloaded from cancerres.aacrjournals.org on July 13, 2011 Copyright © 1998 American Association for Cancer Research
(CANCER RESEARCH 58, 5009-5013,
November 15. 1998]
Advances in Brief
Gene Expression Profiling of Alveolar Rhabdomyosarcoma with cDNA Microarrays Javed Khan, Richard Simon, Michael Bittner, Yidong Chen, Stephen B. Leighton,1 Thomas Pohida, Paul D. Smith, Yuan Jiang, Gerald C. Gooden, Jeffrey M. Trent, and Paul S. Meltzer2 Cancer Genetics Branch. National Hitman Genome Research Institute [J. K., M. B.. Y. C., Y. J., G. C. G., J. M. T., P. S. M.}, Biometrie Research Branch, National Cancer Institute ¡R.S.I. Biomédical Engineering ami Instrumentation Program. National Center for Research Resources ¡S.B. L. P. D. S.¡. Computational Bioscience and Engineering Laboratory, Office of Research Sen'ices IT. P.I, NIH. Bethesda, Maryland 20892
by the presence of their diagnostic chromosome translocation. Addi tionally, because ARMS are aggressive soft tissue tumors of striated muscle with poor prognosis (12, 13) that belong to an often difficult to classify group of childhood tumors (13), new information regarding their biology will be of great clinical use.
Abstract Several forms of human sarcoma, lymphoma, and leukemia are char acterized by somatically acquired chromosome translocations that result in fusion genes that encode chimeric transcription factors with oncogenic properties. We have used cDNA microarrays containing 1238 cDNAs to investigate the gene expression profile of a group of seven alveolar rhab-
Materials and Methods
domyosarcoma (ARMS) cell lines characterized by the presence of the PAX3-FKHR fusion gene. Using the method of multidimensional scaling to represent the relationships among the cell lines in two-dimensional Eu
Cell Culture. The cell lines used in this study are described in Table 1. All cells were grown in 85% DMEM and 10% fetal bovine serum under identical conditions and harvested at 80-85% confluency. The control cell line NIL.C was a subclone of cell line CRL-7250 (American Type Culture
clidean space, we determined that ARMS cells show a consistent pattern of gene expression, which allows the cells to be clustered together. By searching across the seven ARMS cell lines, we found that 37 of 1238 genes were most consistently expressed in ARMS relative to a reference cell line. Only three of these genes have been previously reported to be expressed in ARMS. Among these 37 were genes related to both primary (PAX3-
Collection), which originated from a skin and muscle cell pool from a 13-week male fetus. The use of a control cell line allowed comparison from experiment to experiment. The choice of the comparator was somewhat arbitrary but was effective so long as the same cell line was used for each experiment. Microarrays, Probes, Hybridization, and Scanning. The glass slides were prepared by a similar method to described protocols (1.6). RNA was extracted from cells with the RNeasy kit (Qiagen). Following extraction, the RNA was concentrated using Microcon 30 (Amicon) to a volume of 17 /¿I.Fluorescence-labeled cDNA probes were made from 100-200 /ig of total RNA for tumor cell line and 100-200 /ig for control by oligo(dT)-
FKHR) and secondary (CDK4) genetic alterations in ARMS. These results in ARMS demonstrate the potential of cDNA microarray technology to elucidate tumor-specific gene expression profiles in human cancers.
Introduction Hybridization to cDNA microarrays allows the simultaneous par allel expression analysis of thousands of genes (1-6). This technique has been successfully used to investigate gene expression in processes as complex as inflammatory disease (3), tumor suppression (1), and metabolic regulation in Saccharomyces cerevisiae (2), as well as to identify heat shock and phorbol ester-regulated genes in human T cells (5). There is considerable interest in the potential application of cDNA microarray analysis for gene expression profiling in human cancers. Such information might be useful for tumor classification, for the elucidation of regulatory networks that are disturbed in tumor cells, and for the identification of genes that might be of use for diagnostic purposes or as therapeutic targets. However, it has not been clear whether the intrinsic genomic instability of tumors will lead to such extensive random fluctuations in global gene expression that this analysis will be difficult or impossible. We have initially investigated the problem of expression profiling in ARMS3 because these tumors are known to be relatively uniform genetically. Sixty % of ARMS tumors have a translocation t(2; 13)(q35;ql4) (7-9), resulting in fusion of the 5' end of PAX3 gene with the 3' end of FKHR to produce a novel fusion transcription factor
primed polymerization using Superscript II reverse transcriptase (LTI Inc.). The reactions were carried out at a final volume of 40 /il. Fluorescent nucleotides Cy5-dUTP and Cy3-dUTP (Amersham) were used at 0.1 mM. The nucleotide concentrations were 0.5 mM dGTP, dATP, and dCTP and 0.2 mM dTTP. Two /il of Superscript II were added at the beginning of the labeling reaction and incubated at 42°C.Two /il more were added after 30 min, and the reaction continued for a further 30 min. The reaction was stopped by the addition of 5 /il of 500 mM EDTA. The unlabeled RNA was hydrolyzed by the addition of 10 /il of l M NaOH and heating to 65°Cfor 1 h. Twenty-five /il of l M Tris-HCl (pH 7.5) were then added to partially neutralize the base. Unincorporated nucleotides and salts were removed by chromatography on a Biospin 6 column. The Cy5 and Cy3 probes were mixed, and probe volume was reduced using a Microcon 30. To this 8 /ig of poly(dA) (Pharmacia), 4 /ig of Escherichìa coli tRNA (Sigma Chemical Co.), 10 jag of Coti DNA (Life Technologies, Inc.). 0.3 /il of 10% SDS, 3 /il of 20X SSC (final concentration, 3X SSC), and water were added to a final volume of 20 /il. The probe was incubated at 98°Cfor 2 min and at 4°Cfor 10 s and placed onto the glass slide with a coverslip; hybridization was performed at 65°Cfor 16 h. The slides were washed for 2 min each in 0.5 x SSC and 0.01% SDS at 55°C.
PAX3-FKHR (10). An additional 9-20% of ARMS tumors have a variant t(l;13)(p36;ql4) translocation involving the PAX7 and FKHR (11). Thus, in contrast to carcinomas, which may fall into multiple genetic classifications, these tumors can be clearly grouped together Received 8/7/98: accepted 10/1/98. The costs of publication of this article were defrayed in part by the payment of page charges. This article must therefore be hereby marked advertisement in accordance with 18 U.S.C. Section 1734 solely to indicate this fact. 1 Present address: Beecher Instruments, Silver Spring. MD 20910. 2 To whom requests for reprints should be addressed, at National Human Genome Re search Institute/NIH, Building 49, Room 4A10, 49 Convent Drive, Bethesda, MD 20892-4470. Phone: (301)402-2023; Fax: (301)402-2040: E-mail:
[email protected]. 3 The abbreviation used is: ARMS, alveolar rhabdomyosarcoma.
Imaging. Fluorescence intensities at the immobilized targets were meas ured using a custom-designed laser confocal microscope with a scanning stage (90 cm/s), appropriate excitation and emission filters, and a photomultiplier tube detector. Intensity data were integrated over 400-/itrr pixels and recorded at 16 bits. The two fluorescent images (Cy3 and Cy5) were scanned separately from a confocal microscope, and color images were formed by arbitrarily assigning tumor intensity values into the red channel and control intensity into the green channel. Image Analysis. Immobilized DNA targets were localized by overlaying a grid on both fluorescent images. A segmentation method was then used to determine the actual target region based on the information from both red and green pixel values. The probe fluorescent intensity was then calculated by averaging the intensities of every pixel inside the detected target region. The
5009
Downloaded from cancerres.aacrjournals.org on July 13, 2011 Copyright © 1998 American Association for Cancer Research
GENE EXPRESSION
PROFILING
WITH CDNA MICROARRAYS
with the remainder being derived from a variety of functions including 88 housekeeping genes (a complete listing is available on the Inter diagnosis"ARMSARMSARMSARMSARMSARMSARMSSARCNBEwing's net4). Seven ARMS cell lines known to contain the translocation
Table 1 Cell line chamcterialics PAX3-FKHRARMS1 Cell line
+RH3 +RH4 +RH5 +RH18 +RMS +RH2813 +A204NGP127TC7IUACC-903PC3MDA-MB-436Histological sarcomaMelanomaProstate cancerBreast cancerSource*23333431567g1 "SARC, undifferenlialed sarcoma; NB. neuroblastoma. '' Original sources of cell lines were: 1. American Type Culture Collection; 2, Dr. L. Helnian (National Cancer Institute); 3, Dr. D. Shapiro (St. Jude's Children's Research Hospital); 4. Dr. A. T. Look (St. Jude's Children's Research Hospital; 5. Dr. G. Brodeur (Children's Hospital of Philadelphia); 6. Dr. M. Tsokos (National Cancer Institute); 7. University of Ari/.ona Cancer Center; 8. University of Utah.
final reported probe intensity was the difference between average probe intensity and average local background intensity. The ratios of the red intensity to the green intensity for all targets were determined. Normalization for differential efficiencies of labeling and detection was performed, based on 88 preselected internal control genes that are stable in most experiments (red/ green intensity ratio close to 1.0). The normalization constant from 88 internal control genes was then used to calculate the calibrated ratio for every cDNA spot within the image. Furthermore, the ratio variation of the 88 preselected internal control genes determined the confidence interval in which ratios are to be considered no difference from 1.0. The 99% confidence interval was used throughout the experiments to test the significance of differentially expressed genes (14). Additional information on the image analysis as well as the raw data including the hybridi/.ation images for each cell line is available on the Internet.4 Statistical Analysis. For this analysis, we used a filter that included all genes exhibiting a minimum level of expression of intensity of >2,000 fluorescent units (on a scale of 0-65,535 fluorescent units) for both red and green channels for each pair of experiments. We used the method of multidi mensional scaling to represent the relationships among cell lines in terms of the position of the cell lines in a two-dimensional Euclidean space. The positions of the cell lines in the Euclidean space are determined in such a way that the Euclidean distances between cell lines corresponds as closely as possible to 1 minus the Pearson correlation coefficients between the logarithm of intensity ratios for the cell lines. The correspondence between the distances between cell lines in the two-dimensional multidimensional scaling and the 1 minus corre lation values is not exact, however, because the former is a two-dimensional approximation to relationships in a higher-dimensional space. Comparison between proximities in the two-dimensional representation and the correlations shown on the scatterplots indicates that the correspondence is good. We also developed a three-dimensional multidimensional scaling representation but found that it was not an improvement over the two-dimensional representation. The multidimensional scaling was performed using the SAS statistical package with default parameter values. We also performed a hierarchical clustering of the 13 cell lines to explore the relationships among them. The dissimilarity measure used was the same as for multidimensional scaling. The average linkage hierarchical clustering method was used. The resulting dendrogram indicated the order in which cell lines were combined to form clusters. At one end of the dendrogram, there were 13 singleton clusters, and at the other end, there was a single cluster containing all 13 cell lines.
Results The microarruy used for our experiments consisted of 1238 cDNA clones selected from the UniGene set (15). It included 616 genes known to play important roles in cancer biology and the cell cycle, 4 http://www.nhgri.nih.gov/DIR/LCG/15K/HTML/.
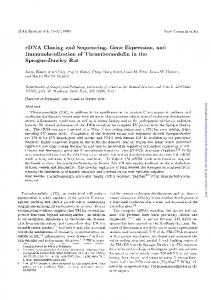
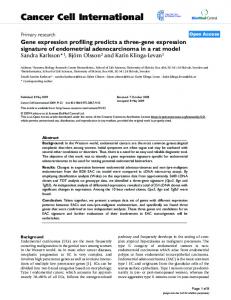
t(2;13)(q35;ql4) and express the PAX3-FKHR fusion gene were used to generate cDNA probes for microarray hybridizations. For comparison, the expression profiles of six unrelated cancer cell lines were also determined (see Table 1). In all experiments, tumor cell RNA was compared with a reference probe isolated from a diploid fetal myofibroblast cell line. After image processing (Fig. 1), the expression ratio dataset (tumor intensity/reference intensity) for each of the 13 hybridizations was entered into a database (Sybase) for analysis (16). RMS 13 was selected as a standard of comparison, and the increas ing divergence of the gene expression pattern in these cell lines could be displayed as series of scatterplots (Fig. 2/4). The similarity in gene expression pattern was visualized by the tendency of points to fall near the diagonal, as measured by the Pearson correlation coefficient. We used the Pearson correlation coefficients (see Table 2 for com plete matrix) to perform a multidimensional scaling analysis, which represents the relationships among all cell lines in terms of their position in two-dimensional Euclidean space (Fig. IB). The coordi nates were plotted such that the distances between points reflect the Pearson correlations of the logarithms of expression ratios between the cell lines. This analysis, which included all genes exhibiting a minimum level of expression in each hybridization, placed the nonARMS tumors at the periphery of the plot, with the ARMS tumors falling in a defined cluster. This result could also be displayed as a hierarchical clustering dendrogram inferred from the multidimen sional scaling analysis, which indicates the order in which cell lines were combined to form clusters (Fig. 2C). This analysis placed the ARMS in a distinct cluster, with the Ewing's sarcoma TC71 being the most closely related non-ARMS tumor. We performed a statistical significance test of the null hypothesis that the average Pearson correlations among the ARMS is no greater than would be expected if the seven ARMS lines were randomly selected from all 13 cell lines. There were 1716 ways of partitioning 13 cell lines into two sets, with one of size 7 and one of size 6. We found that none of the 1716 partitions gave average correlation values larger than obtained in the actual data for the seven ARMS cell lines. Therefore, the statistical significance value for the null hypothesis was 1/1716, or 0.0006. We can conclude, therefore, that the correlations among the ARMS cell lines is greater than the correlations between the ARMS cell lines and the other cell lines. To identify the genes which were expressed in common among ARMS cell lines, we searched the expression database for genes that were highly expressed in four or more ARMS relative to the reference probe. We found 37 genes that were highly expressed compared with the reference cell line in four or more of the of the seven ARMS. These were ranked according to the number of ARMS samples in which each gene was highly expressed (Fig. 3). Eight of these genes were overexpressed in all seven rhabdomyosarcomas, including ADPRT, TOP2A, MYBL2, MADP2, STAT5A, FKHR, MYCL1, and ATF3. Only 3 of the 37 genes [PAX3-FKHR (17), MYCN (18, 19), and CDK4 (20)] have been described previously to be overexpressed in ARMS (the FKHR target spot is comprised of the 3' end of this gene and will, therefore, detect expression of both the FKHR gene and the PAX3FKHR gene). Several of the remaining 34 genes, e.g., MYCLl (21), MYBL2 (22), CDC2 (23), and PCNA (24), have been reported as overexpressed in other cancers. Although some of these genes are expressed at high levels in a subset of the non-ARMS tumors, inspec tion of Fig. 3 suggests that the pattern of gene expression in ARMS is quite distinct from the non-ARMS tumors.
5010
Downloaded from cancerres.aacrjournals.org on July 13, 2011 Copyright © 1998 American Association for Cancer Research
GENE EXPRESSION
PROFILINO
WITH CDNA MICROARRAYS
•¿Â»â€¢Â«don» JO
8
•¿ »
l 9 •¿ 9 9 •¿
•¿
»•¿ o •¿ > . •¿ 4 •¿ a a j»a a •¿ •¿Â¿A.
Fig. 1. Representative microarray hybridization. This pseudocolored image represents a portion of a microarray with the reference probe (NIL.C) in green and tumor (RMS 13) in red. The up- (red) and down- (green) regulation of several genes are illus trated. D. representative genes of interest: A, FKHR: B, MYCN; C, CDK4; D, MYBL2; and E, NCFR. Ratio data for each of these individual spots were calculated and used for further analysis.
J .
99>9»999* •¿ »
CJLP 9*9 J I 9TT»
9
9
9
»
:. 9 e 9 9 3 •¿ 9
9 9 9 •¿ ? J> ' »9 99 B » O 9 9 •¿â€¢ 99999 9 9 9 » 9 9 ? I99.0999UP99
•¿ o« i •¿ e »•s a •¿ •¿ •¿ -
99
9 i- 9 9 9 9 . 9 »99 «O --99 9 99999
Discussion
though the microarrays used in this study contain only a small sample of the genome, evidence of a pattern common to ARMS is clearly apparent. Genes within this pattern may fall into several overlapping categories. Some genes may relate to the differentiation state of the
Tumors are currently classified by cell of origin, morphology, protein expression, and biological behavior. In principle, these prop erties are ultimately specified by a pattern of gene expression. Al
RH4
RH5
RH3
RH28
RH18
TC71
PC3
MDA-MB-436
UACC-903
NGP127
ARMS!
RMS13
RMS13
B
Hierarchical Clustering Dendogram
Multidimensional Scaling Analysis
0.5-
A204
NGP127
A204
0.3RH3 x
0.1HH4 x MDA-M8436 •¿
RH28 * RH5 X
ARMS1 x X
RMS13
-0.1RH18 x
PC3
TC71
•¿0.3UACC-903
-0.5 •¿0.5
-0.3
-0.1
0.1
0.3
Fig. 2. Statistical analysis of all genes on array filtered for green and red intensities of 22000 fluorescence units. A, 12 representational scatterplots of RMS13 versus the 6 other ARMS and 6 non-ARMS cell lines. Each scatterplot shows the values of the log,,, (tumor/control) ratios values filtered for intensities of >2000 fluorescence units for both control (^rci-n) and tumor (red) channels for each pair of experiments. The Pearson rank correlation coefficient of each pair is indicated. B, positions of the cell lines in two-dimensional Euclidean distances were determined using the method of multidimensional scaling to make the distance between cell lines correspond as closely as possible to 1 minus the Pearson correlation coefficient of the log ratio values. The X and Y scales were arbitrary. Cell lines falling close to one another in the plot had high correlation values. Using this method, we found that the ARMS cell lines (red] cluster together and the non-ARMS tumors (black) fall at the periphery of the plot. C, the hierarchical clustering dendrogram indicates the order in which the 13 cell lines were combined to form clusters. The calculation of the dendrogram uses 1 minus Pearson correlation coefficient of log ratios as the dissimilarity measure. The scale represents the distance between merged clusters, and cell lines that were most similar were combined first. Using this method, we found that the seven ARMS cell lines (red) again cluster together.
5011
Downloaded from cancerres.aacrjournals.org on July 13, 2011 Copyright © 1998 American Association for Cancer Research
GENE EXPRESSION
PROFILINO
WITH CDNA MICROARRAYS
Table 2 Matrix of Pearson correlation
ARMS1
RH3 ; RH4 0.547 0.726RH3 ' 0.606
coefficients
RH5
1 0.759 0.736RH4 | 0.771RH5RMS130.6830.690.7780.769RMS13RH180.6340.6060.6720.6670.731RH18RH280.6150.8070.740.7510.7460.703RH28A2040.3070.4440.4
UACC-903
0.507
MDA-MB-436
0.538
| 0.662 PC3
tumor progenitor. For example, MYL4 (myosin light chain 4) can be related to the derivation of ARMS from skeletal muscle. Other genes, such as FKHR, may be related to genetic aberrations which contribute to tumor progression. Many genes that contribute to the pattern are
related to cellular proliferation. It is remarkable that expression of genes such as TOPO2A and POLE, which are not usually thought of as tumor specific, contributed to the overall pattern which we ob served. Thus, even in tumor cells, in which random fluctuations in
Intensity Ratio NON-ARMS ARMS
Genes
Fig. 3. Genes overexpressed in ARMS. Thirtyseven genes that were highly expressed relative to the referenee probe in at least four of seven ARMS and their functions arc listed in thefirsi and second columns. The third column indicates the number of ARMS cell lines in which each gene is up-regu lated, compared with the control at a level greater than the 99% confidence interval, and the fourth column provides Ihe UniGene cluster designation. The expression ratios from each cell line are colorcoded: reu. overexprcssion; green, reduced expres sion in the tumor compared with the control cell line. When the ratios of expression exceed the 99% confidence interval, the saturation of red or green increases in proportion to the ratio. A ratio color scale is shown at the hortotn. The numerical data and the hyhridi/ation images for each cell line are available on the Internet.4
Name
Function
UniGene
ADPRT TOPO2A MYBL2 MAOP2 STAT5A FKHR MYCL1 ATF3 NGFR POLE MYCN TCF3 MYL4 CTSH ASS LAP18 COK4 IGFBP2
DNA repair DNA metabolism Transcription factor Mltotlc spindle Transcription factor Transcription factor Transcription factor Transcription factor Growth factor receptor DNA synthesis/repair Transcription factor Transcription (actor Structural muscle protein Proteolytlc enzyme
Hs.76105 Hs.3378
PCNA DHFR POU2F1 SNRPB KAI1 EST(R51658) H2AZ ALPL PKCSL CAS FEN1 HOX1C MSH2 TAF2A CDC2 RECA TRAP1 AACT LAMR1
Urea cycle enzyme Signal transductlon Call Cycle Growth factor binding DNA replication Folate metabolism Transcription factor RNA processing Unknown Unknown Chromatln ctructura Enzyme Signal transductlon Microtubule associated DNA repair Transcription tactor DNA Repair Transcription factor Cell cycle klnase DNA repair Unknown Chymotrypaln Inhibitor Membrane receptor
No. of ARMS
Hs.74605 Hs.79078 Hs.2287 Hs.175 Hs.92137 Hs.460 Ha. 1827 Hs.18366 Hs.25960 Hs. 101047 Hs.108485 Hs.76476 Hs.76753 Hs.81915 Hs.95577 Hs.162 Hs.78996 Hs.83765 Hs.74095 Hs.83753 Hs.103458 Hs.119192 Hs.117854 Hs.75061 Hs.90073 Hs.4756 HS.37034 Hs.78934 Hs.60679 Hs.58393 Hs.1608 Hs.2204 Hs.74493 Hs.75901
4 4 4 4 4 4 4 4 4 4 4 4 4 0.2
5012
Downloaded from cancerres.aacrjournals.org on July 13, 2011 Copyright © 1998 American Association for Cancer Research
GENE EXPRESSION
PROFILING
gene expression are expected, it was still possible to discern patterns in the particular constellation of genes expressed and their quantitative level of expression. This finding emphasizes the use of expression profiling as a means to determine the relatedness of tumors. Although this panel of ARMS cells all share a common genetic alteration, they have evolved independently and would be expected to have some divergence in their pattern of gene expression. Of the multiple sources of variation that might be postulated, one of the more interesting would be secondary genetic aberrations acquired during tumor evolution. For example, in this series, CDK4 was highly ex pressed in five of seven ARMS. Amplification of the CDK4 gene is an important secondary event in ARMS, and the highest level of expres sion was observed in RMS 13, which has CDK4 gene amplification. NGP127, the only non-ARMS tumor that expressed comparable levels of CDK4, is also known to have genomic CDK4 (25) amplification. In addition to the recognition of genomic alterations associated with tumor progression, with the implementation of larger arrays, the genes that are regulated by the PAX3-FKHR transcription factor may be revealed by microarray analysis. Other techniques, such as serial analysis of gene expression, have the potential to generate genome-scale expression profiles for tumors; however, human cDNA microarrays have the particular advantage that they are readily amenable to the analysis of multiple samples, thereby generating a large amount of gene expression data for statis tical analysis. Our current data are insufficient to establish a diagnos tic application of microarrays, but they do suggest that this may be a real possibility. Because of the inherent flexibility of robotic array printing, the potential to generate numerous copies of small subarrays containing the candidate genes of interest previously identified by screening with microarrays of thousands of genes exists. Easily printed small arrays of a few hundred genes could then be applied to multiple tumor samples. This possibility will facilitate the transition of microarray technology from cell culture to clinical correlative studies, which require large sample sizes to achieve statistical significance. Expression analysis with microarrays appears likely to provide im portant clues to the biological and clinical behavior of cancers through the identification of useful biomarkers and disease-specific targets for cancer therapy. Acknowledgments We thank John Lueders, Lao Saal, Kim A. Gayton, and Robert L. Walker for their excellent technical assistance on this work and Darryl Leja for the illustrations.
References 1. DeRisi. !.. Penland. L.. Brown. P. O.. Bittner, M. L.. Meltzer. P. S.. Ray. M.. Chen, Y.. Su. Y. A., and Trent. J. M. Use of a cDNA microarray to analyse gene expression patterns in human cancer. Nat. Genet., 14: 457-460. 1996. 2. DeRisi. J. L.. Iyer, V. R.. and Brown. P. O. Exploring the metabolic and genetic control of gene expression on a genomic scale. Science (Washington DC), 278: 680-686. 1997. 3. Heller. R. A., Schena, M., Chai. A.. Shalon. D.. Bedilion. T., Gilmore. J., Woolley. D. E., and Davis. R. W. Discovery and analysis of inflammatory disease-related genes using cDNA microarrays. Proc. Nati. Acad. Sci. USA, 94: 2150-2155, 1997. 4. Schena, M., Shalon, D., Davis, R. W.. and Brown, P. O. Quantitative monitoring of gene expression patterns with a complementary DNA microarray. Science (Wash ington DC). 270: 467-470. 1995. 5. Schena. M.. Shalon. D., Heller, R., Chai, A., Brown. P. O., and Davis. R. W. Parallel human genome analysis: microarray-based expression monitoring of 1000 genes. Proc. Nati. Acad. Sci. USA. 93: 10614-10619, 1996.
WITH CDNA MICROARRAYS
6. Shalon, D.. Smith. S. J.. and Brown. P. O. A DNA microarray system for analyzing complex DNA samples using two-color fluorescent probe hybridization. Genome Res., 6: 639-645, 1996. 7. Douglass, E. C., Valentine. M.. Etcubanas. E.. Parham. D.. Webber. B. L.. Houghton. P. J., Houghton, J. A., and Green, A. A. A specific chromosomal abnormality in rhabdomyosarcoma. Cytogenet. Cell Genet., 45: 148-155. 1987. 8. Turc-Carel, C.. Lizard-Nacol. S., Justrabo. E.. Favrot. M.. Philip. T.. and Tabone. E. Consistent chromosomal translocation in alveolar rhabdomyosarcoma. Cancer Genel. Cytogenet., 19: 361-362, 1986. 9. Whang-Peng, J., Triche, T. J.. Knulsen, T.. Miser. J.. Kao-Shan. S.. Tsai. S., and Israel, M. A. Cytogenetic characterization of selected small round cell tumors of childhood. Cancer Genet. Cytogenet., 21: 185-208. 1986. 10. Fredericks, W. J.. Calili. N., Mukhopadhyay. S.. Rovera, G.. Bennicelli, J.. Barr, F. G.. and Rauscher, Jr., F. The PAX3-FKHR fusion protein created by the t(2;13) translocation in alveolar rhabdomyosarcomas is a more potent transcriptional activa tor than PAX3. Mol. Cell. Biol.. 15: 1522-1535. 1995. 11. Douglass, E. C., Rowe. S. T.. Valentine. M.. Parham. D. M.. Berkow. R.. Bowman. W. P.. and Maurer, H. M. Variant translocations of chromosome 13 in alveolar rhabdomyosarcoma. Genes Chromosomes Cancer, 3: 480-482, 1991. 12. Pappo. A. S.. Shapiro. D. N.. Crist, W. M.. and Maurer, H. M. Biology and therapy of pediatrie rhabdomyosarcoma. J. Clin. Oncol.. 13: 2123-2139. 1995. 13. Wexler. L. H., and Helman. L. J. Rhabdomyosarcoma and undifferentiated sarcomas. In: P. A. Pizzo and D. G. Poplak (eds.). Principles and Practice of Pediatrie Oncology, pp. 799-829. Philadelphia: Lippincott-Raven. 1997. 14. Chen. Y.. Dougherty. E. R.. and Bittner. M. L. Ratio-based decisions and the quantitative analysis of cDNA microarray images. Biomed. Optics. 2: 364-374, 1997. 15. Schuler. G. D.. Boguski, M. S., Siewart, E. A.. Stein. L. D.. Gyapay. G., Rice. K.. White, R. E.. Rodriguez-Tome, P.. Aggarwal, A.. Bajorek, E., Bentolila, S.. Birren. B. B., Butler, A., Castle, A. B., Chiannilkulchai. N., Chu, A., Clee, C., Cowles. S., Day, P. J.. Dibling. T.. Drouot, N.. Dunham. I.. Dupral. S.. East, C., Edwards, C., Fan, J-B., Fang, N., Fizames, C.. Garrett, C.. Green. D.. Hadley. D.. Harris. M.. Harrison. P., Brady, S., Hicks. A.. Holloway. E., Hui. L.. Hussain. C.. Louis-Dit-Sully. C., Ma. J.. MacGilvery, A.. Mader. C.. Maratukulam. A., Mati.se. T. C.. McKusick, K. B., Morissette. J., Mungali. A.. Muselet. D.. Nusbaum. H. C., Page. D. C., Peck. A., Perkins. S., Piercy. M.. Qin. F.. Quackenbush. J., Ranby, S.. Reif. T.. Rozen, S., Sanders, C., She, X.. Silva. J., Slonim. D. K., Soderlund. C.. Sun. W-L.. Tabar. P.. Thangarajah. T.. Vega-Czarny. N.. Vollrath, D.. Voyticky. S.. Wlilmer, T.. Wu. X., Adams, M. D., Auffray, C.. Walter. N. A. R.. Brandon. R.. Dehjia. A.. Goodfcllow. P. N.. Houlgatte, R.. Hudson, Jr.. J. R.. Ide, S. E.. lorio. K. R., Lee. W. Y.. Seki. N.. Nagase. T., Ishikawa. K.. Nomura. N.. Phillips, C., Polymeropoulos, M. H., Sandusky. M.. Schmitt. K.. Berry, R.. Swanson, K.. Torres, R., Venter. J. C.. Sikela, J. M., Beckmann. J. S., Weissenbach. J., Myers, R. M.. Cox, D. R.. James. M. R., Bentley, D., Deioukas. P.. Lander. E. S., and Hudson. T. J. A gene map of the human genome. Science (Washington DC). 274: 540-546, 1996. 16. Ermolaeva. O., Rastogi. M., Pruitt. K. D.. Schuler. G. D.. Bittner. M. L.. Chen. Y.. Simon. R.. Meltzer, P., Trent, J. M., and Boguski. M. S. Data management and analysis for gene expression arrays. Nat. Genet., 20: 19-23. 1998. 17. Davis, R. J.. and Barr. F. G. Fusion genes resulting from alternative chromosomal translocations are overexpressed by gene-specific mechanisms in alveolar rhabdomy osarcoma. Proc. Nati. Acad. Sci. USA. 94: 8047-8051, 1997. 18. Dias. P.. Kumar, P.. Marsden. H. B.. Gattamaneni. H. R.. Heighway. J.. and Kumar. S. N-mvr gene is amplified in alveolar rhabdomyosarcomas (RMS) but not in embryonal RMS. Int. J. Cancer, 45: 593-596. 1990. 19. Driman, D.. Thorner, P. S.. Greenberg. M. L.. Chilton-MacNcill. S.. and Squire. J. MYCN gene amplification in rhabdomyosarcoma. Cancer (Phila.), 73: 2231-2237, 1994. 20. Bemer, J. M., Forus, A.. Elkahloun, A., Meltzer. P. S., Fodstad. O.. and Myklebost. O. Separate amplified regions encompassing CDK4 and MDM2 in human sarcomas. Genes Chromosomes Cancer. 17: 254-259. 1996. 21. Nau, M. M.. Brooks. B. J.. Battey. J.. Sausville. E.. Gazdar. A. F.. Kirsch. I. R.. McBride. O. W.. Bertness, V., Hollis. G. F.. and Minna, J. D. L-myc. a new mvr-related gene amplified and expressed in human small cell lung cancer. Nature (Lond.). 318: 69-73. 1985. 22. Scarpa. S.. Negroni, A.. Amendola. R.. Signorelli, P.. Calabretta. B., Modesti. A., and Raschella, G. Phenotypic and morphological characterization of neuroblastoma cells constitutively expressing B-myb. J. Neurooncol.. 31: 107-114. 1997. 23. Keyomarsi, K.. and Pardee. A. B. Redundant cyclin overexpression and gene ampli fication in breast cancer cells. Proc. Nati. Acad. Sci. USA. 90: 1112-1116. 1993. 24. Verri, A., Verzeletti. S.. Mazzarello. P.. Spadari. S.. Negri. M.. Bunone. G.. Della Valle, G., Hubscher. U., and Pocher. F. DNA synthesis enzymes and proliferating cell nuclear antigen in normal and neoplastic nerve cells. Anticancer Res., 12: 10991105, 1992. 25. Elkahloun, A. G., Bittner, M.. Hoskins. K., Gemmili. R., and Meltzer. P. S. Molecular cytogenetic characterization and physical mapping of 12ql3-l5 amplification in human cancers. Genes Chromosomes Cancer, 17: 205-214. 1996.
5013
Downloaded from cancerres.aacrjournals.org on July 13, 2011 Copyright © 1998 American Association for Cancer Research