Adv. Geosci., 17, 55–61, 2008 www.adv-geosci.net/17/55/2008/ © Author(s) 2008. This work is distributed under the Creative Commons Attribution 3.0 License.
Advances in Geosciences
Cell-tracking with lightning data from LINET H. D. Betz1 , K. Schmidt1 , W. P. Oettinger2 , and B. Montag2 1 University 2 nowcast
of Munich, Department of Physics, 85748 Garching, Germany GmbH, 81377 Munich, Germany
Received: 15 January 2008 – Revised: 7 July 2008 – Accepted: 8 July 2008 – Published: 29 July 2008
Abstract. A new lightning detection network (LINET) has been developed at the University of Munich, which locates and reports both cloud discharges and cloud-to-ground strokes with high accuracy. The network started operation in May 2006; since then lightning data for Europe are being delivered to many scientific groups, and to the German Weather Service (DWD) on an operational basis (powered by nowcast GmbH, Germany). Using about 90 lightning sensors in 17 countries, an area from longitude 10◦ W–25◦ E to latitude 35◦ N–65◦ N is covered. Further expansion is in the planning stage with the aim to attain higher efficiency for Mediterranean storms. The total lightning capability, not readily available otherwise in large areas, is particularly helpful because it can provide useful information about the development of severe weather and strong storm cells. A celltracking module has been developed that allows the investigation of lightning parameters for specific convective cells. Present efforts are devoted to the question for what kind of storms and to what extent lightning-based cell tracking allows improved nowcasting. Numerous case studies have been carried out and typical examples will be presented.
1
Introduction
Lightning detection represents a meteorological data source, which – though available in many countries – is not generally exploited in an optimal manner. Many national weather services have access to lightning data, but its use remained limited although, for example, it could identify easily and early in time whether a radar cell signifies a thunderstorm. Besides, lightning data are available in real time and over large areas, often in regions without radar. Most promising is the combination of data from lightning with radar and other meteorological sources, especially in the context of nowcasting. In the latter case, the reporting of total lightning, i.e. both Correspondence to: H. D. Betz (
[email protected])
cloud discharges (IC) and ground strokes (CG), serves as an indicator and precursor for extreme storm conditions: when the flash rate, especially the IC fraction, rises steeply within a short time, strong updrafts sow the seeds aloft for severe weather producing hail, strong wind and heavy precipitation (Williams et al., 1999; Lang et al., 2004). Cell-tracking of storms by means of data from radar, satellite images, lightning, or microwave-based temperatures is well known and has often been described, but no general solution is readily available and interested groups have developed their own methods (Crane, 1979; Rosenfeld, 1987; Chen and Kavvas, 1992; Kamura et al., 1997; Finke and Jaeneke, 1998; Finke, 1999; Tuomi and Larjavaara, 2005). Apart from possible insufficiencies of the measured data, intricate problems arise due to short-lived cells, merging and separation of cells. The presently employed algorithm allows only a first approximation for nowcasting applications, but the evolution of lightning parameters within specific cells can be studied in great detail, namely in terms of stroke rate, stroke density, stroke polarity and amplitude, IC-CG relation, and cell velocity. Later on, IC emission heights will be added. One aim is to relate these parameters with the life cycle of the identified cell and possible hazards such as hail, strong winds, and heavy precipitation. Radar scans and other meteorological data sources will be considered in a subsequent stage of the ongoing research program.
2
Lightning Detection Network in Europe (LINET)
Lightning detection can be performed by means of quite different techniques, but in many countries fully automated networks are most common, which utilize a number of antennae for the measurement of electric and/or magnetic fields emitted during lightning discharges. The sensor data are transmitted to a central processor, where lightning locating is performed. Widespread are networks that use the VLF/LF range with sensor baselines of up to ∼400 km; they report dominantly CG return strokes. A few systems rely on the VHF range that allows identification of IC discharges, provided that the lightning occurs within the line-of-sight to a
Published by Copernicus Publications on behalf of the European Geosciences Union.
56
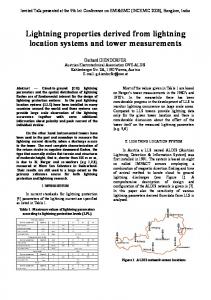
Fig. 1. Location of 90 sensor sites of the lightning detection network LINET, as of April 2008.
sensor group; consequently, these systems operate with relatively short baselines. LINET exploits the VLF/LF regime and combines the measurement of CG and IC strokes within a single technology, employing baselines of ∼200–250 km for an adequate coverage in the central parts of the network. Presently, in many border areas with the inclusion of the Mediterranean Sea the baselines are larger; consequently, the detection efficiency is reduced, i.e. weak IC and CG signals are not located. Nevertheless, data comparisons (see below) have revealed that LINET reports more events than other networks with comparable sensor geometry, probably because all incoming signals above the noise level are analysed, irrespective of pulse shapes. Figure 1 shows the sensor locations as of April 2008, and Fig. 2 gives an example for lightning location during the day of 26 May 2007. Due to the size of the network, storm cells can be identified and traced over long distances, usually during the full lifetime of the cells. LINET detects and locates CG and IC strokes with the same procedure (Betz et al., 2004, 2007), providing an advantage with respect to IC reporting. According to the established state-of-art, cloud flashes are identified by means of VHF systems, which are sensitive to negative stepped leader channels that develop after initial breakdown processes. The VHF signal-amplitude propagates with distance D along line-of-sight according to 1/D2 . By comparison, the IC strokes measured in the VLF/LF band propagate first as space wave, then like CG strokes as ground-wave and decay ∼1/D and, thus, allow longer ranges irrespective of obstacles along the path. It is also important to note that the distributions of signal strengths for IC and CG strokes overlap significantly. This is the reason why a large fraction of IC strokes can be detected Adv. Geosci., 17, 55–61, 2008
H. D. Betz et al.: Cell-tracking with lightning data
Fig. 2. Lightning map for the storm day on 26 May 2007, with 721 330 located lightning strokes. In the display, CG and IC strokes are not discriminated.
by a network with relatively long baselines. Then, of course, extremely small signals mostly indicative of IC discharges get easily lost. In order to investigate the total lightning capability of LINET for different baselines, comparisons with VHF-systems in four European countries have been carried out (Benelux, Germany, Poland, Hungary). It turned out that LINET reports at least as many lightning events, at least when the located radio source points from one and the same lightning channel are counted as a single lightning discharge (Betz et al. 2008). IC strokes can be discriminated against CG strokes with the LINET algorithm only when the lightning occurs within ∼120 km from the nearest sensor; otherwise, the TOA differences required become too small to allow reliable distinction. Locating of strokes, whether IC or CG, remains still possible as long as at least four sensors report, irrespective of their distances from the flash. For this reason, the following evaluations are performed with storms that occurred in the central parts of the network where the network geometry allows good IC identification.
3
Cell tracking
Since LINET reports copious amounts of weak lightning strokes the total number of located events becomes sufficiently large so that even for relatively modest storms distinct cells show up within short time intervals, giving the possibility for grouping. Cell tracking has often been described in the literature and many sophisticated solutions are utilized. The present contribution does not focus on particular features of www.adv-geosci.net/17/55/2008/
H. D. Betz et al.: Cell-tracking with lightning data
57
Fig. 3. Storm on 19 July 2007. Several storm cells are well identified: 15:00–15:10 (left); 15:30–15:40 (right). The blue line tracks the centre of the cells. The black arrows estimate the position of the cell expected one hour later.
cell tracking algorithm, but uses a quite simple procedure developed by the Munich research team. The employed method for cell tracking searches for event clusters and defines the border of a cell by means of the stroke density. A cell is suspected when the number of strokes per area surpasses a set minimum, and likewise the border is recognized when the absolute stroke number falls below this minimum. For each recognised cell area, a polygon is drawn which serves to guide the eye, though convex and concave structure are not yet well reproduced. More important, the basic grid areas (corresponding to radar pixels of 1×1 km2 ) are either allocated to a cell or declared as lying outside a cell.
“jumps” of cell parameters that are not realistic. Also, when two different cells come too close to each other without really merging, differentiation becomes problematic. Clearly, shortcomings still exist and some refinements are needed and several attempts to find more stable solutions are under way. Nevertheless, first useful results can already be obtained on the development of individual cells. Since cell movement is often quite linear, nowcasting of cell positions within time spans of up to ∼2 h are within reach.
With this relatively crude procedure it becomes feasible to inspect all signals within the cell and to extract lightning parameters that are characteristic for the considered cell. The examples shown here use time bins of 10 min, though shorter periods can be chosen as well because the rate reaches 1000 strokes within a bin. When one time interval is treated for the entire network area, the subsequent time period is scanned without data overlap to the preceding bin. A continuously existing cell has to be found anew and it is related to its preceding image when location and expected speed are within selected limits. This approximate procedure works in most cases, but splitting and merging of cells often leads to
4.1
www.adv-geosci.net/17/55/2008/
4
Thunderstorm case studies 19 July 2007
Figure 3 shows a storm in southeast Germany, where several cells could be readily identified and traced; Figs. 3a and 3b depict the cells from 15:00–15:10 and 15:30–15:40, respectively. The most prominent cells carry the numbers #3, #8, and #31, assigned automatically by the code that handles the entire network area. Figures 4 to 6 display four lightning parameters: stroke rate, stroke density, cell speed, and cell area for the identified cells. These examples serve to demonstrate the available options, but are not yet intended to produce final results and complete assessments of storm details. Closer Adv. Geosci., 17, 55–61, 2008
58
H. D. Betz et al.: Cell-tracking with lightning data
Fig. 4. Stroke rate, stroke density, cell speed and cell area for cell #8 of the storm on 19 July 2007, as a function of time. The path of this cell is discernible in Fig. 3.
Fig. 5. Stroke rate, stroke density, cell speed and cell area for cell #8 of the storm on 19 July 2007, as a function of time. The path of this cell is discernible in Fig. 3.
Adv. Geosci., 17, 55–61, 2008
www.adv-geosci.net/17/55/2008/
H. D. Betz et al.: Cell-tracking with lightning data
59
Fig. 6. Stroke rate and stroke density for cell #31 of the storm on 19 July 2007, as a function of time.
Fig. 7a
Fig. 7b
Fig. 7. Storm on 20 July 2007. (a) prominent cells 13.50–14:00; (b) all cell tracks up to 22:10 UTC.
Fig. 8. Severe storm on 21 July 2007. For the two cells #29 and #61 four lightning parameters are shown: stroke rate, ratio IC/CG, cell area, and cell speed, as a function of time in UTC.
www.adv-geosci.net/17/55/2008/
Adv. Geosci., 17, 55–61, 2008
60
H. D. Betz et al.: Cell-tracking with lightning data 4.2
20 July 2007
This storm covered southern Germany and produced a very large number of short-lived cells, as well as numerous cells that lived over many hours. Figure 7a shows three prominent cells from 13:50–14:00. The two cells situated in the southern part have long tracks, yet in different directions. All tracks of the storm up to 22:10 are depicted in Fig. 7b. Whenever a cell lives sufficiently long, the lightning parameters can be determined as described above, and are already available in real time.
4.3
Fig. 9. Storm in northern Italy on 24 July 2007. The radar data from the station at Bozen is shown for the time interval 14:00–14:06, along with the corresponding lightning locations (circles).
On this day several severe storms developed that caused considerable verified damage due to hail, strong winds and heavy precipitation. Figures 8a–d show the stroke rate, the IC/CG ratio, area and speed of the two cells #29 and #51 that have caused a significant part of the adversary effects. Fast rise of the stroke rate and the IC/CG ratio of cell #29 around 18:00 closely coincide with the time of significant ground damage. Note that at this time the cell was relatively small and the absolute maximum of the stroke rate occurred much later. This case continues to be investigated further, because we still try to find additional and more precise reporting about the damages with respect to event time and location.
4.4
inspection reveals that the transitions of cells #3 and #21 into #31, and #1 into #33 are not yet modelled reliably, because close proximity, merging and dividing of cells often represent intricate situations that are not only technically problematic but also raise questions with respect to the definition of cell identity. Cell #3 is first identified around 13:00 and remains weak for about one hour; then it increases its intensity and reaches a maximum at 14:10; the IC rate rise above the CG rate. At 15:10 a second maximum is reached. The speed of the cell centre increases steadily to 80 km/h. The less intensive cell #8 is shown for the first 4 h of its lifetime; the stroke rate varies slowly, the IC rate shows no sudden changes, the cell area and speed increase somewhat. In all, cell #8 is far from producing severe weather. By contrast, cell #31 exhibits more marked parameter changes; especially the rate increase at 16:20 is real and not influenced by imperfect cell determinations. The German Weather Service reported damage, but the detailed correlation with the cells has not yet been investigated. Adv. Geosci., 17, 55–61, 2008
21 July 2007
24 July 2007
This case is briefly discussed in order to evaluate the wellknown correlation between lightning and radar. Figure 9 shows the Bolzano radar, along with the corresponding lightning from LINET, as a typical example from 14:00–14:06. Reflectivity above some 30 dBZ is associated with lightning, and values up to the scale 40–50 dBZ are reached. The figure demonstrates also that some lightning occurs outside the high-reflectivity areas, and vice versa. In particular, some strokes show up in areas with values well below 30 dBZ; an inspection of the lightning data revealed no suspicious errors so that the stroke locations are probably correct. A further question that can be raised concerns the time intervals to be selected for a comparison, and whether there is a relation between the degree of matching events from lightning and radar with the severity of the considered storm cell. Finally, behind high-reflectivity zones, in outer areas, and naturally beyond the radar range, lightning is still present and detected, but the radar data lacks efficiency. A more quantitative analysis is presently under way that uses the more sophisticated research radar (POLDIRAD of the Institute of Atmospheric Physics, DLR, Deutsche Luft- und Raumfahrt), applied to storms in the Munich area. www.adv-geosci.net/17/55/2008/
H. D. Betz et al.: Cell-tracking with lightning data 5
Conclusions
Lightning observation with LINET represents an additional data source that is often helpful for recognition, tracking and nowcasting of thunderstorms. Even when no other information is available, lightning allows to some extent real-time assessment of thunderstorms. Further improvement of the nowcasting power is possible by means of two tools, direct cell tracking and more refined modelling procedures with utilization of copious other data sources. As regards cell tracking with lightning data, simple extrapolation based on three or four consecutive time-intervals of, say, five or ten minute intervals often produces useful results, especially when cells are not too short-lived. More complete solutions are under development in order to better differentiate neighbouring cells. Improvements of this kind, along with inclusion of additional available real-time information, are expected to provide a certain improvement of nowcasting, suited for reliable practical applications. Acknowledgements. This work was partially supported by Deutsche Forschungsgemeinschaft (DFG) and Bundesministerium fr Bildung und Forschung (project RegioExAKT by BMBF). Edited by: A. Mugnai Reviewed by: one anonymous referee
References
61 Chen, Z.-Q. and Kavvas, M. L.: An Automated Method for Representing, Tracking and Forecasting Rain Fields of Severe Storms by Doppler Weather Radars, J. Hydrol., 132, 179–200, 1992. Crane, R. K.: Automatic Cell Detection and Tracking, IEEE T. Geosci. Electronics, GE-17, 250–261, 1979. Finke, U. and Jaeneke, M.: Kombinierte Verwendung von Radarund Blitzdaten zum Tracking und NowCasting von Gewittern, Ann. Met., 37, 7–8, 1998. Finke, U.: Space-time correlation of lightning distributions, Mon. Weather Rev., 127, 1850–1861, 1999. Kawamura, A., Jinno, K., and Berndtsson, R.: Real-Time Tracking of Convective Rainfall Properties Using a two-dimensional Advection-Diffusion Model, J. Hydrol., ISSN 0022-1694, 203, 109–118, 1997. Lang, T. J., Miller, L. J., Weisman, M., Rutledge, S. A., Barker, L. J., Bringi, V. N., Chandrasekar, V., Detwiler, A., Doesken, N., Helsdon, J., Knight, Ch., Krehbiel, P., Lyons, W. A., MacGorman, D., Rasmussen, E., Rison, W., Rust, W. D., and Thomas, R. J.: The Severe Thunderstorm Electrification and Precipitation Study, Am. Meteorol. Soc., doi:10.1175/BAMS-85-8-1107, 1107–1125, 2004. Rosenfeld, D.: Objective Method for Analysis and Tracking of Convective Cells as seen by Radar, J. Atmos. Ocean. Techn., 4, 422– 434, 1987. Tuomi, T. J. and Larjavaara, M.: Identification and analysis of flash cells in thunderstorms, Q. J. Roy. Meteorol. Soc., 131, 1191– 1214, 2005. Williams, E., Boldi, B., Matlin, A., Weber, M., Hodanish, S., Sharp, D., Goodman, S., Raghavan, R., and Buechler, D.: The behaviour of total lightning activity in severe Florida thunderstorms, Atmos. Res., 51, 245–265, 1999.
Betz, H.-D., Schmidt, K., Oettinger, P., and Wirz, M.: Lightning Detection with 3D-Discrimination of Intracloud and Cloudto-Ground Discharges, Geophys. Res. Lett., 31, L11108, doi:10.1029/2004GL019821, 2004. Betz, H.-D., Schmidt, K., Fuchs, B., Oettinger, W. P., and H¨oller, H.: Cloud Lightning: Detection and Utilization for Total Lightning measured in the VLF/LF Regime, J. Lightning Research, 2, 1–17, 2007. Betz, H.-D., Schmidt, K., Laroche, P., Blanchet, P., Oettinger, W. P., Defer, E., Dziewit, Z., and Konarski, J.: “LINET – An International Lightning Detection Network in Europe”, Atmos. Res., in print, 2008.
www.adv-geosci.net/17/55/2008/
Adv. Geosci., 17, 55–61, 2008