Ken Muller, and Ken Smith for their critical readings of the manuscript, ...... and Trujillo-Cenoz, 1975), the dragonfly (Mouze, 1978), and the cockroach (Stark and ...
The Journal of Neuroscience Vol. 4, No. 6, pp. 1486-1498 June 1984
0270.6474/84/0406-1486$02,00/O Copyright 0 Society for Neuroscience Printed in U.S.A.
CELLULAR INTERACTIONS AND PATTERN FORMATION IN THE VISUAL SYSTEM OF THE BRANCHIOPOD CRUSTACEAN, DAPHNIA
MAGNA
III. The Relationship Laminal M. S. FLASTER*
AND
* Center for Neurobiology
Between
Cell Birthdates
and Cell Fates in the Optic
E. R. MACAGNOS’ and Behavior, Columbia Sciences, Columbia Received
September
University, University,
New York, New York 10032 and $ Department New York, New York 10027
26, 1983; Accepted
December
of
Biological
12, 1983
Abstract The birthdates of nerve cells in the optic ganglion of the water flea Daphnia magna were determined using [“Hlthymidine autoradiography. The analysis was aided by computer-assisted three-dimensional reconstruction and correlated with serial electron microscopy of the developing visual system. Previous work has shown that the projection from eye to optic ganglion is retinotopic at the level of single cells (Macagno, E. R., V. LoPresti, and C. Levinthal (1973) Proc. Natl. Acad. Sci. U. S. A. 70: 433-437). Studies of both normal and perturbed development (LoPresti, V., E. R. Macagno, and C. Levinthal (1973) Proc. Natl. Acad. Sci. U. S. A. 70: 56-61; Macagno, E. R. (1978) Nature 275: 318-320) have suggested that retinotopy is a consequence of an invariant pattern of sequential growth and cellular interactions. We report here that the laminar cells, the first-order target cells of the visual projection, become postmitotic in an orderly fashion that correlates with their position and connectivity in the adult array. Furthermore, presumptive laminar cells complete their final division just prior to or during initial contact with the growing processes of the visual fibers with which they will form their mature retinotopic contacts. The correlation between times of final division of target cells and the arrival of visual fibers with which they interact provides further indirect evidence that sequential growth and cellular interactions are key factors in establishing normal connectivity in the visual system of arthropods.
Ordered patterns of cell proliferation are common features in the embryogenesis of neuronal structures. Well known examples of topographically organized patterns of nerve cell birthdates include the retina and optic ganglion (OG) of insects (Nordlander and Edwards, 1969b; Hofbauer and Campos-Ortega, 1976; Ready et al., 1976; Anderson, 1978; White and Kankel, 1978; Mouze, 1980; Stark and Mote, 1981), the segmental ganglia in both grasshopper (Bate, 1976) and leech-(Weisblat et al., 1980), the retina and tectum of birds and amphibians (Straznicky and Gaze, 1971, 1972; LaVail and Cowan, ‘We thank Ian Meinertzhagen, Ken Muller, and Ken Smith for their critical readings of the manuscript, Nicholas Necles for his assistance with the photography, and Stephen Sims and Arnaud Bastien for their help with grain counting and computer tracing. This research was supported in part by National Institutes of Health Grant NS-14946. * To whom correspondence should be addressed. 1486
1971), and the cerebral and cerebellar cortices (reviewed by Sidman and Rakic, 1973) as well as the spinal motor columns in mammals (reviewed by Hollyday, 1980). The patterns of neuronal birthdates observed in these various examples vary considerably in their geometry and in other respects. The relevance of these birthdate patterns to either local or distant circuit features of the adult structure is largely unknown. The structure and development of the projection from eye to OG in a single clone of the waterflea, Daphnia magna, has been described in detail previously (LoPresti et al., 1973; Macagno et al., 1973; Flaster et al., 1982). Briefly summarized, the visual system consists of a single, bilaterally symmetric compound eye composed of 22 fused-rhabdom ommatidia projecting via the optic nerve to an OG which contains two groups of neurons and a small number of glial cells. On the ganglion’s anterior surface are the cell bodies of the laminar neurons, the first-order cells of the ganglion. More posteriorly situated
The Journal
of
Neuroscience
Relationship
between
Cell Birthdates
are the cell bodies of the medullary neurons which are predominantly second- or higher-order interneurons. The eight photoreceptors of each ommatidium project their axons in a fascicle to the optic lamina where, together with five laminar cells, they form a unit structure,
the optic
cartridge.
There
are 22 optic
cartridges.
Each ommatidium projects exclusively to a single lami-
and Cell Fates
1487
nar cartridge in a retinotopic manner with the majority of photoreceptor-laminar cell synapses made between the members of a single cartridge. The structure of the visual system and the projection from compound eye to lamina are diagrammed in Figure 1. Serial
section
electron
microscopic
veloping visual system of Daphnia
studies of the dehave shown that the
MID v
LAMINA
b
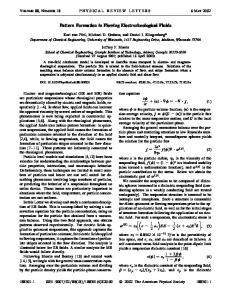
a Figure 1. a, Drawings of the adult visual system (top) and the developing visual system (bottom) viewed in the horizontal plane. The compound eye (CE) and optic ganglion (OG) are symmetric about the dorsoventral midplane (MID). The set of axes at right gives the anatomical directions for the right side of these structures (A, anterior; P, posterior; D, dorsal; V, ventral; M, medial; L, lateral). In the drawing of the adult eye, a number of lenses and two photoreceptors are depicted. The photoreceptor axons (PA) project to the optic lamina (LAM). Laminar neuron cell bodies, represented by small circles, are located at the anterior surface of the optic ganglion; the processes of laminar cells are not drawn in. The location of the neuropil, composed of optic cartridges, is indicated by the arborizations of the two photoreceptor axon bundles. Posterior to the lamina is the medulla (MED). In the drawing of the developing visual system, two photoreceptors from neighboring ommatidia are depicted in the compound eye primordium (CEP). The photoreceptor axons from the more lateral ommatidium have already reached the optic ganglion primordium (OGP) and recruited presumptive laminar neurons into a nascent cartridge (b). The lead axon of the more medial ommatidium has just entered the optic ganglion primordium at its anteromedial surface and has not yet interacted with presumptive laminar neurons. Unrecruited, undifferentiated cells are located at the midplane (a). b, Schematic drawings of the compound eye (top) and optic lamina (bottom), showing the location of the individual ommatidia and the optic cartridges to which the photoreceptors of each ommatidium project. Both compound eye and lamina are viewed in transverse projection, dorsal surface up. Each lettered rectangle in the eye represents an ommatidium while each similarly lettered circle in the optic lamina represents the corresponding optic cartridge. This lettering scheme is used to name individual ommatidia and optic cartridges. These arrays are invariant at this level of structure. The circles on the midplane of the eye (top) represent two groups of glial processes which serve to identify the B ommatidia.
1488
Flaster and Macagno
Vol. 4, No. 6, June 1984
ommatidia mature in an orderly, lateral-to-medial se- pressure of 40 psi. For birthdating, the injection solutions quence (see Fig. la, lower diagram). Within each om- consisted of [methyl-6-“Hlthymidine, 40 to 60 Ci/mmol matidium, the axons of the photoreceptors grow as a (New England Nuclear or Amersham) at a radiochemical fascicle composed of a leading fiber with an enlarged concentration of 2.5 mCi/ml in Duphnia physiological growth cone and seven followers with smaller growth saline. Methylene blue (final concentration 0.5%) was cones. Each lead fiber grows along a midline glial palisade added to make injections visible. Embryos were held for which bridges a narrow extracellular sinus, enters the injection by placing them in small drops of water on wet primordial lamina, and interacts sequentially with five tissue paper mounted on glass slides. The micropipette presumptive laminar cells. The laminar cells wrap was guided by means of a Leitz micromanipulator and around the lead fiber and, shortly thereafter, each cell was inserted into the dorsoposterior, predominantly generates a neurite which joins the fascicle of optic axons. yolky region of the embryos. The injections were perThe interaction between lead fiber and laminar cell, formed under a compound microscope equipped with a culminating in its differentiation as a member of that rotating stage to facilitate orientation of the embryos. In cartridge, we have called recruitment. The first optic birthdating experiments, each embryo received a single cartridges formed come to be situated laterally in the injection. The injection was made at one of a number of lamina; the last cartridges to form are situated medially developmental stages during the middle third of embry(see Fig. la, lower panel). The ingrowth of the projection ogenesis (23 to 43 hr of development). The injected from eye to lamina and the formation of nascent car- animals were fixed 4 to 5 days later, well into the juvenile tridges is completed in about 10 hr (at 22°C) during the instars. Some specimens were fixed shortly after the middle third of embryogenesis. Studies using a UV mi- introduction of label. All animals were fixed and emcrobeam to delete photoreceptors or to delay the arrival bedded in Epon-Araldite as previously described (Maof optic axons into the laminar primordium have dem- cagno et al., 1973). For autoradiographic analysis, specionstrated that embryonic laminar cells are dependent mens were sectioned serially at 1 pm in the case of upon interactions with optic axons for their survival and juveniles and 0.5 pm in the case of embryos. The sections differentiation (Macagno, 1979, 1981). When a few pho- were dried on glass slides, dipped in Kodak NTB-3 toreceptor axons are caused to arrive a few hours late, emulsion (2 parts emulsion:1 part distilled water), and the laminar cells with which they interact show a corre- exposed at 4°C for 14 to 16 days for l-pm sections and sponding delay in their own development, indicating that for 25 days for 0.5-/*rn sections. The emulsions were differentiation of laminar neurons is triggered by an developed with Kodak D-19 and fixed, using the manuinteraction between optic axons and presumptive lami- facturer’s recommended protocol. The sections were then nar cells. stained through the emulsion with 1% toluidine blue, In this study we ask: when do presumptive laminar followed by a brief destaining in a dilute aqueous solution neurons become postmitotic? Is there an orderly arrange- of acetic acid and ethanol. Serial section autoradiographs ment of laminar cell birthdates with respect to the car- were photographed with an oil immersion lens on a Zeiss tridges to which these cells come to belong? Finally, what photomicroscope. The resulting negatives were succesis the temporal relation between the production of lam- sively aligned and photographed to produce filmstrips inar cells and their interaction with incoming optic ax- suitable for computer-assisted three-dimensional reconons? struction using the CARTOS system (Macagno et al., 1979). For laminar neurons, laminar glial cells, and medullary neurons, the positions of their nuclei were reMaterials and Methods corded, and the number of silver grains over each nucleus Embryos used in these experiments were all taken was counted. A set of computer programs was written from a single clone of Daphnia cultured under standard which would then count the number of cells traced, conditions at 22.5 + 1°C (Macagno et al., 1973). Embrygenerate histograms of the distribution of cells as a onic age was established by time elapsed after the extrufunction of normalized grain counts, and, on graphics sion of eggs from the ovaries into the dorsal brood pouch. devices, display cells in groupings determined by their Embryos were removed from the brood pouch between label intensity (histogram classes). 22 and 24 hr after extrusion. They were maintained in a Analysis of either control series (embryos which did culture medium containing penicillin and streptomycin not receive [3H]thymidine injection) or nonlabeled areas (Murphy, 1970) until the onset of sustained swimming, from thymidine-injected specimens showed equivalent at about 60 hr of age, at which time the animals were grain densities, two to three orders of magnitude below transferred to normal culture medium. By 60 hr, develgrain densities over labeled cell bodies. opment is essentially complete. For correlated electron microscopy, embryos of the For microinjection, embryos were transferred to physsame age as those injected for autoradiographic study iological saline immediately before injection and were were fixed, stained en bloc with uranyl acetate, and returned to Murphy’s medium 4 to 6 hr later. Pressureembedded in Epon. These specimens were serially thin driven microinjections were accomplished through glass sectioned (at thicknesses showing silver to gold interfermicropipettes with 2- to 2.5pm tip diameters using a ence colors), and every third or fourth section was phodevice capable of brief pressure pulses (McCaman et al., tographed at x 1,000 magnification on a Zeiss EM-9 1977). The output of the pipettes was estimated by electron microscope. The numbers of optic fiber bundles measuring the amount of radiolabel ejected into water reaching the optic laminar primordium were counted by test pipettes. Roughly 100 pl of solution were delivered directly from serial prints. Other aspects of the embryinto each embryo using pulses of 50 msec duration at a onic lamina were also examined using these same serial
The Journal
of
Neuroscience
Relationship between Cell Birthdates and Cell Fates
prints and prints of up to X 50,000 magnification where necessary.
1489
the midline, and come to be displaced laterally as their cartridge matures. The birthdates of laminar cells determined by autoradiographic analysis in the mature lamina. An analysis of Results the birthdates of laminar cells with respect to position The pattern of [“Hlthymidine labeling seen in embryos. in the mature lamina can be obtained by injecting [“HI Embryos from a single brood were injected with [“HI thymidine at a series of times during development and thymidine at 34.5 hr in development, fixed after an determining the distribution of labeled cells 4 to 5 days interval of either 1.5 or 4 hr (at 36 and 38.5 hr, respec- later, when the visual system is mature. tively), processed for serial section autoradiography, and When embryos are injected with [“Hlthymidine prior to 29 hr of development, nerve cells of the mature optic studied in serially aligned prints. The number, position, and characteristics of labeled cells in and around the lamina consistently show scattered light labeling or no laminar primordium were noted. For comparison, and to label despite the presence of heavily labeled cells elsevisualize features not resolved with the light microscope, where in the CNS (e.g., in the supraesophageal ganglion) embryos at the same stages in development were sec- and in nearby epithelial cells just below the carapace. More heavily labeled cells can be seen in the lamina by tioned for electron microscopy. At 36 hr, ll/z hr after the [“Hlthymidine injection, 29 hr, and by 30 hr the lateral and ventrolateral margins labeled cells are seen in the posterior laminar primorof the lamina show a bilaterally symmetric distribution of heavily labeled cells. The amount of label diminishes dium, in the medullary primordium, and in the primordium of the supraesophageal ganglion. Cells in the an- in cells positioned more medially and dorsally. A comterior lamina that appear already recruited into car- puter-assisted reconstruction of an adult injected at 30 tridges are unlabeled. In one reconstructed specimen, the hr of age is shown in Figure 3a. Heavily labeled cells number of unlabeled cells is 23/hemilamina, and roughly (defined as cells showing 60% or more of maximum half of them appear to be in cartridges. As will be seen cellular label) almost exclusively occupy the lateral to later, the number of unlabeled cells is not too different ventrolateral margins of the lamina. In contrast, unlafrom the number obtained from animals injected at 34 beled neurons can be found at this position when label hr but fixed when adult. Posterior to the region of unla- is injected at 32 or 33 hr of development. This can be beled cells, heavily and moderately labeled cells are pres- seen in the reconstruction of an animal injected at 33 hr ent both on and near the midline. Most of these cells are shown in Figure 3b. Neurons at the lateral margins of of uniform size. A few mitotic figures can be recognized, the lamina are devoid of label, whereas most cells in and most of these are labeled. A mitotic figure in the more medial positions are intensely labeled. Since cells midline region, where presumptive laminar cells are first at these positions fail to incorporate [‘lH]thymidine for recruited, can be seen in the electron micrograph of an the duration of middle embryogenesis, we can conclude embryo fixed at 35 hr of development as shown in Figure that they have withdrawn from the cell cycle by 33 hr 2c. Larger cells, many of them labeled, make up a major and that an upper limit on the duration of final S phase part of the posterior region of the optic ganglion primorin these cells is no more than 3 hr. Figure 3, c and d, dium. A laminar-medullary boundary is not readily dis- shows similar computer reconstructions for specimens tinguishable at this stage, precluding the identification injected at 35 and 39 hr of development. Again, it can be of possibly separate precursor cells for these structures. seen that unlabeled cells occupy positions that showed In a specimen fixed 4 hr after injection of label (38.5 label previously, demonstrating withdrawal from the cell hr in development), the number of photoreceptor fiber cycle, whereas labeled cells become progressively conbundles has increased, as has the area in the lamina fined to the neighborhood of the midplane. These composed of cartridges. Two autoradiographs from a changes can also be seen by comparing autoradiographs specimen fixed at 38.5 hr are shown in Figure 2, a and b. from adults injected with label at 35 and 39 hr of develCounts of unlabeled cells show 25 cells on one side of the opment (Fig. 2, d and e). A clear lateral-to-medial selamina and 28 on the other, numbers in excellent agree- quence of laminar cell birthdates is apparent. When [“HI ment with the number of unlabeled cells seen in adults thymidine is given at 41 hr of age or at 43 hr (the oldest stage injected), all laminar cells are unlabeled. Many injected at 34 hr of age (averaging 28 cells/hemilamina) and not very different from the number of unlabeled cells cells in the medulla of specimens injected at 41 hr are counted at 36 hr (23 cells/hemilamina). The majority of heavily labeled, as are cells in the supraesophageal ganthese unlabeled cells appear to be in cartridges. As one glion. Injection at 43 hr results in only a few cells labeled moves posteriorly through the lamina, labeled cells begin in the posterior medulla, whereas labeled cells remain to appear but are confined to the midline, surrounded more frequent in the supraesophageal ganglion. Since laterally by unlabeled recruited cells (Fig. 2b). Still fur- laminar glial cells were not labeled in any of our series ther posteriorly, nearly all cells are labeled. and because these cells are present when optic axons These results suggest that cells already recruited into reach the lamina (LoPresti, 1975), we believe them to be nascent cartridges are postmitotic, whereas cells not yet the earliest cells in the lamina to become postmitotic. withdrawn from the cell cycle are not yet recruited into Histograms of normalized grain counts over the nuclei cartridges and are located posteriorly and medially in the of the lamina (Fig. 4) demonstrate the roughly lo-hr time laminar primordium (Fig. la, lower panel). The embry- course of cell cycle withdrawal in the lamina. Cells in the onic labeling pattern correlates with electron microscopic lateral lamina are not labeled by 32 to 33 hr and remain observations which show that presumptive laminar cells refractory to labeling for the next 10 hr. The number of are first contacted by incoming photoreceptor axons near unlabeled laminar cells continues to increase, and by 41
Flaster and Macagno
+
Vol. 4, No. 6, June 1984
’
Figure
2
1
The Journal
of
Neuroscience
Relationship betweenCell Birthdates and Cell Fates
hr all laminar cells are postmitotic. The computer reconstructions indicate that birthdates of cells and their positional fates are correlated as lateral:oldest, medial:youngest. This pattern is quite similar to that of the order of arrival of ommatidial axon bundles from the eye and that of the order in which laminar cartridges are formed. The birthdates of laminar cells within individual optic cartridges. Using serial light micrographs, it is possible
to assign laminar cells to their respective cartridges with little error. From such reconstructions, the number of labeled, lightly labeled, or unlabeled cells in each cartridge can be evaluated. A comparison of animals injected at various times during development makes it possible, in a sense, to watch the cells of each cartridge move through their final cell cycle. It is also possible to arrange cartridges in a timetable of birthdates, oldest to youngest, as presented in Table I. Several conclusions can be drawn from these analyses. First, there is an overall sequence of withdrawal of laminar cells from the cell cycle which correlates with the positions of the cells in the mature array. Second, cells of any given cartridge do not usually withdraw together but tend to withdraw in a staggered fashion over an interval of approximately 3 to 4 hr. For a particular cartridge, the number of unlabeled, postmitotic cells at a particular time can vary from side to side and from specimen to specimen. Finally, analysis of cell cycle withdrawal across all of the cartridges shows that the age of a cartridge assessed by thymidine birthdating bears a very close correlation to the time that the cartridge is formed, as observed in the embryo by electron microscopic analysis of sequential developmental stages. The arrival of photoreceptor axon bundles to the lamina and the formation of the array of optic cartridges can be viewed as a series of four steps, where a group of cartridges are formed in each step. Two cartridges are formed in the first step, and three cartridges are formed in each of three successive steps, giving a total of 11
1491
cartridges/hemilamina (LoPresti et al., 1973). The results presented in Table I show that cartridges A, B, and C (see Fig. lb, lower panel for the positions of these cartridges in the adult) are clearly the youngest cartridges in that some of their cells have not completed their final division several hours after the cells of the next youngest cartridge, D, are all postmitotic. This suggests that these three cartridges in the adult correspond to the last three embryonic cartridges to form at the midline. The cells of cartridges J and K withdraw from the cell cycle well ahead of the cells in the other cartridges; therefore, these two cartridges in the adult should correspond to the first two cartridges to form in the embryo. The two middle groups of embryonic cartridges should then be made up of I, G, and H as the older group and F, E, and D as the younger, more medial group. The boundary between these two groups asjudged by birthdate criteria is not as sharp as the other two boundaries. These results also suggest that in the three youngest groups of cartridges (I,G,H; F,E,D; C,B,A), the most ventral cartridge should differentiate slightly before the most dorsal cartridge. Serial electron microscopy of embryos ranging from 33 to 41 hr of development, prepared as part of the present experiments, confirm our previous observation that photoreceptor axon bundle arrivals to the lamina can be decomposed into four steps. These series also demonstrate additional intermediate stages. Figure 5 shows a summary of reconstructions from four series in which we were successful in capturing instances where only one or two of the bundles of the third group have reached the laminar primordium. The axon bundles arrive in the sequence: ventral first, dorsal last. The morphological demonstration of the ventral-to-dorsal sequence of fiber bundle arrival and the accompanying degree of developmental advance within each cartridge confirm the prediction made on the basis of the birthdate results: that in the third group of cartridges, the ventral cartridge tends to be older than the dorsal one. We suspect that
Figure 2. a, Autoradiograph of a transverse section through the anterior lamina of an embryo injected with [3H]thymidine at 34.5 hr of development and fixed 3.5 hr later. The arrow indicates the dorsoventral midline and the midline sinus separatingthe lamina (L) into right and left halves. The eye (E) surrounds the lamina at this level. Pigment granules are visible in the photoreceptors of the eye. By this stage,at this anteroposterior level in the lamina, all cells are recruited into cartridges. There are no silver grains over laminar nuclei at this level. b, Autoradiograph of a section from the samespecimenbut 5 pm more posterior. The arrow indicates the dorsoventral midline. The lamina (L) has broadenedand the medulla (M) now borders the lamina laterally. Heavily labeled cells are present on the midline; unlabeled cells are situated more laterally in the lamina. Comparisonwith comparableelectron micrographic sectionsshowsthat cells of the lateral lamina are recruited into cartridges, whereasmedially positioned cells may or may not be in contact with the growth conesof optic axons. c, Electron micrograph of the lamina of an animal fixed at 35 hr of development. The plane of section is intermediate between transverse and horizontal, with dorsoposteriorto the top of the micrograph and ventroanterior to the bottom. The arrow indicates the midline. The laminar primordium is separatedfrom the eye by a densely stained extracellular sinus which is narrow laterally and broadensmedially, where it also separatesthe two halves of the lamina. In the lamina, a cytokinetic figure (arrowhead) is seenadjacent to the midline sinus.The division furrow is apparent, nearly pinching off the two daughter cells. Note that the appearanceof the two daughter nuclei differs from that of the interphase nuclei of other cells. The nucleus of one of the cellswhich forms the midline glial palisadethat separatesleft and right halves of the eye is marked (G). Scale bar = 4.5 pm. cl, Autoradiograph of a transverse section through the anterior lamina of an adult injected with [“Hlthymidine at 34 hr of development. The arrow indicates the position of the dorsoventral midline. Most neurons show silver grains over their nuclei. e, Autoradiograph of a transverse section through the anterior lamina of an adult injected with [3H]thymidine at 37 hr of development.The arrow indicatesthe dorsoventral midline. Labeled nuclei are confined to the neighborhoodof the midline, while more laterally situated nuclei are unlabeled.The scale bar in e represents20 pm and appliesto a, b, d, and e.
Flaster and Macagno
a
b
C
d
Vol. 4, No. 6, June 1984
Figure 3. Computer graphics displays of reconstructions of adult laminae from four specimens injected with k’H]thymidine at successive times during development and then processed for autoradiography. Each reconstruction is a transverse projection oriented as if looking through the anterior surface of the optic ganglion. The dorsal surface of the ganglion is oriented toward the top of each display. The arrowheads indicate the position of the dorsoventral midplane. Each small contour is a cross-section of a laminar cell nucleus, indicating the position of that cell body. Grain counts for each cell were determined by summing the counts over each nuclear profile in serial l-Frn sections. Dotted contours represent cells whose grain counts are less than 10% of maximum cellular label. Solid contours represent cells with grain counts of more than 10% of maximum cellular label. In a, solid, hatched contours represent cells with grain counts of more than 60% of maximum cellular label. Maximum cellular label in each specimen was defined as the mean grain count of the three most heavily labeled cells in that specimen. a, Specimen injected at 30 hr of development and fixed when adult. b, Specimen injected at 33 hr of development and fixed when adult. c, Specimen injected at 35 hr of development and fixed when adult. d, Specimen injected at 39 hr of development and fixed when adult. this rule holds true not only for the third embryonic group of cartridges but for the following group as well,
although this has not been demonstrated explicitly. Correlation between laminar receptor axon bundle arrivals
cell birthdates at the lamina.
and photo-
In order to establish the temporal relationship between laminar cell birthdates and the arrival of photoreceptor axon bundles at the laminar primordium and subsequent formation of cartridges, embryos were fixed at a number of times in the interval during which laminar cells are born. In some
instances, it was possible to do this with the same broods used for the birthdate studies, so that embryos of exactly the same age were either injected with [“Hlthymidine or fixed for electron microscopy at injection time. The embryonic specimens were serially thin-sectioned and the number of fiber bundles reaching the lamina was counted. The processes of fiber bundle arrival and laminar cell withdrawal from the cell cycle are contemporaneous (Fig. 6). When average rates of fiber bundle arrival and lami-
The Journal
of
Neuroscience
Relationship
between
Cell Birthdates
and Cell Fates
1493
30 30
HOURS
33
HOURS
39
HOURS
60
80
25
95 35 HOURS 90
15
n
7
0 20
40
60
80
100
NORMALIZED
20
GRAIN
COUNTS
40 PER
CELL
100
(%I
Figure 4. Normalized grain count histograms of laminar cells. Grain count data for specimens injected with [“Hlthymidine at 30, 33,35, and 39 hr of development (but fixed as adults) are displayed as normalized histograms. (Reconstructions of the laminae of these specimens are shown in Fig. 3.) Maximum cellular label was defined as the mean of the three most heavily labeled cells in each specimen and are 64, 72, 126, and 54 grains/ cell, respectively, for the specimens labeled at 30, 33, 35, and 39 hr. These means were used as the normalizing factors. The histogram intervals are 10% in width.
The number
of radioactively
labeled
laminar
TABLE I in each optic cartridge
neurons
for animals
Age at Injection 33
Cartridge
34b
34a
35
injected
at different
embryonic
ages”
(Hours) 37b
37a
39
37c
41
LRLRLRLRLRLRLRLRLR
Total
A B C D E F G H I J K Labeled
’ Data
are given
Cells
(%)
5 5 5 5 5 5 2 5 4 0 1 79
for left (L) and right
5 5 5 5 5 5 3 4 4 0 0 74
4 5 2 5 5 3 2 1 1 0 0 49
(R) cartridges.
3 4 3 4 4 5 1 1 1 0 0 50
2 5 3 4 5 3 12 3 0 0 0 51
3 4 3 5 4 4 4 10 0 0 56
5 5 3 5 5 3 0 2 0 0 53
5 4 4 5 5 3 2 2 0 0 0 52
4 2 3 0 0 0 0 0 0 0 0 17
4 2 12 2 0 0 0 0 0 0 0 17
4 12 0 10 0 0 0 0 0 0 15
4 3 10 0 0 0 0 0 0 17
4 2 2 0 0 0 0 0 0 0 17
4 3 13 0 0 0 0 0 0 0 0 17
3 1200 0 0 0 0 0 0 0 0 13
300 200 000 000 000 000 000 000 000 000 13
0
0
1494
Vol. 4, No. 6, June 1984
Flaster and Macagno
35HOUREMBRYO
assays only cells which eventually make up the mature lamina, ignoring cells which might die during subsequent development. However, cell death is a rare event in normal laminar develoment (Macagno, 1979).) To measure the variance in time of laminar cell birthdates and of axon bundle arrivals, replicate light microscope autoradiographic series and electron microscope embryonic series measuring either parameter at a single time point were prepared in parallel using embryos from a single brood. Embryos intended for birthdate analysis were injected with [“Hlthymidine at 37 hr, while the remainder of the brood was fixed for electron microscopy at that time. The results of the replicate labeling analysis in the adult lamina are shown in Table I (specimens 37a, 37b, and 37~). Of the total of 54 labeled cells in these three
DORSAL
p--$7-J
36HOUREMBRYO
DORSAL [T-q-i-q
37HOUREUBRYO
DORSAL
,
x x
38HOUREMBRY0 1
DORSAL
x
I
x x
Figure 5. Intermediate stagesin the arrival of the third group of photoreceptor axon bundlesto the embryonic lamina. In this sequenceof schematic reconstructions each number represents both the relative position of an axon bundle in the embryonic lamina and the arrival groupto which that axon bundle belongs. The double vertical bar representsthe dorsoventral midplane. The five cartridges formed in the first two groups of axon bundle arrivals move away from the midplane as the axon bundlesof the third group arrive. The axon bundlesof the third group are added sequentially in ventral-to-dorsal order. Note that the first axon bundle in the third group enters the embryonic lamina dorsomedialto the ventralmost axon bundle of the secondgroup. The ventralmost cartridge in the secondgroup of cartridges (the cartridges formed by the axon bundlesof the secondgroup) remains closer to the midline than do the other cartridges of the secondgroup during subsequentdevelopment.
nar cell withdrawals from the cell cycle are compared, they are found to be similar. Laminar cells leave the cell cycle at an average rate of between 5 and 6 cells/hemilamina/hr and fiber bundles enter each hemilamina at about 1 fiber bundle/hr. (Correlation coefficients of linear regressions for either process are >0.96). Since the ratio of laminar cells to fiber bundles in the adult is 5:1, the average rates with which laminar cells become postmitotic and fiber bundles arrive to the lamina from the eye are matched. The closely matched rates of final mitoses and fiber bundle arrivals do not necessarily mean that the five cells belonging to a cartridge withdraw from the cell cycle simultaneously. Rather, as the data in Table I indicate, cells withdrawing at the same time often become members of different cartridges, all of which are recruiting laminar cells concurrently. (Strictly speaking, the rate at which cells become postmitotic, which we have measured,
0 100
0
0 00
60 0 ” u
60
0 0
00
28
30
32
34
36
38
40
42
HOURS
Figure 6. Photoreceptor axon bundle arrival to the lamina and the withdrawal of lamina cells from the cell cycle. Top, The number of photoreceptor axon bundles present in the lamina is plotted as a function of developmental age. Each point was obtained by a direct count of axon bundles from electron micrographsof a serially sectionedembryo. The circled data points at right indicate that the processof fiber bundle arrivals is complete by these times. Bottom, The number of postmitotic laminar neurons is plotted as a function of developmental age. At 30 hr all laminar cells are mitotic. At later times, the total number of postmitotic cells is approximated by consideringcells with lessthan 10% of maximum cellular label (aspreviously defined) to be postmitotic. A very small error is incurred by including in this group cellsthat are lightly labeled. The solid circles indicate that all laminar neurons fail to label when [“Hlthymidine is injected at or after 41 hr of development.
The Journal
of Neuroscience
Relationship
between
Cell Birthdates
series, 50 labeled cells come to be positioned in the three midline cartridges A, B, and C. The four labeled cells not found in these cartridges (the last group of cartridges to form) are located in the two dorsal cartridges adjacent to them, cartridges D and E. Of the last three cartridges to form (A, B, and C), cartridge A invariably contains the most labeled cells (four of five in every case), whereas the numbers of labeled cells in cartridges B and C vary considerably both between specimens and from side to side in each specimen. The total number of cells still in their final S phase, averaging 9 cells/hemilamina (maximum of 10 cells and minimum of 8 cells), is a conserved feature of these replicates, indeed more conserved than the distribution of these cells into cartridges. These results suggest that the rate and timing of presumptive lamina cell production are quite constant, whereas the recruitment of a particular cell into a particular cartridge is, relative to cell production, a more variable process. Comparisons of the development of replicate animals prepared for serial electron microscopy show remarkable invariance. In the three specimens examined, seven fiber bundles have reached the lamina: the two fiber bundles of the first group, the three fiber bundles of the second group, and the two more ventral fiber bundles of the third group. A summary of the state of cartridge recruitment for the two most recently arrived fiber bundles (Fig. 7) shows no significant left-right variation, as measured by the number of presumptive laminar cells which the lead fiber of each photoreceptor fiber bundle has managed to contact. The most ventral fiber bundle had advanced deeper into the lamina than the dorsal bundle, and in two of the three specimens, the lead fiber growth cone has contacted the first cell to be recruited into its cartridge, although the characteristic “wrapping” interaction between lead fiber and presumptive laminar cell is not yet apparent. In the remaining instances, the lead fiber has only come into contact with processes of one or both of the glial cells present in the anterior lamina at this time. The serial electron micrographs offer additional evidence that the time interval between the completion of the terminal mitoses of presumptive laminar cells and their recruitment into cartridges can be very brief, and also suggest that interaction between cells that are not yet postmitotic and the growth cones of lead fibers is possible. Posterior to the region of recruited cells in these 37-hr embryos is a region containing a number of cells of uniform size and appearance and a few cells that are mitotic. These cells are in an area which is appropriate for presumptive laminar cells that will shortly be recruited. By both position and general shape, the cells in the midline region appear to be identical to the labeled midline cells seen in embryonic light microscope autoradiographs at this stage in development. The growth cones of lead fibers extend into this region, and, in several instances, the terminal dilation of a lead fiber can be found in close apposition to mitotic cells. The correlation between photoreceptor fiber bundle arrival and cell withdrawal already indicated that very short intervals should occur between cell birthdates of laminar cells and their recruitment into cartridges. Repeated observation of lead fibers extending into the region of unrecruited, presump-
and Cell Fates
1495 DORSAL
mj VENTRAL
EXTENT specinien 37-a
37-b
37-c
axon
OF CARTRIDGE RECRUITMENT IN THE THIRD RANK bundle # recruited dorsal
glial
ventral
plc
dorsal
glial
ventral
plc
dorsal
glial
ventral
Elial
contact
left
right
0
0
1
1
0
0
1
1
contact
0
0
contact
0
0
contact contact contact
Figure 7. Thirty-seven-hour electron micrographic replicates. The upper box is a schematic representation of the number of photoreceptor axon bundles that have reached the lamina by 37 hr of development. All three specimens are identical in this respect. The asterisk indicates that the most dorsal axon bundle of the third group of axon bundles has not yet reached the lamina. The lower box summarizes the stage of development of the two cartridges formed about these axon bundles at this time. In two of the three specimens, presumptive laminar cells (plc) have been contacted by lead axons of the most ventral axon bundle in the third group. In the third specimen, the lead axon of that ventral bundle is in contact with a laminar glial cell only. The lead axons of the more dorsal axon bundles exhibit similar contacts in all three specimens.
tive laminar cells where mitotic cells are seen confirms this. Also, lead fibers can form close appositions with a few more than the five cells they will normally recruit into their cartridge. The terminal, finger-like processes of lead fiber growth cones extend a few micrometers, bringing them into close apposition with several unrecruited cells at a time when five cells have already been recruited into the cartridge to which that lead fiber belongs. A final point from morphological observations of the embryonic lamina concerns the stem cells of the lamina. We observe large cells, often mitotic, that may correspond to the neuroblasts described in several other arthropod visual systems (Panov, 1960; Nordlander and Edwards, 1969b) and elsewhere in the arthropod CNS (Nordlander and Edwards, 1969a; Bate, 1976). However, we have not observed an asymmetric mitosis in the immediate neighborhood of the laminar primordium, nor have we found clear columnar arrangements of what have been termed ganglion mother cells leading away from these putative neuroblasts. Analysis of the neuroblasts is further complicated by the fact that an embryonic boundary between the laminar and medullary primordia is vague. Discussion Autoradiographic analysis of the optic laminae of adult Duphnia labeled with [“Hlthymidine during development
1496
Flaster and Macagno
shows that laminar cells undergo their final mitotic divisions between approximately 30 and 40 hr of development. This occurs in an orderly sequence, such that cells located at the lateral margins of the bilaterally symmetric lamina become postmitotic first, and those cells adjacent to the midplane become postmitotic last. Thus a close correlation exists between the birthdates of cells and both the position of their cell bodies and their retinotopy in the adult array. Analysis of [“Hlthymidine labeling of the embryonic lamina, coupled with electron microscopic analysis, shows that cells already recruited into developing laminar cartridges are postmitotic. The distribution of labeled cells in embryos a few hours after injection of label demonstrates that mitotically active cells are positioned posteromedially in the laminar primordium. Electron micrographs of the same region reveal that cells in comparable positions are not yet recruited into cartridges and are morphologically undifferentiated. The initial contact between presumptive laminar neurons and the growing tips of lead photoreceptor axons occurs close to the midline. Newly contacted laminar cells are displaced laterally as nascent cartridges form, while in their place at the midline appear newly postmitotic cells. Occasionally, mitotic cells can be seen at the midline in close apposition with, or 1 to 2 pm distant from, the advancing growth cones of photoreceptor axons, indicating that the interval between final division of laminar cell precursors and the interaction of their progeny with photoreceptor axons can be quite brief. In general, a comparison of the schedules of laminar cell withdrawal from the cell cycle and arrival of photoreceptor axon bundles to the lamina indicates that the interval between cessation of DNA synthesis and photoreceptor axon contact is never more than a few hours long. We can conclude that the interaction between presumptive laminar cells and growing photoreceptor axons, an interaction previously shown to be characterized by the envelopment of the axon by the laminar neuron and the formation of a transient gap junction between the two cells (LoPresti et al., 1973, 1974), begins as the laminar cells complete what will be their final division or within a short interval thereafter. The sequential recruitment of newly postmitotic cells at the midline, their lateral displacement as they differentiate into cartridges, and the subsequent availability of younger postmitotic cells at the midline region for newly arrived lead fibers to interact with accounts for the lateral-to-medial sequence of laminar cell birthdates. Analysis of laminar cell birthdates within individual cartridges shows that the 11 cartridges of each hemilamina can be ordered chronologically by the birthdates of their laminar cell constituents. This temporal order agrees with the sequence of cartridge formation deduced from serial reconstructions of embryos at successive developmental stages. To maintain this ordering, the presumptive laminar cells at the midline would appear to move little relative to each other prior to their recruitment into cartridges. Following their formation, the cartridges themselves maintain a fixed array. Serial electron microscopic analysis of replicate embryos shows that the morphological sequence and schedule of developmental events is very consistent from animal to animal within a
Vol. 4, No. 6, June 1984
brood, as has been reported previously (Lopresti et al., 1973). Analysis of replicate autoradiographic series shows that the timing of laminar cell withdrawal from the cell cycle is also conserved. At 37 hr in development, the number of cells in the final S phase of their cell cycle varies little, but the distribution of these cells among cartridges is more variable. This suggests that the particular cartridge into which a cell is recruited is not rigidly predetermined. This suggestion is further supported by the results of experiments in which development of the lamina is indirectly perturbed by UV irradiation of the eye (Macagno, 1978). Thus, presumptive laminar ceiis are unlikely to be prespecified as members of a particular cartridge, from which follows that laminar cells of a single cartridge are not clonally related except by chance. Although nonclonal origin of cartridge elements cannot be decided from the evidence gathered here, it is relevant to note that there have been no studies examining clonal relations among cells in any other arthropod’s optic lamina. However, genetic mosaics of the developing compound eye established either by x-ray induction in holometabolous insects or by graft transplants in hemimetabolous insects have established unambiguously that the photoreceptors of a single ommatidium have no obligatory clonal relationship (Ready et al., 1976; Shelton et al., 1977). The synchronous withdrawal of laminar cells from the cell cycle and their innervation by photoreceptor axons raises two key questions. First, how are these two processescoordinated in time? Second, what is the significance of these events to subsequent events in the development of this neuronal array? The first question prompts the consideration of two alternatives. Does proliferation in the laminar primordium occur independently of the development of the projection from the eye, implying that the developmental schedules of both structures are preset by some mechanism external to either structure, or does the developing eye influence proliferative events in the laminar primordium? The formation of presumptive laminar cells competent to interact with optic axons and to differentiate could be the result of an obligatory and autonomous series of maturational divisions from a small number of stem cells. In the primordium of the optic ganglion of other arthropods, a progression of divisions from stem cells, called neuroblasts, to presumptive neurons has been described (Panov, 1960; Nordlander and Edwards, 1969a). Neuroblasts can divide asymmetrically to yield neuroblasts and smaller ganglion mother cells, while the latter symmetrically divide one or more times to yield presumptive neurons. Although we have not observed such a sequence in Daphnia, the evidences does not preclude it. If it exists, such a sequence would imply an obligatory series of maturational divisions leading to the production of competent presumptive laminar cells. Evidence to suggest that cell divisions generating laminar ganglion cells in the proliferative zone (the outer optic anlage in insects) are independent of the eye derives from experiments in which developing eyes of insects have been wholly or partly extirpated or in which the optic lobes have been transplanted. Although the results of earlier work are somewhat equivocal (reviewed in
The Journal
of Neuroscience
Relationship betweenCell Birthdates and Cell Fates
Meinertzhagen, 1973), Anderson (1978) has reported that when the proliferative zone of the eye of Schistocerca gregaria is removed, mitotic rates in the anlage are not significantly affected. Our own preliminary experiments suggest that minimal UV irradiation of the developing eye, just sufficient to observe morphological damage, does not alter the birthdate schedule of the developing lamina (Flaster, 1982). However, we do not consider this issue totally resolved yet, since it would be necessary to measure not only immediate precursor proliferation but also neuroblast proliferation and cell death in order to verify that the eye exerts no proliferative effects on the laminar primordium. Hypothetical mechanisms which could help balance the rates of presumptive laminar cell formation and photoreceptor axon arrivals to the laminar primordium include the following. One possibility is that photoreceptor contact itself induces the postmitotic state in the target cell. A second possible mechanism involves inhibition of further divisions of the stem cells if the number of cells available for recruitment becomes large, and conversely, stimulation of further divisions of the stem cells if the number of cells in the available pool is reduced by recruitment into cartridges. Evidence recently collected in an entirely different system, the retinotectal projection in the goldfish (Raymond et al., 1983), indicates that the eye does influence mitotic rates in the postembryonic tectum of this animal, where both retina and tectum grow by continual addition of newly postmitotic neurons to both structures throughout life. The dependence of the lamina upon initial and sustained innervation from the eye has been demonstrated in a number of arthropods. Deletion of cells in the eye results in the degeneration of cells in the lamina (Macagno 1977,1979; Anderson, 1978; Meyerowitz and Kankel, 1978; Fischbach, 1983). We propose that the closely coupled timing of laminar cell birthdates and the initial interaction of newborn cells with the growing optic axons which will innervate them is a feature common to all species within this phylum. Comparison of studies in a variety of insects including the grasshopper (Anderson, 1978), various dipterans (Meinertzhagen, 1973; Melamed and Trujillo-Cenoz, 1975), the dragonfly (Mouze, 1978), and the cockroach (Stark and Mote, 1981), but with the possible exception of the butterfly (Nordlander and Edwards, 1969b), suggests that a generalized view of the development of the retinolaminar projection in arthropods may be possible (see also Meinertzhagen, 1973). In each of these cases, as in the water flea, the oldest ommatidia project to the oldest optic laminar cartridges, while the youngest ommatidia project to the youngest optic laminar cartridges. The available evidence from these other arthropods, much of it at a lower level of resolution and in some cases incomplete, is also consistent with the proposition that the formation of presumptive laminar neurons and the arrival of photoreceptor fibers from the eye are contemporaneous processes, as they are in Daphnia. We would also expect that the trophic dependence of the lamina on the eye holds true in each case where it has not yet been tested and that photoreceptor contact precedes, and in all likelihood triggers, laminar cell differentiation. In general, the timing of presumptive laminar cell production must be such
1497
that the interaction of photoreceptor axons with the presumptive laminar neurons with which they will form cartridges must occur before the degeneration of their laminar targets ensues. The development of a topographic projection from the ommatidia of the eye to the optic cartridges of the lamina in the water flea appears to be the result of spatially and temporally ordered patterns of neurite growth and stereotyped cellular interaction. Therefore, the formation of this pattern of connections does not at present require the postulation of specific chemical labels which distinguish one repeated structural subunit from the next. The generation of larger arrays of similar structures comprising thousands of ommatidia and optic cartridges does not appear, in principle, to require additional developmental rules, except of course where qualitatively different sorts of connections occur. References Anderson, H. (1978) Postembryonic development of the visual system of the locust Schistocerca gregaria. J. Embryol. Exp. Morphol. 45: 55-83. Bate, C. M. (1976) Embryogenesisof an insect nervous system. I. A map of thoracic and abdominal neuroblasts in Locusta migratoria. J. Embryol. Exp. Morphol. 35: 107-123. Fischbach, K. F. (1983) Neural cell types surviving deprivation in the optic lobes of Drosophila melanogaster. Dev. Biol. 95: 1-18.
Flaster, M. S. (1982) Cellular birthdates of the neuronal arrays in the visual system of Daphnia magna. Ph.D. dissertation, Columbia University, New York. Flaster, M. S., E. R. Macagno, and R. S. Schehr (1982) Mechanisms for the formation of synaptic connections in the isogenic nervous system of Daphnia magna. In Neuronal Development, N. C. Spitzer, ed., pp. 267-296, Plenum Publishing Corp., New York. Hofbauer, A., and J. A. Campos-Ortega(1976) Cell clonesand pattern formation: Genetic eye mosaicsin Drosophila melanogaster. Wilhelm Roux Arch. 179: 275-278. Hollyday, M. (1980) Motoneuron histogenesisand the development of limb innervation. Curr. Top. Dev. Biol. 15: 181215. LaVail, J. H., and W. M. Cowan (1971) The development of the chick optic tectum. II. Autoradiographic studies. Brain Res. 28: 421-441. LoPresti, V. (1975) The development of the eye-lamina neural connections in Daphnia magna: A serial section electron micrograph study. Ph.D. dissertation, Columbia University, New York. LoPresti, V., E. R. Macagno, and C. Levinthal(1973) Structure and development of neuronal connections in isogenic organisms: Cellular interactions in the development of the optic lamina of Daphnia magna. Proc. Natl. Acad. Sci. U. S. A. 70: 56-61. LoPresti, V., E. R. Macagno, and C. Levinthal(1974) Structure and development of neuronal connections in isogenic organisms: Transient gap junctions between growing optic axons and lamina neuroblasts. Proc. Natl. Acad. Sci. U. S. A. 71: 1098-1102. Macagno, E. R. (1977) Abnormal synaptic connectivity following UV-induced cell death during Daphnia development. In Cell and Tissue Interactions, J. W. Lash and M. M. Burger, eds., pp. 293-309, Raven Press, New York. Macagno, E. R. (1978) Mechanisms for the formation of synaptic projections in the arthropod visual system. Nature 275: 318-320.
1498
Flaster and Macagno
Macagno, E. R. (1979) Cellular interactions and pattern formation in the development of the visual system in Duphniu magna (Crustacea, Branchiopoda). I. Trophic interactions between retinal fibers and laminar neurons. Dev. Biol. 73: 206-238. Macagno, E. R. (1981) Cellular interactions and pattern formation in the development of Daphnia magna (Crustacea, Branchiopoda). II. Induced retardation of optic axon growth results in a delay in laminar neuron differentiation. J. Neurosci. 1: 945-955. Macagno, E. R., V. LoPresti, and C. Levinthal(1973) Structure and development of neuronal connections in isogenic organisms: Variations and similarities in the optic system of Daphnia magna. Proc. Natl. Acad. Sci. U. S. A. 70: 433-437. Macagno, E. R., C. Levinthal, and I. Sobel (1979) Threedimensional computer reconstruction of neurons and neuronal assemblies. Annu. Rev. Biophys. Bioeng. 9: 347-362. McCaman, R. E., D. G. McKenna, and J. K. Ono (1977) A pressure system for intracellular and extracellular ejections of picoliter volumes. Brain Res. 136: 141-147. Meinertzhagen, I. A. (1973) Development of the compound eye and optic lobe of insects. In Developmental Neurobiology of Arthropods, D. Young, ed., pp. 51-104, Cambridge University Press, Cambridge, England. Melamed, J., and 0. Trujillo-Cenoz (1975) The fine structure of the eye imaginal disks in muscoid flies. J. Ultrastruct. Res. 51: 79-93. Meyerowitz, E. M., and D. R. Kankel (1978) A genetic analysis of visual system development in Drosophila melanogaster. Dev. Biol. 62: 112-142. Mouze, M. (1978) Role des fibres post-retiniennes dans la croissance du lobe optique de la larve d’Aeschna cyanea Mull. (Insecte Odonate). Wilhelm Roux Arch. 184: 325-350. Mouze, M. (1980) Etude autoradiographic de la proliferation et de la migration cellulaires au tours de la croissance de l’appareil visuel chez Aeschna cyanea Mull. (Odanata; Aeschnidea). Int. J. Insect Morphol. Embryol. 9: 41-52. Murphy, J. S. (1970) A general method for the monoxenic cultivation of Daphnidae. Biol. Bull. 139: 321-332. Nordlander, R. H., and J. S. Edwards (1969a) Postembryonic
Vol. 4, No. 6, June 1984
brain development in the monarch butterfly Danaus plexippus plexippus L. I. Cellular events during brain morphogenesis. Wilhelm Roux Arch. 102: 197-217. Nordlander, R. H., and J. S. Edwards (1969b) Postembryonic brain development in the monarch butterfly Danaus plexippus plexippus L. II. The optic lobes. Wilhelm Roux Arch. 103: 197-220. Panov, A. A. (1960) The structure of the insect brain during successive stages of postembryonic development. III. Optic lobes. Entomol. Rev. 39: 55-68. Raymond, P. A., S. S. Easter, Jr., J. A. Burnham, and M. K. Powers (1983) Postembryonic growth of the optic tectum in goldfish. II. Modulation of cell proliferation by retinal fiber input. J. Neurosci. 3: 1092-1099. Ready, D. F., T. E. Hanson, and S. Benzer (1976) Development of the Drosophila retina, a neurocrystalline lattice. Dev. Biol. 53: 217-240. Shelton, P. M. J., H. J. Anderson, and S. Eley (1977) Cell lineage and cell determination in the developing compound eye of the cockroach, Periplaneta americana. J. Embryol. Exp. Morphol. 39: 235-252. Sidman, R. L., and P. Rakic (1973) Neuronal migration, with special reference to developing human brain: A review. Brain Res. 62: l-35. Stark, R. J., and M. I. Mote (1981) Postembryonic development of the visual system of Periplaneta americana. J. Embryol. Exp. Morphol. 68: 235-255. Straznicky, K., and R. M. Gaze (1971) The growth of the retina in Xenopus laevis: An autoradiographic study. J. Embryol. Exp. Morphol. 26: 67-79. Straznicky, K., and R. M. Gaze (1972) The development of the tectum in Xenopus laevis: An autoradiographic study. J. Embryol. Exp. Morphol. 28: 87-115. Weisblat, D. A., G. Harper, G. S. Stent, and R. T. Sawyer (1980) Embryonic cell lineages in the nervous system of the glossiphoniid leech Helobdella triserialis. Dev. Biol. 76: 5878. White, K., and D. R. Kankel (1978) Patterns of cell division and cell movement in the formation of the imaginal nervous system in Drosophila melanogaster. Dev. Biol. 65: 296-321.