siemens.com/) using a body coil as the transmitting coil ... viewer.com/) on a Macintosh computer (http://www. apple.com/). Coronal and axial images were read ...
The British Journal of Radiology, 83 (2010), 493–498
Central trigeminal involvement in multiple sclerosis using highresolution MRI at 3 T 1
R J MILLS,
MRCP,
1
C A YOUNG,
FRCP
and 2E T SMITH,
FRCR
The Walton Centre for Neurology and Neurosurgery, Departments of 1Neurology and 2Neuroradiology, Liverpool L9 7LJ, UK
ABSTRACT. Trigeminal neuralgia and sensory disturbance is common in multiple sclerosis (MS). Recent literature suggests that signal abnormalities in the cisternal trigeminal nerve and pontine root entry zone are seen in approximately 3% of MS patients, using conventional diagnostic MRI. The objective of this study was to determine the prevalence of trigeminal lesions using high-resolution MRI at 3T. Fortyseven patients with clinically definite MS, chosen at random from the outpatient population of a neuroscience centre underwent MRI on a Siemens 3T Trio machine. Three 3D sequences of T2 TSE (turbo spin echo), T2 FLAIR (fluid attenuated inversion recovery) and T1 IR (inversion recovery) were acquired in the coronal plane. The sequences were of contiguous 1 mm slices with in-plane resolution of up to 0.5 mm by 0.5 mm. Images were read by both a neurologist and a neuroradiologist. Any clinical history of trigeminal symptoms was determined for all subjects. The results showed that 11 patients (23%) had high signal in the trigeminal root entry zone and either the trans-cisternal nerve or pontine nucleus; example images are given. MRI changes did not correspond to clinical symptoms (chi square probability 1.000). The study concludes that high-resolution MRI at 3T yielded a high prevalence of detectable trigeminal abnormality in the MS sample studied. MRI involvement did not correspond to trigeminal symptoms.
Both facial pain (including trigeminal neuralgia) and non-painful facial sensory disturbance are routinely encountered in patients with multiple sclerosis (MS). Previous studies suggest that the prevalence of trigeminal lesions is between 3% and 7% [1, 2], and such lesions may or may not be related to clinical symptoms [1–5]. The relationship between trigeminal sensory symptoms and trigeminal lesions remains unclear. The use of thin, contiguous slices and higher field strength, which improves signal to noise ratio (SNR), may yield greater detection of abnormalities [6–8]. A prospective study was therefore undertaken to determine the prevalence of central trigeminal lesions in MS, using high-resolution MRI at 3 T, and the relation between the presence of lesions and facial sensory symptoms.
Methods and materials Subjects with clinically definite MS [9] were identified using a patient database that reflected the outpatient population of a regional neuroscience centre. The patient names in the database were placed in random order and then subjects were approached by telephone, working sequentially from the random list. The intention was to recruit as many patients as it was possible to scan in the available research time. All subjects underwent scanning on a Siemens 3 T Trio machine (http://www.medical. Address correspondence to: Dr Roger J Mills, Department of Neurology, The Walton Centre for Neurology and Neurosurgery, Lower Lane, Fazakerley, Liverpool L9 7LJ, UK. E-mail: rjm@ crazydiamond.co.uk
The British Journal of Radiology, June 2010
Received 27 April 2009 Accepted 3 June 2009 DOI: 10.1259/bjr/65228893 ’ 2010 The British Institute of Radiology
siemens.com/) using a body coil as the transmitting coil and an eight-channel head coil as the receiving coil. All subjects gave written, informed consent. We used a three dimensional (3D) T2 turbo spin-echo (TSE) sequence (repetition time (TR) 3000 ms, echo time (TE) 354 ms, matrix 256 6 192 (1.0 6 1.0 mm pixels), 160 contiguous slices of 1 mm thickness, acquisition time 8 min 29 s), a 3D T2 fluid-attenuated inversion-recovery (FLAIR) sequence (TR 6000 ms, TE 353 ms, inversion time (TI) 2200 ms, matrix 512 6 440 (0.5 6 0.5 mm pixels), 160 contiguous slices of 1 mm thickness, acquisition time 10 min 38 s) and a 3D T1 inverted-repeat (IR) sequence (TR 2040 ms, TE 5.56 ms, TI 1100 ms, matrix 512 6 448 (0.5 6 0.5 mm pixels), 176 contiguous slices of 1 mm thickness, acquisition time 7 min 38 s). All sequences were acquired in the coronal plane; none of the examinations used contrast enhancement. Full details of the scan parameters can be found in Table 1. The study had local ethics committee approval (Sefton 04/ Q1501/154). Viewing and post-processing of images were performed with OsiriX (v2.5; http://www.osirixviewer.com/) on a Macintosh computer (http://www. apple.com/). Coronal and axial images were read by both a neurologist and a neuroradiologist, in consensus, for the presence of plaque in both the transcisternal and intrapontine parts of the trigeminal nerves. The extent of lesions was determined by the use of post-processing techniques, such as curved multiplanar reconstruction (MPR), on the 3D data. Subjects were asked about any history of either painful or non-painful facial sensory symptoms. For any subject with 493
R J Mills, C A Young and E T Smith Table 1. Scan parameters for the three sequences Acquisition type
T2 FLAIR 3D coronal
T2 TSE 3D coronal
T1 IR 3D coronal
Repetition time, TR (ms) Echo time, TE (ms) Inversion time, TI (ms) Echo train length Matrix size In-plane resolution (mm) Slice thickness (mm) Interslice gap (mm) Pixel bandwidth Per cent phase FOV Number of phase encoding steps Imaging frequency Flip angle ( ˚) Number of slices Acquisition time SAR (W/kg)
6000 353 2200 221 512 6 440 0.5 6 0.5 1 0 930 85.93 221 123.25 180 160 109 380 0.1586
3000 354 0 197 256 6 192 1.0 6 1.0 1 0 750 75 197 123.25 180 160 89 290 0.3191
2040 5.57 1100 1 512 6 448 0.5 6 0.5 1 0 130 87.5 224 123.25 8 176 79 380 0.04533
FOV, field of view; SAR (W/kg), specific absorption rate (watts/kilogram).
painful facial symptoms, no further categorisation of the pain syndrome was made. The imaging was performed without contrast and thus detailed assessment of the age of lesions could not be made. Therefore, patients were scored as having a positive history if they had experienced facial symptoms at any point during their illness. False-negative recall of symptoms was assessed and corrected, where possible, by reference to the case notes for each subject. Prevalence of lesions was calculated as a percentage with 95% confidence intervals (CIs) for a binomial distribution. The proportion of symptomatic lesions was determined by x2 test with Yates’ correction where necessary. Relation to disease duration and subject age was determined by independent t-test.
Trigeminal lesions Eleven out of 47 patients, or 23% (95% CI, 12% to 38%), had evidence of trigeminal lesions. Selected coronal and axial T2 FLAIR and T2 TSE images of typical lesions are shown in Figures 1–5. Six of the 11 patients (55%; 95% CI, 23% to 83%) had bilateral lesions. Lesions of the root entry zone had a characteristic linear appearance, which, when scrolling through images, was clearly in continuity with the trigeminal nerve as it entered the pons. Techniques such as curved MPR also confirmed the continuity of high signal from nerve to root entry zone and, in some cases, even to pontine-medullary nucleus. Figure 5b demonstrates this by showing corresponding T2 FLAIR, T2 TSE and T1 IR images in a curved coronal plane.
Results Clinical correlation Subject characteristics 59 patients were contacted. Nine declined to take part (four on the basis of claustrophobia, the others for no specified reason). Three subjects agreed but then did not attend. 47 subjects completed the study, and their characteristics are described in Table 2.
There was no difference in mean age (p 50.897) or disease duration (p 50.379) between those patients with trigeminal lesions and those without. Similarly, there was no difference, by x2 test, in the proportions of patients with lesions by sex (p 50.676) or disease type (p 50.405).
Table 2. Subject characteristics
Disease type, number of subjects (%)
EDSS, number of subjects (%)
Total number of subjects Number of female subjects (%) Mean age (SD, min.–max.) (years) Mean disease duration (SD, min.–max.) (years) Primary progressive Relapsing–remitting Secondary progressive 0–4.0 4.5–6.5 7.0–7.5 8.0–9.5
47 34 (72.3) 47.0 (8.1, 34–63) 16.9 (9.4, 2–40) 5 (10.6) 26 (55.3) 16 (34.1) 18 (38.3) 21 (44.7) 4 (8.5) 4 (8.5)
EDSS, expanded disability status scale [10]; SD, standard deviation.
494
The British Journal of Radiology, June 2010
Trigeminal lesions in MS at 3 T
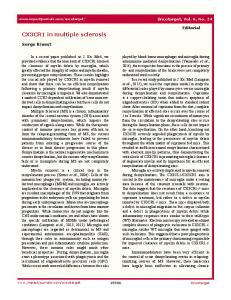
Figure 1. Coronal T2 FLAIR (left) and axial reconstruction (right) showing a hyperintense lesion in the trigeminal root entry zone and tract (arrowhead).
The x2 tests showed no link between either painful or non-painful facial sensory symptoms and the presence of MRI lesions (p 51.000 and p 50.893, respectively). Nor was there any link between any sensory symptom and the presence of MRI lesion (p 51.000).
Discussion We found in the sample studied, a prevalence of central trigeminal involvement in MS of between 12% and 38%. In all subjects with central trigeminal involvement, high signal was seen in the trigeminal root entry zone and intrapontine tract. This signal could extend in either direction to the trans-cisternal part of the nerve and what was taken to be the trigeminal nuclei (both ascending and descending). The changes were often bilateral and symmetrical. A handful of studies have described the MRI appearances of trigeminal lesions in MS. Linear pontine lesions, identical to those demonstrated in the axial images of the present study, have been found by Nakashima et al [2] and Broggi et al [11], and brainstem nuclei demyelination was described by Gass et al [3].
Previous estimates of population prevalence may have problems for two main reasons. First, different, and often retrospective, patient samples were used: those with trigeminal neuralgia [3], those with a series of consecutive routine diagnostic images [1, 2], or those from trial populations [12]. The confounding factor with a trigeminal neuralgia sample is that the frequency of lesions in asymptomatic patients is not known. In trial populations and those undergoing routine diagnostic imaging, subjects tend to be in the active inflammatory stages of disease with relatively short disease duration; patients with long disease duration or slowly progressive disease type are not often imaged routinely, and those with primary progressive disease are very rarely involved in trials. Thus, the prevalence of lesions determined in these studies cannot be extrapolated to the whole population. Second, the studies carried out to date have used MRI field strengths of between 0.5 and 1.5 T and large slice thickness (at least for T2 weighted sequences). It is known that increasing field strength and increasing resolution can detect more lesions [8]. Therefore, using high-resolution images at 3T, prospectively acquired from a population-based sample, would probably give the best possible estimate of lesion prevalence within an MS population.
Figure 2. Coronal T2 FLAIR (left), axial reconstruction (middle) and the corresponding axial T2 TSE axial reconstruction (right) showing a hyperintense lesion in the trigeminal root entry zone (arrowheads), with high signal seen in the transcisternal part of the trigeminal nerve.
The British Journal of Radiology, June 2010
495
R J Mills, C A Young and E T Smith
Figure 3. Coronal T2 FLAIR (left) and axial reconstruction (right) showing a hyperintense lesion in the trigeminal root entry zone and tract (arrowheads) that has a very similar configuration to that in Figure 1.
The relationship between trigeminal lesions and trigeminal neuralgia has been controversial. Some have suggested a definite causality [3, 5], others that demyelination could be only part of the aetiology [4, 13]. This study found no tendency at all towards a relationship between trigeminal lesions and any type of facial sensory symptom, despite the extensive involvement of the whole trigeminal complex in some subjects. It would be reasonable to assume that the presence of T2 hyperintense lesions would in some way alter trigeminal functioning and therefore have some relationship to clinical symptomatology, but this relationship is clearly not simple. The other finding that may have neuropathological implications is the striking confinement of T2 lesions to the trigeminal entry zone and tract while the adjacent pontine myelinated tracts remain unaffected. Do trigeminal neurones have a unique myelin epitope that leads to separate autoimmune involvement, or are they particularly susceptible to neurotrophic viral invasion by direct connection to mucosal surfaces with trigeminal innervation in the upper aerodigestive tract? The present study had some limitations. First, the ideal would have been to select a population-based sample, but in practice, the sample had to be drawn from an
out-patient population subscribed to a research database and so unintentional selection bias was inevitably introduced. This, coupled with the relatively small sample size, would be a caveat to generalising the prevalence of lesions found in this study to the MS population as a whole. However, no other study has attempted to ascertain a population-based prevalence, and, as a preliminary study, this work indicates that the prevalence was likely to be much higher than previously thought. Second, no contrast agent was given and thus disease activity could not be implied. It may have been that only enhancing lesions would have had clinical correlation. Third, signal change in the distal (Gasserian ganglion and beyond) parts of the nerve was not assessed. Others have alluded that this may be relevant in terms of symptom generation [14, 15]. Fourth, the estimation of facial sensory symptoms by the patients themselves across the whole duration of their disease may have been subject to recall bias. False-negative recall was minimised by reference to the case notes. Falsepositive recall of non-painful sensory symptoms could not be easily checked for. Given that facial pain is likely to be a memorable event, the number of false-positive painful symptoms was assumed to have been small.
Figure 4. Coronal T2 FLAIR (left) and axial reconstruction (right) showing bilateral hyperintense lesions in the trigeminal root entry zones and tracts (arrowheads), with increased signal in the transcisternal parts of the nerves. 496
The British Journal of Radiology, June 2010
Trigeminal lesions in MS at 3 T
(a)
(b) Figure 5. (a) Coronal T2 FLAIR (left), axial reconstruction (middle) and the corresponding axial T2 TSE axial reconstruction (right) showing bilateral, well-demarcated, linear hyperintense lesions in the trigeminal root entry zones and tracts of otherwise lesionfree pontocerebellar structures. (b) Axial T2 FLAIR reconstruction (left), corresponding axial T2 TSE reconstruction (middle) and axial T1 IR reconstruction (right) images from the same subjects as imaged in (a). The upper images show the curved plane (green line) in which the lower images were reconstructed. The lower images clearly show abnormal signal extending along the whole transcisternal and intrapontine course of both trigeminal nerves, which becomes confluent with lesions running rostrocaudally where the pontomedullary trigeminal nuclei would be found (arrowheads).
The British Journal of Radiology, June 2010
497
R J Mills, C A Young and E T Smith
Finally, the presence of trigeminal vascular compression was not assessed, which may have informed the analysis of the relation of a T2 lesion to painful sensory symptoms.
Conclusion The prevalence of trigeminal lesions in MS patients detected using high-resolution 3D MRI at 3T was greater than the prevalence detected in other studies using standard two-dimensional, thick-slice imaging at lower field strengths in different MS patient samples. Postprocessing techniques, which could be applied only to the volume acquisition, allowed excellent demonstration of the morphology of trigeminal lesions. Some of the lesions were bilateral and involved both the ascending and descending nuclei. There was often striking delineation of the nerve and tract by high signal: why this should be so might be worthy of further investigation. The involvement of a lesion on MRI did not seem to reflect either painful or non-painful facial sensory symptoms. This may have implications both for understanding the aetiology of trigeminal symptoms in MS and for interpreting the clinical relevance of lesions elsewhere.
4.
5.
6.
7.
8.
9.
10.
11.
Acknowledgments Thanks go to the patients who volunteered for this study, and to staff at our institution for their assistance with this work. The help and support of the staff on the Clinical Trials Unit is also acknowledged.
References 1. da Silva CJ, da Rocha AJ, Mendes MF, Maia AC, Jr., Braga FT, Tilbery CP. Trigeminal involvement in multiple sclerosis: magnetic resonance imaging findings with clinical correlation in a series of patients. Mult Scler 2005;11:282–5. 2. Nakashima I, Fujihara K, Kimpara T, Okita N, Takase S, Itoyama Y. Linear pontine trigeminal root lesions in multiple sclerosis: clinical and magnetic resonance imaging studies in 5 cases. Arch Neurol 2001;58:101–4. 3. Gass A, Kitchen N, MacManus DG, Moseley IF, Hennerici MG, Miller DH. Trigeminal neuralgia in patients with
498
12.
13.
14.
15.
multiple sclerosis: lesion localization with magnetic resonance imaging. Neurology 1997;49:1142–4. Meaney JF, Watt JW, Eldridge PR, Whitehouse GH, Wells JC, Miles JB. Association between trigeminal neuralgia and multiple sclerosis: role of magnetic resonance imaging. J Neurol Neurosurg Psychiatry 1995;59:253–9. Cruccu G, Biasiotta A, Di Rezze S, Fiorelli M, Galeotti F, Innocenti P, et al. Trigeminal neuralgia and pain related to multiple sclerosis. Pain 2009;143:186–91. Mills RJ, Young CA, Smith ET. 3D MRI in multiple sclerosis: a study of three sequences at 3 T. Br J Radiol 2007;80:307–20. Bachmann R, Reilmann R, Schwindt W, Kugel H, Heindel W, Kramer S. FLAIR imaging for multiple sclerosis: a comparative MR study at 1.5 and 3.0 Tesla. Eur Radiol 2005;1–7. Wattjes MP, Lutterbey GG, Harzheim M, Gieseke J, Traber F, Klotz L, et al. Higher sensitivity in the detection of inflammatory brain lesions in patients with clinically isolated syndromes suggestive of multiple sclerosis using high field MRI: an intraindividual comparison of 1.5 T with 3.0 T. Eur Radiol 2006;16:2067–73. Poser CM, Paty DW, Scheinberg L, McDonald WI, Davis FA, Ebers GC, et al. New diagnostic criteria for multiple sclerosis: guidelines for research protocols. Ann Neurol 1983;13:227–31. Kurtzke JF. Rating neurologic impairment in multiple sclerosis: an expanded disability status scale (EDSS). Neurology 1983;33:1444–52. Broggi G, Ferroli P, Franzini A, Servello D, Dones I. Microvascular decompression for trigeminal neuralgia: comments on a series of 250 cases, including 10 patients with multiple sclerosis. J Neurol Neurosurg Psychiatry 2000;68:59–64. van der Meijs AH, Tan IL, Barkhof F. Incidence of enhancement of the trigeminal nerve on MRI in patients with multiple sclerosis. Mult Scler 2002;8:64–7. Ferroli P, Farina L, Franzini A, Milanese C, Broggi G. Linear pontine and trigeminal root lesions and trigeminal neuralgia. Arch Neurol 2001;58:1311–12. Hutchins LG, Harnsberger HR, Hardin CW, Dillon WP, Smoker WR, Osborn AG. The radiologic assessment of trigeminal neuropathy. AJR Am J Roentgenol 1989;153:1275–82. Pichiecchio A, Bergamaschi R, Tavazzi E, Romani A, Todeschini A, Bastianello S. Bilateral trigeminal enhancement on magnetic resonance imaging in a patient with multiple sclerosis and trigeminal neuralgia. Mult Scler 2007;13:814–16.
The British Journal of Radiology, June 2010