a small subgraph of candidate service host nodes with high service demand ... being spread towards the service domain [3] with the User-. Generated Service ..... hub nodes suffices for getting a very good solution already for small 1-median ...
Centrality-driven Scalable Service Migration Panagiotis Pantazopoulos
Merkourios Karaliopoulos
and
Ioannis Stavrakakis
Department of Informatics and Telecommunications National & Kapodistrian University of Athens Ilissia, 157 84 Athens, Greece Email: {ppantaz, mkaralio, ioannis}@di.uoa.gr
Abstract—As social networking sites provide increasingly richer context, user-centric service development is expected to explode following the example of User-Generated Content. A major challenge for this emerging paradigm is how to make these exploding in numbers, yet individually of vanishing demand, services available in a cost-effective manner; central to this task is the determination of the optimal service host location. We formulate this problem as a facility location problem and devise a distributed and highly scalable heuristic to solve it. Key to our approach is the introduction of a novel centrality metric. Wherever the service is generated, this metric helps to a) identify a small subgraph of candidate service host nodes with high service demand concentration capacity; b) project on them a reduced yet accurate view of the global demand distribution; and, ultimately, c) pave the service migration path towards the location that minimizes its aggregate access cost over the whole network. The proposed iterative service migration algorithm, called cDSMA, is extensively evaluated over both synthetic and real-world network topologies. In all cases, it achieves remarkable accuracy and robustness, clearly outperforming typical localsearch heuristics for service migration. Finally, we outline a realistic cDSMA protocol implementation with complexity up to two orders of magnitude lower than that of centralized solutions.
I. I NTRODUCTION A major change in the emerging networking landscape concerns the role of end-user, who is no more only content consumer but also generator. Web2.0 technologies have enabled this shift towards more user-centric paradigms, as evidenced in the User-Generated Content (U GC) wave in online social networks, blogs, and video distribution sites (e.g., YouTube). This trend has even motivated the rethinking of the Internet architecture [1], [2] and is more recently being spread towards the service domain [3] with the UserGenerated Service (U GS) paradigm, whereby end-users are themselves engaged in the generation and distribution of service facilities [4]. Some recent efforts to enable end-user programming [5] typically involve mashup creation tools that extract data from web pages and create new applications [6]. Besides user-friendly interfaces [4], the UGS paradigm necessitates scalable distributed mechanisms for publishing, discovering, and moving service facilities within the network. In the case of next-generation networks, in particular, these mechanisms should conform to their self-organization properties. Our work addresses the problem of optimally placing This work has been partially supported by the EC IST-FET SOCIALNETS (FP7-IST-217141) project, the Marie Curie grant RETUNE (FP7-PEOPLE2009-IEF-255409), and the National and Kapodistrian University of Athens.
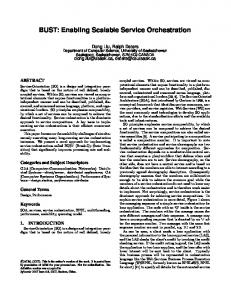
service facilities within the network to minimize the cost of accessing them. This is an instance of the facility location problems, typically formulated as 1- or generally k-median problems if facility replication is feasible [7]. Most of the proposed solutions to the problem are centralized (e.g., [8]): the optimal service location is determined by a single entity possessing global information for both the network topology and distribution of service demand across the network. Centralized approaches assume the existence of some super node that undertakes network-resources management tasks by gathering all required information and bearing the exclusive computation burden of the 1(k)-median problem solution [7]. Moreover, it is willing to repeat these tasks in response to (even minor) user demand shifts or topology changes that may alter the optimal service location. Clearly, these approaches are neither scalable nor inline with the emerging self-organizing and autonomic networking paradigms. Our approach instead is distributed and scalable: it solves locally much smaller-scale 1(k)-median optimization problems and then moves the services towards their optimal location traversing an access cost-decreasing path. Moreover, it is innovative in the way it selects the nodes for the local 1(k)-median problem. State-of-the-art distributed approaches (e.g., [9], [10]) recruit nodes from the immediate neighborhood of the service host. On the contrary, we invest additional effort on a more informed node selection, which promotes the “correct" directions of migration towards the optimal location. To achieve this, we devise a metric, called weighted Conditional Betweenness Centrality (wCBC), that draws on Complex Network Analysis (CNA) [11]. Inline with what is reported elsewhere (e.g., [12]), the insights from CNA are instrumental in accelerating the service migration and directing it towards better locations. In each service migration step, the metric serves two purposes. Firstly, it identifies those nodes that contribute most to the aggregate service access cost and pull the service strongly in their direction; namely, nodes holding a central position within the network topology and/or routing large service demand amounts. Secondly, it correctly projects the attraction forces these nodes exert to the service upon the current service location and facilitates a migration step towards the optimal location (fig. 1.a-b). We detail the metric and our algorithm, called cDSMA, in Sections III and IV, respectively. We demonstrate its accuracy
a.
b.
c.
Fig. 1. a,b)Selected nodes and pulling forces for local-search heuristics(a) and cDSMA(b). c)Two non-zero demand mapping terms (wmap (8; 7), wmap (11; 7)) for Gi7 .
and convergence properties in Section V. We outline a protocol implementation for cDSMA and its rough complexity analysis in Section VI and conclude our paper in Section VII. II. FACILITY
LOCATION AND RELATED WORK
The optimal placement of service facilities within a network has been typically tackled as an instance of the facility location problems [7]. Given the network topology and demand dynamics, the k-median problem prescribes the locations for instantiating a fixed number of service facilities so as to minimize the aggregate cost of accessing them over all network users [7]. The facility location problem has been shown to be NP-hard for general topologies [7], [13], motivating various approximate solutions to it [8], [14]. Typically, the proposed solutions are centralized and require detailed global information about the network topology and service demand, so that their applicability in large-scale networks is undermined. Distributed approaches, on the other hand, have received renewed attention [15], largely because of the wide spread of mobile networks, where the network topology varies dynamically. One recently initiated research thread relates exactly to the approximability of distributed approaches to the facility location problem. Moscibroda and Wattenhofer in [16] draw on a primal-dual approach earlier devised by Jain and Vazirani in [17], to derive a distributed algorithm that tradesoff the approximation ratio with the communication overhead under the assumption of O(logn) bits message size, where n the number of clients. More recently, Pandit and Pemmaraju have derived an alternative distributed algorithm that compares favorably with [16] in resolving the same trade-off [18]. Although the approximability studies can yield provable bounds for the run time and quality of the solutions, they are typically outperformed by less mathematically rigorous yet practical heuristic solutions. Common to most of the distributed facility location schemes is the iterative migration of facilities from the generator host towards their optimal location through a number of locally-determined hops delineating a cost-decreasing path. Oikonomou and Stavrakakis in [9] exploit the shortest-path tree structures that are induced on the network graph by the routing protocol operation to estimate upper bounds for the aggregate cost in case the service migrates to the 1-hop neighbors. Migration hops are
therefore one physical hop long and this decelerates the migration process, especially in larger networks. Closer to our work is the upcoming paper of Smaragdakis et al. [10]. They reduce the original k-median problem in multiple smallerscale 1-median problems solved within an area of r-hops from the current location of each service. Our approach resolves more efficiently the accuracy vs. convergence speed trade-off, especially on real-world topologies (see V-B) and excels over typical local-search oriented schemes (see V-C). We focus on the single service facility scenario that matches better the expectations about the User-Generated Service paradigm, i.e., various services generated within the network raising small-scale interest so that replication of their facilities be less attractive. The network topology is represented by an undirected connected graph G(V, E) of |V | nodes and |E| edges. If w(n) denotes the aggregate demand generated by node n for a specific service and d(k, n) denotes the minimum cost path between nodes k and n, then the 1-median problem formulation seeks to minimize the access cost of a service located at node k ∈ V given by: X Cost(k) = w(n) · d(k, n). (1) n∈V
Our heuristic employs Complex Network Analysis (CNA) to cope with the high complexity and scalability requirements. We introduce the wCBC metric, which assesses the value of nodes as candidate service hosts. The top-wCBC nodes induce a small subgraph on the original network, hereafter called 1-median subgraph, wherein a significantly smaller-scale optimization problem is efficiently solved. Besides, the metric lets us directly map the demand of the rest of the network nodes on this subgraph and, thus, single-out a more informed 1-median subgraph than what relevant local-search heuristics do. Similar CNA insights have already been exploited for significantly improving network protocols. Examples are [12] and [19] that draw on CNA to derive improved DTN routing protocols. III. W EIGHTED C ONDITIONAL B ETWEENNESS C ENTRALITY Central to our distributed approach is the Weighted Conditional Betweenness Centrality (wCBC) metric devised to capture both topological and service demand information for each node.
1) Capturing network topology: from BC to CBC. Betweenness Centrality (BC), a common CNA metric, reflects to what extent a node lies on the shortest paths linking other nodes. Let σst denote the number of shortest paths between any two nodes s and t in a connected graph G = (V, E). If σst (u) is the number of shortest paths passing through the node u ∈V, then the betweenness centrality of u is given by BC(u) =
|V | s−1 X X σst (u) s=1 t=1
σst
(2)
BC(u) which captures the ability of a node u to control the establishment of paths between pairs of nodes, is an average value over all such node pairs. In [20] we proposed Conditional BC (CBC), as a way to capture solely the topological centrality of a random node with respect to a specific node t. It is defined as X σst (u) (3) CBC(u; t) = σst s∈V,u6=t
with σst (s) = 0. The summation is over all node pairs (x, t) ∀x ∈ V destined at node t rather than all possible pairs, as in BC(u). Effectively, CBC assesses to what extent a node u acts as a shortest path aggregator towards the current service location t. 2) Capturing service demand: from CBC to wCBC. Generally, a high number of shortest paths through u does not necessarily mean that equally high demand load stems from the sources of those paths. Naturally, we need to enhance the pure topology-aware CBC metric in a way that it takes into account the service demand that will be eventually served by the shortest paths routes towards the service location. To this end, we introduce weighted conditional betweenness centrality (wCBC), where the shortest path ratio is modulated by the demand load generated by each node s. X σst (u) wCBC(u; t) = w(s) · . (4) σst s∈V,u6=t
Since σut (u) = σut , the wCBC(u; t) value of each node u is lower bounded by its own demand w(u). Therefore, wCBC assesses to what extent a node can serve as demand load concentrator towards a given service location. When all network nodes generate equal demand for a service (the uniform case), wCBC metric degenerates to the CBC one, within a constant factor. In [21] we derive analytical expressions for the wCBC metric in regular topologies. IV. T HE C DSM A LGORITHM
DESCRIPTION
Our centrality-driven Distributed Service Migration Algorithm (cDSMA) steers the service towards its optimal location via a finite number of steps. Step 1: Initialization. The algorithm execution starts at the node s that initially generates the service facility. The service placement cost at node s is assigned an infinite value (pseudocode line 3) to secure the first iteration (line 11).
Step 2: Metric computation and 1-median subgraph derivation. Next, the computation1 of wCBC(u; s) metric takes place for every node u in the network graph G(V, E). Nodes featuring the top α% wCBC values together with the Host node currently hosting the service form the subgraph GiHost (i enumerates the iterations), over which the 1-median problem will be solved (lines 4 − 5 and 14 − 15). Clearly, the size of this subgraph and the complexity in the problem solution are directly affected by the choice of the parameter α. Step 3: Mapping the demand of the remaining nodes on the subgraph. By restricting the solution domain to the GiHost subgraph, the contribution of the “outside world” to the service provisioning cost would be totally neglected. To allow for its inclusion, the demand for service from the G \ GiHost nodes (i.e., the non-shaded nodes in fig. 1c) is mapped on the GiHost ones. To capture the attraction forces due to the service demand of the outside nodes correctly and with no redundancy, the demand of some outside node z is credited only to the first “entry” GiHost node encountered on each shortest path from z towards the service host. Thus, the weights w(n) in the access cost calculation for the nodes n in the GiHost subgraph (see Section II) are replaced by effective demands: wef f (n; Host) = w(n) + wmap (n; Host), where (assuming that Host is node t): X σ 0 (n) (5) w(z) zt wmap (n; t) = σzt i z∈{G\GHost }
0 σzt (n) =
σzt X j=1
1I{n∈SPzt (j) T n=
argmin d(z,u)} u∈SPzt (j)
with SPzt (j) standing for the j th element of the shortest path set from node z to node t. For example, in fig. 1c the original service demand of node, say, 16 is not mapped on all the Gi7 nodes lying on the shortest paths from 16 to the Host 7 (i.e., 11, 12 and 8), but only on 11. Step 4: 1-median problem solution and service migration to the new host node. Any centralized technique (e.g., [14]) may be used to solve this small-scale optimization problem and determine the optimal location of the new Host among the Gi nodes. We assign the value of this cost to Cnext ; if it is smaller than Ccurrent the service is moved to this node and the algorithm iterates through steps 2-4, steering the service, progressively, to the (globally) lowest-cost location. We complete the description elaborating on the cDSMA convergence. Lemma 1 serves as the basis for the proof of the convergence proposition. Lemma 1. A service facility following the migration process of Algorithm 1 will visit at most one network node twice. Proof. Assume that the service, initially deployed at some node n ∈ G reaches the node b ∈ G twice. Right after its first placement at b upon iteration, say, i − 1 we solve the 1median in the subgraph Gib formed by the nodes with the top 1 For the actual wCBC computation, which involves solving the all-pairs shortest path problem, we properly modified the scalable algorithm in [22] for betweenness centrality computation, with runtime O(|V ||E|).
Algorithm 1 cDSMA in G(V,E) 1. 2. 3. 4. 5. 6. 7. 8. 9. 10. 11. 12. 13. 14. 15. 16. 17. 18. 19. 20. 21.
choose randomly node s place SERV ICE @ s Ccurrent ← ∞ for all u ∈ G do compute wCBC(u; s) Gos ← {α% of G with top wCBC values} ∪ {s} for all u ∈ Gos do compute wmap (u; s) wef f (u; s) ← wmap (u; s) + w(u) Host ← 1-median solution in Gos Cnext ← C(Host), i ← 1 while Cnext < Ccurrent do move SERV ICE to Host Ccurrent ← Cnext for all u ∈ G do compute wCBC(u; Host) GiHost ← {α% of G with top wCBC values} ∪ {Host} for all u ∈ GiHost do compute wmap (u; Host) wef f (u; Host) ← wmap (u; Host) + w(u) N ewHost ← 1-median solution in GiHost Host ← N ewHost, Cnext ← C(N ewHost), i ← i + 1 end while
α% wCBC(u; b) values. Let the corresponding cost be Cbi . When the service returns to b at iteration, say, j given that the network topology remains the same, the deterministic wCBC criterion of eq. (4) singles out the same subgraph with the one of the first visit, so we have that Gib = Gjb , implying for the costs that Cbi = Cbj ; the cost-decreasing condition of cDSMA is then not fulfilled and, thus, the service locks at node n and the migration process halts. Proposition 1. cDSMA converges at some solution in O(|V |) steps. Proof. The solution derived from cDSMA is either the globally optimal or one locally anticipated as lowest-cost solution. Given the Lemma 1 and since the number of network nodes is finite, the migrating service will visit every node at most once and only one of them, twice. This takes O(|V | + 1) = O(|V |) steps. V. E VALUATION
OF C DSMA
Clearly, both the network topology and service demand distribution across the network affect the performance of cDSMA. Network topological properties may give rise to or, on the contrary, suppress strong service demand poles and assist (resp. impede) the migration progress of the service facilities towards preferable locations. The accuracy of cDSMA is measured by the average normalized excess cost, βalg (or βalg (α) to capture the percentage of nodes included in the 1median subgraph), defined as the ratio of the service access cost our algorithm achieves, over the cost achieved by the optimal solution (derived by a brute-force centralized algorithm assuming availability of global topology and demand information), for some network topology G and service demand distribution w; clearly, the error induced by our heuristic decreases with α. Closely related to βalg (α) is the index α� , corresponding to the minimum value of α for which the access cost achieved by cDSMA falls within 100 · �% of the optimal, α� = argmin {α|βalg (α) ≤ (1 + �)}. Moreover, we assess the convergence speed of cDSMA through the migration hop
count, hm , reflecting how fast the algorithm converges to its (sub)optimal solution. Small hm values imply fast service deployment and less overhead involved to transport and service set-up/shut-down tasks. For any chosen configuration of the involved parameters, we repeat 20 simulation runs, choosing each time randomly the service generation nodes, and plot their means together with their 95% confidence intervals. A. Experiments with synthetic topologies Before assessing the cDSMA performance on real-world networks, we seek to draw some insights2 from the inspection of two synthetic topologies with very different structural properties, namely the Barabási-Albert3 (B-A) [23] and the twodimensional (N xM ) rectangular grid graphs. B-A graphs form probabilistically and exhibit highly skewed degree distribution. Grids, on the other hand, have strictly regular structure with constant node degree and diameter exponentially growing with the network size. These topologies let us assess the algorithm under extreme yet predictable conditions. 1) Uniform demand. Though non-realistic, uniform demand patterns are insightful since they can isolate the impact of network topology on cDSMA. Figures 2.a,b plot the average normalized excess cost βalg for B-A and grid graphs of 100 nodes, respectively. The error induced by cDSMA decreases monotonically with the 1-median subgraph size in both plots. However, the behavior of cDSMA on the B-A graph is better as the aggregate service access cost increase is within 2% of the optimal, even when we include 10% of network nodes in the 1-median subgraph. Similar accuracy for the grid would require, on average, no less that 40% of the nodes. The high-degree hub nodes of B-A graphs [23] appear to ease the algorithm operation. Placing the service on, or nearby, hub nodes suffices for getting a very good solution already for small 1-median subgraphs. On the contrary, the regular structure of grids does not favor the identification of costeffective locations. The service migration jumps within the grid are clearly shorter than in B-A graphs, often restricted to one-hop distance. Even worse, cDSMA gets more often trapped and terminates prematurely in suboptimal locations. In other words, the attraction force of the optimal location(s) is not impelling enough to pull the migrating service all the way to it. This cDSMA performance differentiation over the two graphs is amplified when the network size and diameter grow. Table I lists the accuracy and migration hop count, hm , against the network and 1-median subgraph size, N and α, respectively. cDSMA’s trend to abort early the migration process only deteriorates with the increase of network size and diameter. This is reflected in both the higher βalg and the slightly increasing yet overly low hm values in Table I. The significantly higher variance in the convergence speed 2A
comprehensive study of cDSMA on synthetic topologies appears in [21]. B-A network requirement of the node degree distribution exponent being equal to 3 appears with network sizes of 1000 nodes or more. Therefore, the employed scale-free networks of a few hundred nodes’ size are small to be called B-A networks; this name is only kept for the sake of clarity. 3 The
1.08
1.08
1.12
1.15 1.06
1.1
1.06
1.08 1.1
(α)
1.02
alg
1.05
1
β
βalg (α)
(α)
1.04
β
alg
1.02
β
alg
(α)
1.04
1
1.06 1.04 1.02 1
1
0.98
0.98 0.98
0.96 0.1
0.96 0.2
0.3
0.4
0.5
0.6
0.7
0.8
0.9
Percentage of participating nodes
a. B-A (s=0)
Fig. 2.
0.95 0.1
0.2
0.3
0.4
0.5
0.6
0.7
0.8
0.9
0.1
Percentage of participating nodes
0.96 0.2
0.3
0.4
0.5
0.6
0.7
0.8
0.9
0.1
Percentage of participating nodes
b. Grid (s=0)
0.2
0.3
0.4
0.5
0.6
0.7
0.8
0.9
Percentage of participating nodes
c. B-A (s=1)
d. Grid (s=1)
Synthetic topologies of 100 nodes : cDSMA accuracy vs. 1-median subgraph size under uniform (a,b) and Zipf (c,d) demand distribution.
C DSMA PERFORMANCE ON
TABLE I B-A AND G RID NETWORKS UNDER UNIFORM DEMAND
B-A graph
Grid network
Network size N
βalg (0.1)
hm (0.1)
βalg (0.4)
hm (0.4)
βalg (0.1)
hm (0.1)
βalg (0.4)
hm (0.4)
50 (25x2) 100 (25x4) 200 (40x5) 300
1.0453±0.0524 1.0134±0.0169 1.0216±0.0327 1.0125±0.0147
2.25±0.31 2.00±0.32 2.00±0.00 2.00±0.00
1.0125±0.0186 1.0070±0.0164 1.0028±0.0061 1.0032±0.0070
1.95±0.28 2.00±0.00 1.95±0.16 2.00±0.00
1.0074±0.0071 1.0569±0.0333 1.0636±0.0487
1.40±0.35 1.30±0.33 1.60±0.71
1.0086±0.0058 1.0006±0.0012 1.0013±0.0043
1.10±0.22 1.20±0.29 2.05±0.59
of the algorithm implies dependence on the service generation location, i.e., initial host. On the contrary, the cDSMA performance over B-A graphs is scalable as: a) it maintains practically the same accuracy as the network size grows; and b) its convergence speed is not affected by the network size. It reaches a near-optimal location within an average of two migration hops. 2) Non-uniform demand. To assess cDSMA under the simultaneous influence of network topology and demand dynamics we introduce asymmetry in the demand distribution. Mathematically speaking, a Zipf distribution models the (spatially random) preference w(n; s, N )s of nodes n, n ∈ N to a given service: w(n; s, N ) = PN1/n1/ls , practically corresponding l=1 to the normalized service request rate. The relative hm and α values under Zipf demand with s = 1 are depicted in Table III. The accuracy of cDSMA for B-A graphs improves further against the respective uniform demand values (shown in fig. 2 as well). The demand asymmetry magnifies the existing attraction forces and directs cDSMA towards the globally optimal service location. On the other hand, cDSMA requires far more nodes within the 1-median subgraph to yield comparable accuracy over grids. When spatial correlation of demands is involved (i.e., the interest in the service is concentrated in a particular neighborhood, as when the service has strongly local scope), a cluster of nodes with high service demand appears in a random area within the grid. Let K cluster nodes collectively represent some percentage z% of the total demand for the service, whereas the other N −K nodes share the remaining (100−z)% of the demand. We call the ratio z/(100 − z) the demand spatial contrast Csp . In 2D grids, clusters are formed by a cluster head node together with its R-hop neighbors. The conPK w(n;s,N ) trast can then be written as: Csp (R, s) = PNn=1 w(n;s,N ) = PK 1/ns PNn=1 s n=K+1 1/n
n=K+1
and the average normalized excess cost becomes a function of both α and the contrast value. The values of βalg (α, Csp ) under spatially random and correlated (R = 1) distribution of demands are reported in Table II for a 10x10 grid topology. Having the top demand values stemming from a
TABLE II I MPACT OF S PATIALLY CORRELATED SERVICE DEMANDS skewness s Csp (1, s) βalg (0.1) βalg (0.1, Csp ) 1 0.786 1.035±0.027 1.016±0.023 2 8.540 1.003±0.006 1.0±0.0
certain network neighborhood we actually “produce” a single pole of strong attraction for the migrating service. cDSMA now follows the demand gradient more effectively than before. As the percentage of the total demand held by the cluster nodes grows larger (i.e., higher Csp ), the pole gets even stronger driving the service firmly to the optimal location. The above results suggest that the higher the asymmetry in either the network topology or the service demand distribution, the better the performance of our algorithm. In the sequence, we investigate manifestations of this general rule in real-world networks. B. Experiments with real-world network topologies The ultimate assessment of cDSMA is carried out over realworld ISP network topologies which do not typically have the predictable properties of B-A graphs and grids; still, we show below that insightful analogies regarding the behavior of cDSMA can be drawn between real-world and synthetic topologies The dataset we consider has been recently made available [24]. It includes numerous data files (corresponding to Tier-1, Transit and stub level networks) that represent snapshots of 14 ISP topologies. We focus on the larger Transit and Tier-1 ISP datafiles4 , with sizes up to approximately 1000 nodes and show results for a representative subset (see [21] for further results) featuring adequate variance in size, diameter, and connectivity degree statistics. Table IV summarizes the performance of cDSMA over the real-world topologies. It reports the minimum number of nodes |Gi | required to achieve a solution that lies within 2.5% of the optimal and the average migration hop count hm for different levels of service demand asymmetry. 4 Several files miss some edges resulting in more than one connected components [24]. Thus, a pre-processing task using a linear-time algorithm [25], is needed to retrieve the maximal connected component mCC.
C DSMA PERFORMANCE ON
TABLE III B-A AND G RID NETWORKS UNDER Z IPF DEMAND (s = 1)
B-A graph
Grid network
Network size N
βalg (0.1)
hm (0.1)
βalg (0.4)
hm (0.4)
βalg (0.1)
hm (0.1)
βalg (0.4)
hm (0.4)
50 (25x2) 100 (25x4) 200 (40x5) 300
1.0156±0.0205 1.0070±0.0143 1.0016±0.0031 1.0029±0.0068
1.60±0.48 2.15±0.35 1.90±0.22 2.05±0.16
1.0014±0.0038 1.0015±0.0034 1.0003±0.0007 1.0000±0.0000
1.85±0.35 1.90±0.22 2.05±0.16 2.00±0.00
1.0083±0.0068 1.0553±0.0319 1.0510±0.0346
1.50±0.37 1.35±0.35 1.47±0.73
1.0062±0.0047 1.0025±0.0020 1.0031±0.0047
1.10±0.22 1.15±0.26 1.90±0.65
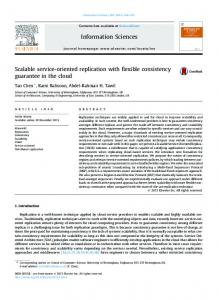
C. cDSMA vs. locality-oriented service migration The way cDSMA determines the service migration path clearly differentiates from typical “local-search” approaches such as the r-ball heuristic [10], which restricts a-priori their search for a better service host to the neighborhood of the current service location. On the contrary, cDSMA focuses its search for the next service host in certain directions. The resulting 1-median subgraph is spatially stretched across that path -consisting of highly “central” nodes- and therefore oversteps the local neighborhood “barriers”. This is clearly illustrated in fig. 3 showing the hopcount distribution between all 1-median subgraph nodes and the host node, for five executions of cDSMA under Zipf demand with s=2. To compare the two approaches, we have implemented a Locality-Oriented Migration heuristic (LOM). With LOM we solve the 1-median problem within the direct neighborhood of r = 2 hops around the current host and apply the same demand mapping mechanism (Section IV) to capture the demand from nodes lying further than r hops away from the current service host. The comparison between LOM and cDSMA, illustrated in Table V, proceeds as follows. We first generate asymmetric service demand (Zipf distribution with s = 1) across the
network. We compute the globally optimal service host node and we select a fixed set of service generation nodes, at Dgen hops away from the optimal location. We then calculate the values of hm and βalg metrics 5 for the two approaches. For cDSMA, we have set the parameter α = 3%, yielding 1median subgraphs of 6 to 12 nodes’ size (Table V). DataSet 35 (diameter=9)
DataSet 40 (diameter=14)
0.5
0.25
a=3% a=5% a=10%
0.4
fraction of nodes
fraction of nodes
The α0.025 and |Gi | values show remarkable insensitivity to both topological structure and service demand dynamics. Although the considered ISP topologies differ significantly in size and diameter, the required 1-median subgraph size does not change. Around half a dozen nodes suffices to get very good accuracy even under uniform demand distribution, the least favorable scenario for cDSMA, as discussed in the previous section. Likewise, α0.025 and |Gi | remain practically invariable with the demand distribution skewness. Although for larger values of s, few nodes become stronger attractors for the algorithm, the added value for its accuracy is negligible. This two-way insensitivity of cDSMA has important practical implications: a) the computational complexity of the local 1median problem can be negligible and scales well with the size and diameter of the network; b) the algorithm performance is robust to possibly inaccurate estimates of the service demand each node poses. The equally good algorithm behavior under uniform demand distribution suggests that there is already adequate topological structure in these real-world networks. As their degree distribution shows (see [21]), there are highdegree nodes and considerable variance in the nodes’ connectedness properties across the network. In fact, the high-degree nodes serve similarly to the hub nodes in B-A graphs; they are easily “identifiable” by cDSMA as low-cost hosts and, even for small 1-median subgraph sizes, their attraction forces are strong enough to pave a cost-effective service migration path.
0.3
0.2
0.1
0
a=3% a=5% a=10%
0.2
0.15
0.1
0.05
0 0
1
2
3
4
5
6
7
distance from service host
8
9
0
1
2
3
4
5
6
7
8
9
10 11 12 13 14
distance from service host
Fig. 3. Hopcount distribution of 1-median nodes from Host under cDSMA.
Since migration hops under LOM are spatially restricted (i.e., Dgen /r hops to reach the optimal location), one would expect that the latter approach needs more migration hops than cDSMA. Interestingly enough, LOM combines high excess costs with fewer migration hops, irrespective of the service generation location or topology. Selecting “blindly” the r-hop neighbors of the current service host as future candidate hosts, LOM effectively introduces noise to the detection of the costeffective service migration direction; the 1-median subgraph nodes are spread unidirectionally around the service host and the mapping process projects more uniformly the demand of the remaining nodes on them (see fig. 1.a-b). Consequently, the migrating service gets easily trapped in local minima and the process stops prematurely, resembling the behavior of the cDSMA in grids under uniform demand. There it was the topology of the network that induced a more local 1median subgraph and attenuated the attraction force towards the optimal; with LOM, this locality is inherently imposed by the method a-priori. On the other hand, the cDSMA seeks to choose the most “appropriate” candidate hosts to lead the service fast to costminimizing locations, no matter what the shape/radius of the emerging Gi neighborhood would be. Even when both approaches are trapped in a suboptimal place, LOM needs more hops to reach it than cDSMA, e.g., three vs. one hops for Dataset 33 and Dgen =7. Moreover, facilitating longer migration hops, cDSMA does not favor nodes according to their proximity to the service demand and/or network topology hot spots, inducing a notion of fairness in the performance that different users get. 5 The void entries are due to the fact that the most distant node to the global minimum location, lies at some distance smaller than the Dgen value.
TABLE IV M EAN VALUE OF α�
FOR VARIOUS DATASETS UNDER DIFFERENT DEMAND DISTRIBUTIONS
s=0 ISP type:Tier-1 Global Crossing -//NTTC-Gin Sprint -//Level-3 -//type:Transit TDC DFN-IPX-Win JanetUK
s=1
s=2
Dataset id/AS#
mCC nodes
Diameter
α0.025
d|Gi |e
α0.025
d|Gi |e
α0.025
d|Gi |e
36/3549 35/3549 33/2914 23/1239 21/1239 27/3356 13/3356
76 100 180 184 216 339 378
10 9 11 13 12 24 25
3.71 3.78 3.53 3.06 3.07 3.98 4.49
0.047±0.001 0.045±0.002 0.024±0.002 0.019±0.002 0.016±0.002 0.018±0.002 0.012±0.002
4 5 5 4 4 7 5
0.047±0.002 0.045±0.001 0.022±0.002 0.018±0.002 0.016±0.002 0.017±0.002 0.012±0.002
4 5 4 4 4 6 5
0.046±0.001 0.043±0.001 0.019±0.002 0.017±0.002 0.014±0.003 0.014±0.003 0.011±0.002
4 5 4 4 4 5 5
46/3292 41/680 40/786
71 253 336
9 14 14
3.30 2.62 2.69
0.033±0.003 0.019±0.003 0.012±0.003
3 5 5
0.027±0.004 0.015±0.003 0.012±0.002
2 4 5
0.026±0.003 0.015±0.003 0.013±0.002
2 4 5
TABLE V C ONVERGENCE SPEED AND ACCURACY OF LOM AND C DSMA ON REAL - WORLD TOPOLOGIES Dataset 23
Dgen 3 4 5 7 10 13
LOM hm 1 1 1 1 – –
VI. A
βalg 1.1050 1.1275 1.1632 1.6060 – –
Dataset 33
cDSMA hm 2 3 2 2 – –
βalg (3%) 1 1 1 1 – –
LOM hm 1 1 1 3 – –
βalg 1.0308 1.3206 1.2800 1.0308 – –
Dataset 27
cDSMA hm 2 2 1 1 – –
LOM
βalg (3%) 1 1 1.2800 1.0308 – –
PROTOCOL IMPLEMENTATION FOR C DSMA
We now sketch a distributed protocol implementation for cDSMA. Our implementation takes into account the constraints of self-organizing networks in that it draws on information locally available at network nodes and distributes the computational load and decision-making task among the nodes on the service migration path. In the same time, it keeps to a minimum information dissemination overhead through messages propagating in the network. We present the proposed implementation in a step-by-step fashion together with a rough analysis of time and message complexity: Service host advertisement: Every time the service carries out a cDSMA-driven migration hop, the new host initiates a service advertisement phase (fig. 4.a) to inform all network nodes about the current service location. This task may be carried out by any efficient flooding scheme requiring O(|E|) messages and O(D) time, where D is the network diameter. Computation of nodes’ wCBC metrics: Our experiments with real-world ISP topologies suggest high rank correlation of centrality metrics (Section III) with their egocentric counterparts, as measured in the nodes’ ego-networks6 [27]. Table VI, for example, reports the correlation values between node rankings produced on the basis of the BC and ego-BC metrics, respectively, on these topologies. The high rank correlation suggests that the selection of the nodes with the highest centrality metrics can be made with sufficient accuracy according to their egocentric counterparts. Likewise, ego-wCBC can be computed locally (fig. 4.b) by individual nodes in O(d2max ), (where dmax is network’s maximum node degree), assuming they are aware of their neighbors’ service demands. These 6 The ego-network structure of social studies comprises a person of interest referred to as the “ego”, along with those having an affiliation with it, known as “alters”. Alters may as well share relations with each other. The counterpart of the ego network in graph-theoretic terms (shaded in fig. 4.b) is called centered graph [26] and includes a given node plus its 1-hop neighbor nodes.
hm 1 1 2 3 1 2
βalg 1.1109 1.2523 1.1109 1.1763 1.7094 1.8579
Dataset 13
cDSMA hm 1 1 1 1 2 1
βalg (3%) 1.0057 1.0057 1 1 1 1.0057
LOM hm 1 1 1 1 1 3
βalg 1.1054 1.2312 1.0434 1.4202 1.4604 1.6887
cDSMA hm 1 1 2 1 2 1
βalg (3%) 1 1 1 1 1 1.1054
TABLE VI C ORRELATION STUDY BETWEEN BC- EGO BC ON ISP TOPOLOGIES DataSet 36 35 33 21 41 46 40
ISP (AS number) Global Crossing (3549) -//NTTC-Gin (2914) Sprint (1239) DFN-IPX-Win (680) TDC (3292) JanetUK (786)
Spearman Correlation Coefficient 0.9648 0.9690 0.9209 0.9718 0.9662 0.9934 0.9714
values along with the individual service demands are then communicated (in O(D) time) to the current service host (alternatively, demands could be directly measured by the current service host if the estimation delays can be tolerated). These dedicated O(|V |) ego-info reporting messages should include a field where all intermediate nodes on the shortest path to the service host will be recorded. Identification of top-wCBC nodes and mapping the residual demand on them: The current service host collects the egoinfo-reporting messages and identifies the top-wCBC nodes that form the GiHost (fig. 4.c). Moreover, the host can carry out the residual demand mapping task. For each outside node z, the host parses its report and adds its demand to the firstly encountered top-wCBC node on the path from z to itself. This demand mapping is clearly an approximation of the nominal algorithm process, as described in step 3 of section IV, in that the demand of each outside node is fully credited to only one node in GiHost , even if node z has more than one shortest paths to the host node going through other GiHost nodes. The demand mapping step for each outside node involves O(D) binary searches within the O(α|V |)-size vector of GiHost nodes (shown in the subplot of fig. 4.c). Therefore, the mapping of the demands of all outside nodes takes O((1 − α)|V |D log(α|V |)) steps. Solution of the 1-median problem within the GiHost subgraph: The service host notifies each of the the top-wCBC
a. Advertisement phase
b. Local metrics computation and forwarding
Fig. 4.
c. Host identifies key-nodes/maps the demand
d. Host solves 1-median
cDSMA protocol implementation phases
nodes with unicast messages of which other nodes (co-players) are included in the GiHost and queries them for their pairwise distances. Each node determines its distance to the other coplayers via a mechanism such as the ping utility (O(α2 |V |2 ) steps, O(α2 |V |2 ) messages), and communicates them (with O(α|V |) messages) to the host. With the pairwise distances of GiHost nodes and the demand mapping terms at hand, the host is capable to solve the reduced 1-median problem and determine the next-best service host. The centralized brute-force solution of the problem by a single super-node entity would require: a) collecting information about the global network topology and demand distribution; b) solving an instance of the all-pairs shortest paths problem, which requires O(|V |3 ) time (e.g., using the Floyd-Warshall algorithm); c) exhaustively enumerating all |V | possible service locations and comparing the costs related to each one of them, involving O(|V |) multiplications, additions, and comparisons. Therefore, the overall complexity would be O(|V |3 ). Through the four cDSMA steps each host totally takes O(α2 |V |2 ) time to determine the optimal location in the respective subgraph (of size α|V |). The full migration process includes hm (α) such computations resulting in O(hm (α)α2 |V |2 ) time complexity, where a