Centre for European Policy Studies
CEPS Working Document No. 235/January 2006
Enlargement and Industrial Competitiveness Policy Implications for New and Old Member States of the EU
Thinking ahead for Europe
Jorge Núñez Ferrer and David Kernohan
Abstract This paper draws policy conclusions for the EU based on the studies performed for the Fifth Framework Programme on industrial competitiveness and other relevant literature. The issue of competitiveness of the new member states and the implications of enlargement for the EU as a whole and for individual member states is complex. This paper discusses the policy implications that result from the research undertaken in the context of this project and presents some additional considerations. Policy actions on industrial competitiveness may be taken at national or EU level. Understanding the positive and negative implications of specific policy interventions is very important, as national or sectoral interests can clash with an optimum EU policy. The paper generally recommends avoiding specific industrial policies, in particular at member state level, that would harm other member states. Industrial competitiveness depends heavily on the investment and economic climate in the member states. This paper recommends improving this climate and in particular completing the single market also for services.
Jorge Núñez Ferrer is an Associate Research Fellow at CEPS and David Kernohan is a Senior Research Fellow.
CEPS Working Documents are published to give an indication of the work within various research programmes at CEPS and to diffuse relevant works from external experts in these fields. Unless otherwise indicated, the views expressed are attributable only to the authors in a personal capacity and not to any institution with which they are associated. ISBN 92-9079-609-X Available for free downloading from the CEPS website (http://www.ceps.be) © Copyright 2006, Jorge Núñez Ferrer and David Kernohan
Contents 1. Introduction ...................................................................................................................................1 2. Defining Competitiveness in an Enlarging Europe ....................................................................1 2.1
Alternative aspects of industrial competitiveness effects of enlargement .................... 2
3. Importance of the industrial sector in CEECs.............................................................................2 4. Factors Affecting Industrial Competitiveness in the new member states .................................3 4.1
Foreign Direct Investment ............................................................................................ 5
4.2
Labour and labour productivity..................................................................................... 6
4.3
Structural determinants for growth and competitiveness.............................................. 7 4.3.1 Public investment and growth............................................................................. 9
4.4
Governance ................................................................................................................. 10
4.5
Exchange rate dynamics ............................................................................................. 12 4.5.1 Nominal convergence a la Maastricht .............................................................. 14 4.5.2 The Balassa Samuelson effect ........................................................................... 15
5. Government policies in the NM3 ..............................................................................................19 6. Policy implications for the new member states ........................................................................20 6.1
Sectoral towards horizontal state aid and FDI promotion........................................... 20
6.2
Human capital ............................................................................................................. 21
6.3
Infrastructure............................................................................................................... 21
6.4
Governance ................................................................................................................. 21
6.5
Exchange rate and monetary union............................................................................. 22
7. Implications for the competitiveness in the EU15 of enlargement .........................................22 8. Policy implications for member states ......................................................................................23 9. Policy Implications for the EU ..................................................................................................24 9.1
Policy coordination ..................................................................................................... 25
9.2
Cohesion and Structural Funds ................................................................................... 25
9.3
The Lisbon Agenda..................................................................................................... 26
9.4
Assessment for the EU................................................................................................ 26
10. Conclusions .................................................................................................................................26 References ..........................................................................................................................................27 Annex. The Balassa-Samuelson effect .............................................................................................30
ENLARGEMENT AND INDUSTRIAL COMPETITIVENESS POLICY IMPLICATIONS FOR NEW AND OLD MEMBER STATES OF THE EU JORGE NÚÑEZ FERRER AND DAVID KERNOHAN
1.
Introduction
The issue of competitiveness of the new member states and the implications of enlargement for the EU as a whole and individual member states is a very complex one. This paper starts with a definition of competitiveness and then discusses the aspects influencing competitiveness in the Central and Eastern European Countries (CEECs) and particularly in the three new member states of the Czech Republic, Hungary and Poland (addressed in this paper as “NM3” for new members 3). It further summarises the results of studies on the impact of government policies on the competitiveness of these countries during the years of transition and accession up to 2003. After the results of the studies on these countries have been presented, the paper discusses the implications for the EU15, in particular the impact on their industrial competitiveness in terms of benefits and challenges. After presenting the results of the changes in competitiveness in Europe and their implications, the paper draws policy conclusions. Policy actions on industrial competitiveness may be taken at national or EU level. Understanding the positive and negative implications of specific policy interventions is very important, as national or sectoral interests can clash severely with an optimum EU policy. Policy coordination between the EU and the member states as well as between the latter is very important to avoid the parallel existence of incompatible policies.
2.
Defining Competitiveness in an Enlarging Europe
The term competitiveness does not have a universally accepted definition. For a firm, it is often defined as its ability to stay in the market at competitive prices. At national level, competitiveness is considered “the ability of a nation’s economy to make rapid and sustained gains in living standards” (Global Competitiveness Report, 1996) or “the ability of an economy to provide its population with high rising standards of living and high rates of employment on a sustainable basis” (European Commission, 2001). Competitiveness is also defined in terms of foreign trade performance, deeply intertwined with the theories of comparative advantage. Since this paper concentrates on policy implications for the EU, the European Commission’s definition will be used. The term ‘economy’ rather than nation is useful, as the competitiveness of the EU is the outcome of the economic activity of the member states combined. The use of the terms ‘employment’ and ‘sustainable’ in the definition has important policy implications, as it indicates a strategic path influencing the selection of objectives at EU level. Competitiveness policies should not only aim at GDP growth, but should pay attention to employment effects and the long-term sustainability of the policies. The EU should thus include wider welfare considerations.
|1
2 | NÚÑEZ FERRER & KERNOHAN
2.1
Alternative aspects of industrial competitiveness effects of enlargement
Competitiveness in the European Union is a particularly complex and controversial matter, especially with the recent enlargement process. The new member states bring with their accession a large increase in the labour force but also a lower reservation wage and a lower capital endowment (per capita) compared to the (old) EU15. The labour force of the new member states is also generally well educated. In terms of EU competitiveness, this is good news. EU industries can take advantage of the lower wage costs and increase their competitiveness in world markets. However, in the older member states, an improvement in the overall competitiveness of the EU is not universally welcomed. While all member states potentially benefit from an enlarged market, in the shorter run the new member states can become strong competitors in particular sectors or geographical areas. The increased competitiveness of the EU as a whole may be accompanied by decreased ‘competitiveness’ and the decline of some industries in certain regions within the EU. Industrial location is likely to change as a result of the changes in the member states’ comparative advantage. The increased labour mobility between the old and the new member states also generally reduces the reservation wages in all member states. While it increases the competitiveness of the EU economy, it may cause the living standards of some groups of workers in the old member states to decline. In any case, the process induces change, which requires all members of the EU to adapt. While hardly any economist would doubt that the overall impact on the EU is positive, some might show concern over the impacts in individual member states, especially those showing structural rigidities (see Davis & Weinstein, 2002 and Weinstein, 2002, for negative possible negative impacts of labour migration). As the reactions to the proposed EU directive on the liberalisation of services trade has shown, there is sometimes strong political resistance for these same reasons. The overall welfare of the EU can be expected to increase if the new member states allow EU companies to open new operations or relocate all or part of their operations to the new member states, especially when one uses the diminishing marginal returns to consumption concept, which states that an additional € income has a higher value for lower income groups. In this case, an increase in a € income of workers in the new member states exceeds the loss of a proportional amount of income in the higher income countries.
3.
Importance of the Industrial Sector in CEECs
The future of the industrial sector in the new member states is particularly important for these countries. During the communist period of centrally planned economies, the industrial sector (and particularly heavy industry) was a central pillar of the economy. The production of this heavy industry was however inefficient and out of line with needs and demand. The end of central planning brought the collapse of large sections of industry and an important restructuring process. Despite the changes, however, the industrial sector has remained both an important contributor to employment and an important sector of the economy. In both cases, the values are in most cases higher than in the EU15. The GVA of the industrial sector in the eight new members from Central and Eastern Europe was 26.3% and employment 24.01% compared to 18.3% and 21.2%1 respectively (Table 1 lists the results).
1
Excluding Portugal, for which no data were available.
ENLARGEMENT AND INDUSTRIAL COMPETITIVENESS | 3
Table 1. Share of employment and GVA of the industrial sector (excluding building and construction), 2003 Countries Share of GVA Share of employment Belgium 19.87% 15.23% Czech Rep 31.58% 30.72% Denmark 20.11% 16.07% Germany 24.39% 21.24% Estonia 21.51% 25.07% Greece 13.88% 15.92% Spain 18.65% 17.84% France 18.75% 15.62% Ireland 31.83% 16.72% Italy 21.58% 22.76% Cyprus 12.21% 11.07% Latvia 17.20% 18.85% Lithuania 24.82% 20.69% Lux 10.63% 17.72% Hungary 25.42% 25.66%
Countries Share of GVA Share of employment Malta 22.17% n/a NL 18.85% 12.94% Austria 22.82% 16.50% Poland 24.49% 21.15% Portugal 19.25% n/a Slovenia 30.15% 29.48% Slovakia 26.47% 26.16% Finland 25.10% 19.71% Sweden 22.94% 17.28% UK 19.50% 13.89% Bulgaria 25.52% n/a Romania 31.42% 25.48% EU15 21.20% 18.40% CEEC 8 26.30% 24.01%
Source: AMECO database.
It is rare for any old EU15 country to exceed a 20% share of employment, while for the new member states it is rare if they do not. In GVA terms, the difference is not so marked, even if for the EU15 the share is slightly lower. Considering the smaller economic size of the economies of the new member states and their larger share in employment, there is a clear indication that productivity in the industrial sectors is still low compared to the EU15. This analysis also indicates that if there were to be a convergence in productivity, the industrial sector, even if it developed still further, will most likely show no increase in employment; indeed, reductions are more likely. Given the large manpower involved in structural improvements in a country, there is a risk that when the construction boom starts to recede, there could also be a reduction in employment. Furthermore, in most countries a further move of labour out of the agricultural sector is expected. Consequently, the future unemployment situation in these countries will depend on the services sector. The prosperity of this sector will in turn depend on the economic growth of the country, which in the industrial sector can only be fostered through high technology and capital-intensive industries. The policy implications here are fairly clear, and are in line with the need to develop higher value-added industrial output, while facilitating the development of the service sector, even without the boost from the EU’s services directive.
4.
Factors Affecting Industrial Competitiveness in the New Member States
The competitiveness performance of the new member states during the accession process indicates several important trends. First, the countries have undergone a restructuring process whereby old inefficient industries have either been closed or modernised. A first wave of foreign direct investment (FDI) has concentrated on taking over the domestic market which the old industries covered. New, more export-oriented industries developed later, often in direct competition with established industries in the EU. The paper by Borbély (2005) describes how the accession economies were characterised at the beginning of the transition to a market economy by a low share of technologically advanced
4 | NÚÑEZ FERRER & KERNOHAN
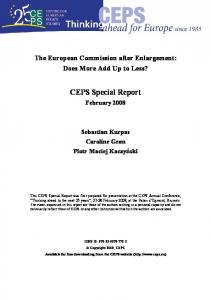
industries in production and exports compared to the EU. The transformation of the economy has caused large adjustments in the structure of the industrial sectors, shifting the trade pattern of the NM3 towards the EU. The share of exports of the middle to high technology sectors increased over time (from 1993 to 2001). While Poland and the Czech Republic still compete in lower- to middle-quality products with Greece and Portugal, Hungary has started competing with middle- to high-quality and technology products of Ireland and Spain. Wziątek-Kubiak & Magda (2005) show that the share of EU internal exports for the NM3 has increased steadily in the last few years (Figure 1). Furthermore the three countries account for most of the exports (Figure 2). Between 1996 and 2001, the Czech Republic, Hungary and Poland captured an increasing part of the increment of the EU-intra export of the 10 new member states. In 2001 their share in the total new member states export to EU-15 amounted to 77.3%. Their export to the EU-15 in the EU-25 intra export increased from 2.7% to 4.7%, i.e., by as much as 67%. This increase was at the costs of other new member states, as well as some EU producers. Figure 1. Share of NMC-3 in the EU-25 internal exports 1 .8 1 .6 1 .4
shares
1 .2 1
C zech H u n g a ry P o la n d
0 .8 0 .6 0 .4 0 .2 0 1995
1996
1997
1998
1999
2000
2001
y e a rs
Source: Wziątek-Kubiak & Magda (2005).
It is interesting to note that the Czech and Hungarian export markets are developing faster than Poland’s. In fact, Poland is slower in adapting to higher-value products. According to WziątekKubiak & Magda, this lag can be attributed to Poland’s higher unit labour cost compared with the other two countries.
ENLARGEMENT AND INDUSTRIAL COMPETITIVENESS | 5
Figure 2. Share of NMC-3 in exports of AC-10 to EU-15 35 30
shares
25 20
C zech H u n g a ry P o la n d
15 10 5 0 1995
1996
1997
1998
1999
2000
2001
ye a rs
Source: Wziątek-Kubiak & Magda (2005).
Despite the increased competition, the analyses of Wziątek-Kubiak & Magda (2005) conclude that the sectors in which the NM3 have been competing with the EU15 were already under restructuring. The enlargement accelerated the restructuring but did not provoke the restructuring of EU industries. Strong EU industries have taken over the markets of the weak NM3 industries, accelerating their restructuring in turn. Overall the enlargement has been speeding up improvements in efficiency on both sides. 4.1
Foreign direct investment
There are strong links between trade, FDI, innovation and competitiveness, which are of great relevance to the region. FDI in Central and Eastern Europe has been strong and increasing, despite a general worldwide decline during 2001 and 2002. These countries managed an increase of 15% during the same period, as the region provided a stable investment area. The first stage of the transition to a market economy was characterised by market-seeking FDI, used to buy underdeveloped non-tradable sectors, such as utilities, transport, communications, trade, financial intermediation and other services. The main motive was to exploit the first mover advantage to supply the domestic market. This contributed in the first instance to an increase in tariff barriers, as large companies negotiated higher domestic protection for the sector they were investing it. Thus the most advanced accession countries, like the NM3, negatively affected the trade balance in the first decade of transformation, rather than improving it (Barry, 2002). The situation has been gradually changing as FDI has shifted to develop export-oriented industries in these countries. However, the process is still in development. Several studies have shown that an important share of trade flows was caused by intra-industry trade of the investors, with roughly the same export to import ratio. Market-seeking investors, however, import more than they export, thus having a negative impact on the current account. The results of this project agree with the accumulating evidence that ‘related party trade’ (or foreign affiliate trade)
6 | NÚÑEZ FERRER & KERNOHAN
of MNCs (multinational companies) is a very important component of trade and dominates trade between OECD countries (Hamilton & Quinlan, 2004). A growing FDI sector in the most advanced acceding countries (Czech Republic, Hungary, Poland, Slovakia and Slovenia) increasingly targets logistical centres and R&D. Paradoxically, however, this FDI is small in volume, because most of these investments are directed to call centres, HQs and back offices, which need little investment. Nevertheless, new 'greenfield' investment is important to compensate for the reduction in FDI inflows due to the initial privatisation process. A result to be noted is that, despite the predictions of traditional trade theories that the new member states would concentrate on labour and resource intensive branches of industry, there is a shift towards higher technology and capital-intensive sectors. In fact, one of the key factors for new member states’ growth now and in the future is their ability to compete in the higher valueadded segment of the market. FDI is an essential input to improving productivity growth across sectors, but the composition of FDI is also very important, because it influences the relative prices of tradables. Whether FDI flows are directed to the tradable or the non-tradable sectors is a macroeconomic policy issue, as it affects balanced growth and employment. In fact, evidence shows that the success of a country in promoting growth through FDI flows depends on the type of FDI that is attracted. 4.2
Labour and labour productivity
The ability of the labour market to adapt to the changes in the economy is also a crucial factor in the development of a country’s competitiveness. A key to a successful transformation of the economy in the post-socialist countries has been labour mobility and transferable skills, to allow the restructuring of the economy away from the predominance of heavy industry and the primary sectors. There have been important shifts in employment and the value-added structures of the economic sectors in the new NM3, but the developments have not always been comparable. Hungary and the Czech Republic have managed a better transformation of the economy than Poland. The restructuring of the labour market has been weaker in Poland, with a large share of the workforce still in the primary sector and a large pool of unemployed unskilled workers. This is likely to remain the single most important barrier in Poland’s growth path. Lagging behind also are countries such as Lithuania and especially the candidates Bulgaria and Romania. Productivity studies clearly indicate that labour productivity in the Czech and Hungarian cases is higher: even if Poland’s labour productivity has risen more proportionally, the start is on a lower base. In fact, even in industry, the decline in the 1990s has halted and in Hungary it has even started to rise, indicating that CEECs such as Hungary are attractive locations for the industrial sector. In the Czech Republic, productivity in industry increased between 1997 and 2003 by 86%, while employment in the sector fell by 9.6%. The most dramatic changes have been seen in the automotive sector with productivity rising by 149% and the competitiveness of the sector in the EU25 has increased by 232% over the same period (Filipova et al., 2005). The countries where labour restructuring has been slowest also show the lowest productivity growth. According to Stephan (2000), as long as their employment structures do not align with the structure in the EU, their labour productivity will not rise above 50% of the EU average. Studies by Furmańska-Maruszak (2005) indicate that unit labour costs are one of the single most important variables in determining the competitiveness of products from the NM3 in the EU15. Results indicate that the most successful combination is high value production with low
ENLARGEMENT AND INDUSTRIAL COMPETITIVENESS | 7
labour unit costs, which is not surprising, since external competition is strong in the lower value-added production across sectors. The new member states also suffer from the competitive pressures of the emerging large Asian developing economies. This international competition reduces the ability of the new member states to compete in the EU in the lower value-added labour-intensive sectors. While proximity has a value, the margin is limited due to advances in transport and telecommunications. 4.3
Structural determinants for growth and competitiveness
According to Gros & Suhrcke (2000), the speed of development of a functioning market economy with growth potential depends also on the physical infrastructure available. Business development is hampered by infrastructure bottlenecks and thus higher transaction costs. As the ability to absorb advanced technology is also considered an important factor for the development of an economy, advanced infrastructures are needed to operate more effectively. Countries in Central and Eastern Europe benefited from the fact that central planning had developed infrastructure more than the wealth of these countries would warrant, compared to other countries of similar economic size. This has certainly assisted FDI flows and growth. In terms of infrastructure in relation to income, the new member states are already in a good position. One way to estimate the adequacy of the infrastructure in the new member countries relative to their income is to run the following cross-section regression using data from around 120 countries:2 (1)
Indicatori = α + β GNPpci + φ CEE8 + γ BALKAN + η CIS + ϕ ASEAN + εi,
with ‘i’ as the country-subscript, ‘Indicator’ stands for one of the infrastructure density indicators used here. The explanatory variables are, first, per capita income measured at PPP (‘GNPpc’) plus a series of dummy variables. ‘CEE8’ stands for the new member countries. The other regional dummies were included as controls: ‘SEE’ stands for South-Eastern Europe, i.e. the Balkans. The abbreviations ‘CIS’ and ‘ASEAN’ should be self-explanatory. The inclusion of the latter is a useful check on whether this group of high-growth countries stands out in terms of infrastructure (‘ε’ is the error-term). All variables – except the dummy variables – are in natural logarithms so that the coefficients can be interpreted as elasticities. Table 2. Regression results – Infrastructure link to GNP
Paved road network (% of all roads)a Rail network (km per surface area)a a
GNP per capita PPP 1.20**** (12.9) 0.71**** (11.3)
CEE8
SEE
CIS
ASEAN
R2
1.50*** (2.8) 1.42**** (11.4)
1.21**** (9.5) 1.34**** (11.4)
1.57**** (8.5) 1.08**** (4.8)
0.44 (0.9) -0.97**** (-2.8)
0.80 0.73
Additional explanatory variable: population density, 118 observations (1999 data).
Source: Gros & Suhrcke (2000). All variables are in logarithm. All standard errors are corrected heteroskedasticityconsistent. The symbols: *, **, ***, **** indicate coefficients that are significant at the 10%, 5%, 1% and 0.1% level, respectively.
2
For more details, see Gros & Suhrcke (2000).
8 | NÚÑEZ FERRER & KERNOHAN
The two indicators used here (the only ones available for a large number of countries) are: 1. the quality of the road network (proxied by the length of all paved roads as a share in surface area3) and 2. the density of the rail network (in km per surface area). The result is clear-cut: Table 2 shows that both indicators are closely related to income per capita, as one would expect. The key result for the present context is, however, that the dummy variable for the new member countries is in both cases positive, large and highly significant. Hence one can decisively reject the hypothesis that the new member countries do not have adequate infrastructure for their level of income. This does not indicate that the level is excessive or adequate in itself, but it is higher than in countries with a similar economic size. It is interesting that the dummy variables for all transition countries are positive. The heavy investment in physical infrastructure under the central planning system has apparently left a legacy in terms of the part of infrastructure that depreciates very slowly, like roads and rail networks. Finally, the dummy variable for the ASEAN group of countries is not significantly different from zero. High growth does not seem to be closely associated with a high density of infrastructure. The point estimates for the dummy variables suggest that the new member countries have a rail network that is approximately twice as extensive as one would expect. Against this point of view one might argue that the proper measure of the need for more infrastructure is the degree to which the current stock of public capital constitutes a brake on growth (as opposed to being adequate for the current level of income). One way to check whether this is the case is to look at the intensity of the use of the currently available road and rail infrastructure in the new member states. As there is no absolute standard or capacity limit in this area, all one can do is to compare infrastructure use in the old and the new member countries from Central and Eastern Europe. The available data are quite limited, but three indicators are available for the two main modes of transport (railways and roads). Railways. The two indicators presented below (see Table 3 with data for the year 2000) show a mixed picture: The number of persons carried by railways could double in some of the new member states before the existing network would approach the degree of capacity utilisation of the current EU-15. Constructing new railway lines for passengers is thus not a high priority. (Upgrading existing lines might be necessary, but this is much cheaper than constructing new lines.) In terms of freight transport, railway usage is somewhat higher in two out of the three larger new member countries shown in Table 3. But this is probably mostly a reflection of the still excessive importance of heavy industry in these countries (especially coal and steel in Poland). As their economies continue to modernise, the relative importance of railway transport, whose comparative advantage is in large volumes of heavy goods, will decline, as everywhere else, in favour of the more flexible road transport. In addition, the figures do not give any indication if the rail links are located according to today’s needed links. Roads. One straightforward indicator to measure the need for more roads is the number of cars per km of existing road. The data reported in the table below for the year 2000 show a similar result as for railways: there is ample free capacity in most new member countries. Congestion due to insufficient infrastructure is thus much more a problem for the EU-15 than for most candidate countries. As for railways, one can argue that the quality of the road network in the new member countries is lower than in the EU-15, but given the large difference in the density 3
For similar evidence on the cross-country relationship between road infrastructure and income, see Querioz & Gautman (1992) and Ingram & Li (1997). For the rail-income relationship, see also Canning (1999).
ENLARGEMENT AND INDUSTRIAL COMPETITIVENESS | 9
this difference in quality would have to be huge to compensate for the 2:1, sometimes 5:1 difference in motor vehicle density. Moreover, as argued above, it is much cheaper to improve and upgrade existing roads than to construct new ones. Table 3. Idle capacity on rails and roads?
EU-15 average Czech Republic Hungary Poland Turkey
Freight (in TKM) per km railway line 1.6 1.9 1.1 2.4 1.1
Passengers (in PKM) per km railway line 1.9 0.8 1.3 1.1 0.7
Passenger cars per km road 53.6 27.1 10.9 24.4 11.0
Source: Gros & Suhrcke (2000).
It is thus difficult to argue that public infrastructure is their main impediment to growth. Hence it is questionable that the candidates need more public investment relative to their income. However, the network of roads and rail may not fit the new economic structures, as industrial location has shifted in many cases. It indicates, however, that new member states should take care to do the necessary based ‘on the existing stock’, rather than neglecting the present potential.
4.3.1 Public investment and growth Within the EU one actually does not find any correlation between public investment and growth in GDP. Ireland, by far the fastest growing economy of the EU over the last decades, has a somewhat below-average ratio of public investment to GDP. One rough way to gauge the impact of public investment on growth is to look at the correlation between growth in real GDP and the share of GDP spent on general government investment. If one takes decade averages to iron out business cycle fluctuations, one finds the following: This correlation is negative or close to zero for the 1970s and 1990s. Only for the 1980s does one find a small positive correlation, which is however, due to the special case of Luxembourg. The growth literature in general has also not found a strong impact of publicly financed infrastructure investment on growth. Nevertheless, the quality of infrastructures is below the standards of EU member states and still presents a barrier to development. A large effort to upgrade the infrastructure accrues to the governments of these countries, which have inherited weak economies and a difficult budgetary situation. In fact, in the first years after liberalisation, the infrastructure of many countries suffered deterioration rather than an improvement. This trend has been reversed and the infrastructure is quickly being updated due to the increased growth of the economies combined with foreign aid, for which the EU is an important source. However, as the highly varying quality of the impacts of the EU structural operations have shown in the EU (or even lack of visible impact on growth), careful planning of the priorities and objectives for the investments in infrastructure is needed. Section 6.3 develops this issue further.
10 | NÚÑEZ FERRER & KERNOHAN
4.4
Governance
Governance is another key element for development and competitiveness, not least because it is a strong determinant for FDI. The impressive development performance of the new member states during their transition period since the early 1990s has been strongly influenced by the quality of governance. The EU accession process has allowed the candidate countries to anchor their policies to EU standards, the acquis communautaire. These have been a prerequisite for admission to the EU. It is interesting to note that all countries that have embarked seriously in the accession process have seen impressive economic growth. Applicant countries that have been laggards in improving governance, such as Bulgaria and Romania, have seen much weaker developments. Turkey is an even stronger case, as it is a solid market economy, which has applied for accession to the EU but has not introduced the necessary governance rules. Lack of prudential supervision and corruption has amongst other causes affected severely the growth performance of this economy. During the decade of 1995 to 2005, the country has been affected by various crises and per capita income has declined in real and nominal terms between 1995 and 2001 (Ameco database). Despite the impressive progress realised in many aspects of the structural and institutional framework, a lot needs to be done in most new member countries. Derviş et al. (2005) provide an analysis. The starting point is measured by data that reflect the situation at the turn of the century and shows the distance between the new (and aspiring members like Turkey) and the old EU-15 in the field of quality of governance. Table 4 shows the data on six different indicators of the quality of domestic economic governance obtained from the World Bank. The scores broadly reflect the level of development. The new members come out well below the EU15 average (higher values mean a better performance, i.e. more control of corruption, a more effective government, etc.), but there is also considerable variability among the new (and perspective) member states in all of the indicators used here. Romania and Bulgaria have similar values to Turkey. Table 4. Indicators of the quality of governance Country
Country2
EU-15 EU-27 Bulgaria Estonia Hungary Poland Romania Turkey
Government effectiveness
Political stability
Regulator y quality
Rule of law
Voice & account -ability
Mean STDEV
Control of corruptio n 1.70 0.52
1.67 0.43
1.15 0.31
1.57 0.26
1.58 0.42
1.42 0.20
BGR EST HUN POL ROM TUR
-0.17 0.66 0.6 0.39 -0.34 -0.38
-0.06 0.78 0.78 0.61 -0.33 -0.2
0.56 0.98 1.08 0.71 0.42 -0.61
0.62 1.35 1.21 0.67 0.04 0.08
0.05 0.8 0.9 0.65 -0.12 0
0.56 1.05 1.17 1.11 0.38 -0.47
Source: Derviş et al. (2005)
Table 5 provides a brief statistical analysis of the same data by normalising each variable to make the range comparable and then making a comparison with the old EU-15. For example, the value of minus 2.7 in the column ‘control of corruption’ means that if one compares the average new members from Central Europe to the EU-15, the value is almost three standard deviations below the EU-15 mean. In statistical terms this would be called an ‘outlier’, i.e. a
ENLARGEMENT AND INDUSTRIAL COMPETITIVENESS | 11
value that is so far from the average that should be considered belonging to a different set. In general, any entry above 2 in the lower part of Table 5 should be considered as showing that the country, or group of countries, is far away from the norm. Thus the table shows that the average value of the new members from Central and Eastern Europe is far away from the EU-15 values in all categories except political stability (where the value is only 0.9). If one compares Turkey to the EU-27, one sees that the distance separating Turkey from the EU-27 was about as large as the distance that separates the CEECs from the EU-15. This implies that when compared to averages of the enlarged EU, Turkey – before the reforms of the last three years – was in a class of its own with respect to the low quality of indicators measuring the quality of governance that have been quantified. Table 5. Summary statistics for indicators of the quality of governance Country
Country2
Mean STDEV Average CEEC normalised EU-15 Turkey normalised EU27 Turkey normalised EU15 EU-27
Control of corruptio n 1.1 0.8
Governmen t effectivenes s 1.2 0.7
Politica l stabilit y 1.0 0.3
-2.7
-2.7
-1.9 -4.0
Regulator y quality
Rule of law
Voice & accountabilit y
1.3 0.5
1.2 0.6
1.2 0.3
-0.9
-2.8
-2.5
-2.5
-2.0
-4.8
-2.6
-1.8
-5.1
-4.3
-5.8
-5.8
-3.8
-9.3
Source: Derviş et al. (2005).
While the quality of domestic governance is undoubtedly low, one might ask whether this does not represent simply the level of development of the country. Poorer countries in general have weaker institutions. Maybe these institutions will improve as income grows and the country develops. This is indeed what seems to have happened over the last years as documented in Figure 3. The general improvement one observes for the new member states (before they actually became members) occurred during a period that was dominated by accession negotiations. In this narrow sense there has thus been an improvement of ‘competitiveness’ in the new member countries. The opening of membership negotiations with Turkey could thus provide a similar impetus for improvement in the quality of governance in that country.
12 | NÚÑEZ FERRER & KERNOHAN
Figure 3. Change in composite quality of government indicator, 1996-2002 0.60
0.50
0.40
0.30
0.20
0.10
Turkey
Romania
Portugal
Poland
Latvia
Lithuania
Hungary
Croatia
Greece
Estonia
Slovak Republic
-0.20
Czech Republic
-0.10
Bulgaria
0.00
Note: Higher value means a better performance. Source: World Bank (2002).
4.5
Exchange rate dynamics
One principal concern in the area of exchange rates is the possibility of risks stemming from an imbalanced exchange rate regime. Particularly problematic is the aim of the new member states, in joining EMU, to enter the ERM II first. This is equivalent to a strong currency peg. Pegging the exchange rate to a foreign currency runs the risk of causing imbalances between the real and nominal exchange rates. A pegged currency also suffers from possible excessive foreign currency volatility. The studies undertaken (Vincentz, 2004; Welfens, 2005; Welfens & Borbély, 2004) analyse the exchange rate implications for competitiveness. Gros et al. (2002) also concentrate on the macroeconomic implications of exchange rate imbalances and EMU accession. During the early 1990s, a lively discussion took place on whether the ‘Club Med’ currencies were overvalued. There was no general agreement because the judgement depended, as usual, on the indicator and the base period used. The two indicators most often used to measure competitiveness are (and were then) the real exchange rate deflated by the Consumer Price Index (CPI) and by Unit Labour Costs (ULC). These two usually give different indications. In the case of Spain, it was argued that there was no need for a large exchange rate adjustment because there was no real overvaluation – but only if one used ULC as the competitiveness indicator and 1980 as the base period. Not surprisingly, this was the position taken by the authorities. A similar argument was used in the case of Italy, where there was also a large discrepancy between the ULC and the CPI-based measures. The new member states and other CEE candidates present a very similar picture. Depending on the base period and the indicator chosen, it can be argued that their currencies are overvalued by a very small margin or, on the contrary, by a very large margin. In the cases of the Czech Republic, Hungary and Estonia, the potential overvaluation is relatively small across most
ENLARGEMENT AND INDUSTRIAL COMPETITIVENESS | 13
indicators and base periods. Poland and Lithuania report much higher levels of real appreciation. In Romania, the CPI deflated exchange rate indicates a considerable overvaluation, whereas the ULC-based one points to an undervaluation. In the future, further trend real appreciation of candidate countries’ currency is expected. Strong appreciations have occurred especially in the Czech Republic (from December 2001 to April 2002 by more than 10%), Poland and also in Hungary (after the country widened the Forint fluctuation band). The argument that the CEE currencies cannot be overvalued because exports of most of the candidate countries keep growing quickly was also used in the case of Spain, where exports had actually doubled in dollar terms in the five years prior to 1992. This is typical of countries that have recently opened up to trade, such as the transition countries today or Spain in 1992, when it dismantled its last tariffs within the, then, EC. In such cases both exports and imports tend to grow strongly, whatever the exchange rate, since more and more sectors are exposed to international competition.4 These data suggest that sooner or later an exchange rate adjustment might be needed.5 What does this imply for the exchange rate policies pursued by these countries? For example, during the pre-accession period, Poland and the Czech Republic officially followed a floating exchange rate, accompanied by domestic inflation targets. They are thus in a different situation than Spain and Italy in the early 1990s, which were members of a fixed exchange rate adjustment, the ERM. In theory, an exchange rate adjustment could thus come about gradually and without disruption. However, experience has shown that large exchange rate adjustments almost always lead to some disruption in financial markets. This was the case even for Spain, which in 1992 had actually a rather large amount of room for manoeuvre under the ERM (Spain had margins of ±6%). A sudden large depreciation usually forces the central bank to increase interest rates to limit the domestic inflationary pressures that would otherwise worsen inflation. Moreover, the terms of trade shock (deriving from the depreciation) in combination with higher interest rates might initially lead to a contraction in demand (as in Italy and Spain). This in turn puts pressure on the budget, leading to higher deficits, which then might undermine confidence and thus aggravate the depreciation. However, such a negative spiral does not need to develop. The case of Greece shows that a smooth ‘glide path’ to EMU is possible. But it could be potentially dangerous for the candidate countries operating flexible exchange rate regimes to enter into an ERM-type arrangement that would tie their currencies to the euro before they have a clearer view of whether the current exchange rate levels are sustainable in the long run. The case of Greece, which successfully engineered a one-step surprise devaluation, is instructive in this regard. However, the real appreciation which is a natural consequence of the transition and catching-up process does not necessarily have to be damaging for the candidate countries. If it comes through the Balassa-Samuelson effect, it does not imply any loss of international competitiveness. Moreover, real appreciation may also reflect further trade integration and elimination of non-quality-related price differences. And lastly, it may generate pressure on the exporters to increase their productivity and improve performance and thus eventually lead to an increase in competitiveness. Figure 4 demonstrates that despite the considerable real
4
For an analysis of the experience of transitions countries, see De Broeck & Slek (2001). For further discussion of the potential for real appreciation in the transition economies, see Halpern & Wyplosz (2001). 5
14 | NÚÑEZ FERRER & KERNOHAN
appreciation, competitiveness (measured by real labour unit costs) has even increased in some of the candidate countries relative to the EU. Figure 4. Real labour unit costs (1996=100) 120
115
110
EU
105
CR Estonia 100
Hungary Latvia Lithuania
95
Poland
90
85
80 1995
1996
1997
1998
1999
2000
2001
Source: Gros et al. (2004).
4.5.1 Nominal convergence a la Maastricht The ultimate condition for membership in EMU is to achieve a certain degree of nominal convergence with the other members as stipulated by the Maastricht criteria. The EU institutions have so far made it clear that the criteria will have to be fully adhered to by the candidate countries in their run-up to monetary union. The motivation behind the formulation of the Maastricht convergence test was threefold. First, the EU countries wanted to create a stable low-inflationary, growth-friendly environment and hence the stress put on the level of inflation and interest rates. Second, the founders of EMU wanted to eliminate the risk of free-riding behaviour and thus they introduced the conditions limiting the size of budget deficits and the government debt. And eventually, the conditions regarding exchange rates were intended to test the stability of the currency in question and the appropriateness of the level of exchange rate vis-à-vis the other ERM countries. Despite the fact that the Maastricht criteria had been heavily criticised, they proved, at least in terms of the stabilisation of the public finances, rather successful. Indeed the EU countries managed in the run-up to EMU to bring the public deficits under control and those with a substantial government debt succeeded in bringing it down to more acceptable levels. Hence, as a consequence it can be expected that the current eurozone countries, together with the ECB and the European Commission, will insist on ‘stringent’6 adherence to the wording of the criteria. 6
Stringent in a sense that no formal changes to the criteria will be allowed. The interpretation of the criteria in the case of the incumbent EMU members was however a different story as a rather flexible approach was adopted. From this point of view, one could also expect a relatively benevolent approach
ENLARGEMENT AND INDUSTRIAL COMPETITIVENESS | 15
But many economists in this context call for some tailoring of the criteria so that they are more suited to the candidates’ specific situation (Pelkmans et al., 2000, Halpern & Wyplosz, 2001, Buiter & Grafe, 2002). They voice concerns that attempts to comply with the criteria in a relatively short time might prove to be destabilising for the CEECs and could potentially lead to a real divergence instead of catch-up.7 The latest softening of the budget deficit rules will not affect the new member states, as the entry criteria are the same. There are some inherent features of the candidate economies that make it difficult for them, if not impossible, to comply with the criteria in the short- to middle-term, but at the same time do not pose a risk to their overall stability and thus do not contradict their membership in the eurozone. An attempt to fulfil the criteria in a relatively short time might undermine the process of real convergence and potentially lead to a divergence. Thus an early entry in the eurozone, which most of the CEE candidates wish to achieve, would be endangered and the consequent economic disruptions might have an adverse impact on the incumbent member states themselves. Most objections and warnings are directed to the criteria concerning price stability, budget balance and exchange rate stability. Hence we deal with these now in turn.
4.5.2 The Balassa-Samuelson effect The candidate countries have in most cases a rather impressive record in bringing down inflation rates. Today, all of the countries have managed to achieve one-digit inflation rates and forecasts indicate that in the coming years the stabilisation of price level growth will continue. However, as is also apparent from the forecasts, inflation is expected to decline only modestly and stay at higher levels than those common in the EU and also the eurozone. This might have potentially important implications regarding the timing and strategy of accession of the candidate countries to EMU. When looking for the causes of this sort of inflation inertia, one has to resort to the theoretical framework of the Balassa-Samuelson effect to explain the trend appreciation of the real exchange rates in terms of productivity differentials in the tradable and non-tradable sectors of 8 an economy. The catching-up process in the candidate countries can be characterised by trend appreciation of their real exchange rates. Why is that so? The labour productivity in the candidate countries rises in most cases at a higher pace compared to the EU economies, and the large gap in price and productivity levels between the CEE candidates and the EU countries coupled with strong FDI inflows indicate that the faster productivity growth might be preserved in the future as well. towards the present candidates (or at least the candidate countries can use this fact in negotiations on entry). However, one also needs to bear in mind that this time the situation will be to a certain extent different. It can be assumed that the EMU membership of the current candidate countries will not be such a politically dominated issue as was the launch of EMU in 1999 and therefore more attention to the economic aspects will likely be devoted. This is also indicated by the rather cautious, if not discouraging, stance of the ECB in terms of timing of the entry into the eurozone. 7 Note that the EU uses the same line of reasoning but arrives at completely different conclusions: the enlargement of the Eurozone to the East should be postponed rather than adapting the criteria. 8 Another reason might be the still considerably high share of goods and services in the consumer basket whose prices are not fully determined by the free market forces (in Poland the share is estimated at almost 15% (Durjasz, 2001). This might be due to direct regulation or structural weaknesses. The case of regulated prices will not be further dealt with, as it is reasonable to expect that the prices will have been deregulated by the time the candidate countries enter the EU/EMU.
16 | NÚÑEZ FERRER & KERNOHAN
However, the high degree of trade integration implies that most of the increases are experienced in the tradable sector. The non-tradable sector benefits from increases in productivity only to the extent that non-traded goods and services enter the production of the traded goods as intermediate inputs, thus facing indirect competition. As the marginal product of labour in the tradable sector increases and prices are kept stable, due to the international competition, wages in the sector also tend to rise. The basic assumption of the model is that wages in the economy tend to be equalised. First, there exists, though in reality somewhat limited, labour mobility between the sectors and thus workers would move to better-paid jobs in the tradable sector, thus generating pressure towards equalisation. And further, trade unions also tend to make sure that the wage developments in the whole economy are more or less synchronised (Halpern & Wyplosz, 2001). Thus, the increase in wages in the tradable sector results in equivalent increases in the nontradable sector. However, the profitability of the non-traded sector facing rising wages and limited productivity increases cannot be retained without upward adjustment of prices of nontraded goods and services. Hence inflation in the non-traded sector tends to overtake inflation in 9 the traded sector (see Annex). At this point it is important to stress that the Balassa-Samuelson (B-S) effect is an equilibrium phenomenon which naturally occurs when an economy experiences economic growth. Through an adjustment in relative prices in the economy, an appreciation of the real exchange rate is achieved. Therefore, higher inflation generated by this process is in no way a threat to the monetary stability of a country, or its international competitiveness, and thus there is no need to counteract it by economic policies. It is of course important to know what the magnitude of the effect might be, or whether it occurs at all. A number of recent papers found evidence in favour of the Balassa-Samuelson hypothesis.10 Pelkmans et al. (2000) estimate that the inflation differential generated by the B-S might amount to between 3.5% and 4%. Halpern & Wyplosz (2001) arrived at a similar estimate of about 3.5%. Sinn & Reutter (2001) also report high levels of inflation which might be compatible with the Balassa-Samuelson effect. According to their estimates, the candidate countries might have inflation rates that are higher, by between 3% to 7%, than those in Germany – a country with the lowest difference between productivity in the tradable and nontradable sectors. Coricelli & Jazbec (2001) estimated the possible size of the effect for 19 transition countries and arrived at a conclusion that under the assumption of a yearly rate of real convergence between the transition countries and the EU of 2%, the B-S effect will result in real exchange rate appreciation of about 1%. The estimates of Halpern & Wyplosz (2001) vary between 2% and 2.2%. The Bundesbank (2001) arrived at estimates of 1.9% to 2.6%. 9
The magnitude of the effect also depends on the demand side effects. Rising increased productivity leads through increasing income and wealth to increases in consumption. If the demand for non-traded goods and services, as it is usually assumed because of their ‘superior’ character, rises at a higher speed than the demand for non-traded good, the price increases might be even further reinforced. 10 Typically, these studies have used econometric techniques to detect the existence of long-run relationships (co-integration) between relative price levels and relative productivity. In this framework, the direction of the applied studies has been twofold, first on the relationship between long-run changes in relative prices and productivity differentials across countries, while others analyse the link between the productivity differentials and inflation differentials across sectors within countries. The general conclusion of the first approach is that there is evidence of a relationship between the evolution of the relative price levels across countries and that of productivity differentials. Following the second approach, a clear causality between productivity growth in the traded goods sector and inflation in the non-traded goods sector has been identified.
ENLARGEMENT AND INDUSTRIAL COMPETITIVENESS | 17
Figure 5. Real effective exchange rate (p/ep*) dynamics in selected EU countries: Poland, Hungary, Czech Republic, Portugal, Spain and Ireland, 1990-2002 (1990=100)Source: 300
250
200
Poland
Czech Republic
150 Hungary
Portugal 100
Ireland Spain
50 1990
1991
1992
1993
1994
1995
1996
1997
1998
1999
2000
2001
2002
Welfens (2005).
Welfens (2005) confirms that the Balassa-Samuelson effect is of importance for Poland in particular, where the effective real exchange rate was more than twice the nominal value in 2002. With Poland strongly committed to enter the eurozone, this imbalance can have serious consequences for Poland’s growth in the future. These numbers show large differences which are due to the different methods applied, various sizes of the samples and the periods covered. Many are subject to various reservations regarding the very short time periods used in estimations which in addition were characterised by large structural changes. Also the division between the tradable and non-tradable sectors is hard to determine in practice. As a result studies use various techniques which make the results incomparable. Moreover, the estimates of the impact of the B-S effect on the CPI inflation might be further distorted as most of the studies are using GDP value-added distinction, which can be considerably different (Durajsz, 2001). Moreover, some of the assumptions on which the estimates are based, such as full labour mobility and resulting wage equalisation, are unrealistic which may tend to overestimate the overall impact of the B-S effect. Even when taking into account these reservations, it is obvious that the B-S effect can play an important role. The estimated values in most cases exceed the 1.5% limit given by the Maastricht inflation criteria. From this point of view, insisting on a strict adherence to the criteria seems to generate economic crises rather than achieve the desired stabilisation of the EMU candidate countries. If a new member state would wish to adopt the euro in the shortest possible time, as many of them have already proclaimed, it will be forced to suppress the inflation under the stipulated limit, which could mean generating recession. Of course, it can be argued that the effect will have a decreasing tendency in time, but given the large differences in economic levels between the CEE candidates and the EU and thus also productivity, it seems improbable that the gap would close sufficiently until the desired ‘€-day’ for some of them, such as 2009. Welfens (2005) also considers that the fixing of the exchange rate can be
18 | NÚÑEZ FERRER & KERNOHAN
detrimental, because non-tradable prices will be increasing in the long term, and keeping inflation under the Maastricht criteria will be difficult. The inflation problem could certainly be solved, at least temporarily, with the help of the flexible exchange rates. The undesired, in the light of Maastricht criteria, inflation differential could be compensated for by proportional nominal appreciation of the exchange rate. This might however be in breach of the criteria concerning the stability of exchange rates within ERM II. The relatively wide ±15% band could soon appear uncomfortably tight and an adjustment might be needed (Halpern & Wyplosz, 2001). However, it is noteworthy that this would be an upward adjustment whereas the inflation criterion only speaks of unilaterally decided devaluation. The reasoning behind the Balassa-Samuelson logic would thus advocate more flexibility regarding the upward adjustments. This would only be a temporary solution and after the entry into the eurozone the change in relative prices would be needed anyway. As a result inflation differentials will persist. Moreover, some of the new members have deprived themselves of this possibility by fixing their exchange rates in a form of conventional pegs or currency boards. Therefore, the appreciation of the real exchange rate can be achieved solely through changes in relative prices. These countries then have little possibility to limit overall inflation without resorting to price controls and generating recession at least in some sectors of their economies. From this point of view, an adjustment in the Maastricht criteria would be desirable without running the risk of damaging the commitment to price stability in the eurozone (Buiter & Grafe, 2001). The EU and member countries’ officials have so far been opposed to such proposals, arguing a principle of an equal approach to all countries.11 However, it is worth noting that no official intervention into the wording of the Treaty would be necessary as the quantification of the criteria is done in a separate protocol. (Pelkmans et al., 2000). The general conclusion one can draw from this partial survey is that the B-S effect exists. Therefore, if the inflation criterion remains without changes, the candidate countries that want an early membership at a fixed exchange rate will have to accept a period of reduced growth in order to reduce inflation temporarily. This might not be needed if they engineer the appropriate appreciation just before joining. But at any rate they will have to accept higher inflation later if the catch-up continues. The key question is how much. The earlier estimates were quite high in this respect. However, new evidence trying to disentangle the relative importance of various factors on the inflation differentials is somewhat more modest as far as the absolute values of expected B-S effects are concerned. Anyway, if the candidate countries decide not to push too much and wait, with the introduction of the euro, one good year might help them to get under the magical limit and they would be ‘in’ (Szapary, 2000, Pelkmans et al., 2000). This could, however, take somewhat longer than they would wish and could also bring along all the negative aspects of unfulfilled expectations, including financial market volatility, reverse capital flows and increased pressure on their currency. On the other hand, such an approach would require longer-term sound fiscal and monetary policies which would generally support the overall stability. The new member states face a difficult political trade-off: either implement restrictive policies to squeeze inflation during the qualification period for EMU or accept a delay in being able to join the euro.
11
This is after all not that surprising as the EU institutions do not even take into account the impact of the B-S effect on the interest rate differentials in the eurozone (Sinn & Reutter, 2001).
ENLARGEMENT AND INDUSTRIAL COMPETITIVENESS | 19
Gros et al. (2002) also warn that capital mobility and ‘fixed but adjustable’ exchange rates are difficult to manage, but this is the situation these countries will face while in the ERM II. They recommend tailoring the convergence criteria to the needs of these candidates to EMU.
5.
Government Policies in the NM3
Hashi (2004) has analysed the effectiveness of government interventions to assist the business sector since the start of transition. The NM3 countries have used state aid mechanisms extensively. The arguments for the use of state aid in the transition counties were based first on the needs of facilitating the process of transformation and systemic change. As time evolved arguments based on correction of ‘market failures’ or infant industry considerations have been put forward to continue a wide use of state aid tools. These have been tax incentives, subsidies or other interventions in the form of subsidised loans, grants and other investment schemes. The analysis shows a rather weak or negative impact in these countries. The three countries appear to have often suffered from the political failures of rent-seeking, regulatory capture and interest group pressure often present in government intervention. Furthermore, while state aid is a common and politically easy action, it is often not the most effective. Due to the difficulty of identifying the full costs and benefits of externalities to the policy, state aid has potentially harmed more than assisted the economy. An important intervention in these countries has been associated with assistance to the growth of small- and medium-sized enterprises (SMEs). While these have been correctly identified as an important motor for development, financial support is not the only mean to assist their development. Heavy entry barriers imposed by the state discourage the entry of entrepreneurs and these are important in the countries studied. In the initial years of transition, the state intervened heavily with state aid tools to ‘rescue and restructure’ ailing industries. This support has, according to Hashi (2004) and also Balcerowicz & Sobolewski (2005), not been successful, delaying rather than assisting restructuring and drawing resources from other sectors to do so. Industrial policy in this period was dominated by political considerations, which were especially strong during the difficult and unstable initial period of transformation. Resources were being diverted to cover running costs of loss-making firms with little or no effect on competitiveness. The EU imposed in the association agreements an obligation to eliminate distorting subsidies, bringing state aid in line with EU rules. This has forced a reduction of incompatible state aids, but the process has been uneven and difficult. Still today, due to the large number of schemes in place in these countries, regulatory bodies are unable to verify compliance. It is interesting to note that while most state aid in the EU is horizontal, i.e. open to all businesses fulfilling certain requirements, state aid in the MS3 is still dominated by sectoral aid. Interesting to note is that state aid in the form of tax exemptions, deferrals and soft loans and guarantees have particularly benefited multinational companies. State aid has been used to attract FDI and foreign companies rather than assist local companies. This is a case of intergovernmental competition and as far as it relocates operations from one EU country to another based solely on tax considerations it is of no net benefit to the EU. There is evidence that tax considerations are only one of a number of reasons for FDI in the countries. Tax concessions, when excessive, will not affect the decision of MNCs to operate in the country, causing just a loss in corporate tax revenues for the government. The studies also show several weaknesses in state aid schemes used for regional development. One of the main tools used has been the creation of SEZs. Studies for Poland suggest (Krynska, 2000) that the economic zones with their preferential tax schemes attracted operations from
20 | NÚÑEZ FERRER & KERNOHAN
other regions rather than creating new ventures, reducing strongly any employment benefits expected. An econometric model on the impact of state aid on competitiveness was performed by Hashi (2004) which indicates that state aid has negligible or negative effects on the overall competitiveness of the economies. Labour productivity and thus investment in human capital have in general had significant impact on competitiveness. However, Ambroziak (2005) challenges the present general position that state aid has to be horizontal and argues that targeted specific state aid offers better potential. The issue is better state aid rules and controls. He argues that the horizontal state aid effectiveness is not proven to be better. While the second argument is valid due to the limited empirical evidence of horizontal aid effectiveness, the first is questionable. In theory, if the government had superior information about the needs of companies and markets and were also operating altruistically and impartially, specific state aids could well be the most effective option. However, the track record of failures, vested interests and the ability of interest groups to capture the rents give sufficient evidence that while the horizontal aids may not been proven effective, specific aid granted by the state has also generally been proven ineffective.
6.
Policy Implications for the New Member States
This paper has highlighted the factors affecting a balanced growth and the competitiveness of the industrial sector in the new member states. FDI, human capital, appropriate labour market policies, infrastructures, entry barriers and governance, fiscal and exchange rate policies, all play a role in the development of competitiveness in the industrial sector. The speed and the success of transforming the industrial sector into a competitive and growth-contributing sector will depend on the interplay of the different factors. Many of the variables are highly influenced by government polices, positively as well as negatively. 6.1
Sectoral towards horizontal state aid and FDI promotion
Evidence suggests that state aid policies are overall damaging rather than assisting competitiveness of the industrial sector, because these, even if benefiting a specific sector are drawing resources which could be used with a better impact elsewhere. The opportunity costs are high. The shift from sectoral state aid support to horizontal measures should be continued, in line with EU support measures. Horizontal state aid based on criteria to promote entrepreneurship, such as for SMEs, should ensure that selection criteria target those ventures that are not only economically sustainable, but which for reasons of their location or other characteristics are not able to draw the financial resources from the private financial sector. State support should not substitute for the private sector where it operates effectively, but target market failure where it occurs. These countries should show more restraint in producing tax-based incentives for regional development. The impact of these is distorting and generally weaker than expected. The countries should consider as a first stage of assistance to SMEs to reduce the bureaucratic burden and heavy charges affecting them through institutional reform. This can be more effective than state aid and has been widely discussed in the literature. The World Bank has dedicated special attention to this issue, reporting important implications of the barriers to entry and other state imposed burdens on businesses (World Bank, 2002).
ENLARGEMENT AND INDUSTRIAL COMPETITIVENESS | 21
6.2
Human capital
One of the clearest messages of the studies is that the economic development of the countries will depend to an important extent on the more advanced technological sectors, which requires an increase in human capital quality and thus labour productivity. Basing growth on cheap labour-intensive industries is not a correct strategy for encouraging convergence with the EU economy. Labour market policies fostering labour mobility and transferable skills are primordial to a successful development of the countries and their industries. The new member countries should focus principally on human capital development measures that the EU European Social Fund (ESF) provides, avoiding an emphasis on simple financial transfers for the long-term unemployed. The employment policy has to be pro-active. Given the number of unemployed and particularly the young unemployed, training and skills leading to job placements should be a priority. 6.3
Infrastructure
Infrastructure is an important element in the development of a country, as it reduces the transaction costs for doing business. The EU Structural Funds have been conceived mainly to create the necessary environment for businesses to develop. However, badly planned infrastructure can negate the effects of large investment on the competitiveness of industries and the long-run growth of the economy. Infrastructure is also subject to the law of diminishing returns to the investment and the addition of infrastructure per se does not attract investment. Careful planning of infrastructure developments is essential, ensuring effective links between suppliers and markets. A thorough analysis of the needs and potential of each country and its regions is necessary to draw maximum benefit from the infrastructure developed. The quality of the National Development Plans and the associated Operational Programmes for the EU Structural Funds is a key element in the development of successful aid strategies. The new member states should ensure that the driving force behind the strategy is efficient allocation of resources, rather than a mere exercise of ensuring a prompt absorption of the EU funds. Given the size of the support relative to the government’s financial capacity, the efficient use of the Structural Funds is important. Public financing for infrastructure investment should be limited where possible. Given the changes in financial markets that have taken place over the last decade, it is now generally recognised that most infrastructure projects could also be financed and sometimes even operated with substantial private sector involvement. Major projects, such as motorways, are already undertaken on a mainly private-sector basis in the new member states. The merit of letting the private sector run at least some parts of what is traditionally subsumed under infrastructure is apparent in the telecommunications sector. It is interesting to note that despite running large budget deficits until the early 1980s, which led to a large build-up of public debt, supposedly justified by the need for public investment, growth in Ireland only started to ‘take off’ when this policy was abandoned and the deficits sharply reduced. All in all, there should thus be no presumption that the candidates would need to run large deficits on the grounds that they have a stronger need for infrastructure investment. 6.4
Governance
One of the key elements that have attracted FDI to the region is the improvement achieved in governance. Kinoshita & Campos (2003) have shown that for the new member states, variables such as external liberalisation, the rule of law and the quality of the bureaucracy have been the
22 | NÚÑEZ FERRER & KERNOHAN
most potent predictors of FDI. The accession process to the EU has introduced changes in the quality of institutions, increasing investor confidence. However, as the banking crisis in the Czech Republic has shown, further steps in improving prudential supervision is needed. An efficient and functioning bureaucracy and legal system are important prerequisites for further investment attraction. The quality of the domestic institutions is considered a key determinant of growth. 6.5
Exchange rate and monetary union
Section 4.5 has analysed the exchange rate implications for competitiveness based on the possible imbalances caused by the so-called Balassa-Samuelson effect. This effect can affect the real exchange rate and inflation in the new member states. However, new member states have announced their intention to join the eurozone as soon as possible, based on the expected benefits of a reduction in transaction costs for businesses and the positive signal it gives to the financial market about the stability of the currency. It is hoped in turn that this message will attract more FDI. The officials from the EU are calling for caution, however, as entry into EMU is accompanied by the Maastricht criteria for membership, which will require the new members to bring down the inflation differential while keeping a stringent fiscal discipline. Given the present situation in these countries and the Balassa-Samuelson effect, this is a sub-optimal policy approach. While the repercussions are not critical, the trade-off between the benefits of EMU membership have to be weighed against the implications of an adjustment that will be costly, like any disinflation policy is in the short-term. Gros et al. (2002) consider that the Maastricht criteria on nominal exchange rate convergence are not in line with the needs of the member states. The new member states face a difficult political trade-off: either implement restrictive policies to squeeze inflation during the qualification period for EMU, or accept a delay in being able to join the euro. Gros et al. (2002) also warn that capital mobility and ‘fixed but adjustable’ exchange rates are difficult to manage, but this is the situation these countries will face while in the ERM II. They recommend tailoring the convergence criteria to the needs of these candidates to EMU.
7.
Implications of Enlargement for Competitiveness in the EU15
The enlargement process brings opportunities for the EU15, as the market increases, but also introduces changes into the EU capital and labour markets and possible competition with some growing industries of the CEECs. Some of these changes will necessitate some adaptation and restructuring in the EU15, is due to the rising potential of the new member states to compete in the same product groups as older member states. As these countries are still largely producing low- to medium-technology products, they appear to be potential competitors to the EU cohesion countries and cause trade and welfare losses to them (Baldwin 1994, Baldwin et al., 1997, Emerson & Gros, 1998, Egger & Kratena, 2003). The early studies by Baldwin and Emerson and Gros pointed to a competitive disadvantage for Portugal, directly clashing in its major items of production of textiles and clothing with the competitive sectors of the accession countries. The top exports from Portugal – clothing, mechanical vehicles, electrical goods and footwear – are sectors in which the transition countries also strongly developing, i.e. the labour-intensive, low- and medium-technology sectors.
ENLARGEMENT AND INDUSTRIAL COMPETITIVENESS | 23
Borbély (2005) analyses trade between the EU15 and the 10 new member states, and trade between the NM3 and the EU15. The results show that some industrial sectors at the core of the EU face crowding-out effects, although Greece and partially Spain is also facing competitive risks. Portugal shows surprisingly no competitive disadvantage. In any event, the trade vulnerability analysis shows that the implications are not heterogeneous for all member states. The studies show that while multinational companies of the EU15 member states have benefited from the increase in trade with the new members and by relocating some operations to them, some sectors will have to restructure, including a number of ‘sensitive’ sectors according to the EU, either due to their vulnerability or strategic importance.
8.
Policy Implications for Member States
Governments of the EU have shown increasing concern in the last decade over the competitiveness of their industrial sector and their economy in general. EU member states have hoped that the increasing size of the internal market would increase growth rates in the EU without the need for difficult and unpopular structural changes. The increase in size of the single market, while increasing economic opportunities for Europe, may increase the need for fundamental reforms in member states. Studies have shown that policies to subsidise sectors in decline do not generally improve their prospects but simply delay their restructuring, causing longer periods of decline and a more painful adjustment in the end (Hashi, 2004). The area in which the member states can give an important contribution to competitiveness is by improving the business environment in the EU, by improving the regulatory framework. Various member states have an unfriendly business environment and reducing their bureaucratic and often excessive tax and social contributions could give a initial spur to the economy. In addition, labour market policies in many member states do not encourage the necessary adjustments to the capacity of the workforce. This rigidity creates disincentives for companies to hire workers and can discourage the operations of companies in areas undergoing rapid change, such as high-tech industries. Less rigid and more active unemployment and training schemes are required to facilitate the economic adjustment of enterprises to the increasingly changing market environment. Member states’ commitment to education and R&D investment has to increase. These are keys to economic development. An important factor to unleash the innovation potential is introducing a system of finance based on competitive tendering and excellence. Links between industries and research centres should be fostered. As proposed by the European Commission (COM 487 final, p 16), countries and regions should provide a strategic reference document defining the objectives and priority actions. This strategic framework should outline the actions necessary. Member states should ensure that the objectives are effectively reached. It is necessary that member states deliver on actions they have committed themselves to follow, such as the Lisbon strategy. Member states’ industrial policy should be geared towards creating the necessary physical environment for industries to develop and prosper. Infrastructure is an important reference point. Investment can be concentrated in developing centres of excellence, ensuring that their location is logical. The location of firms, provision of infrastructure and other key elements should be based on a well-integrated strategy, such as the strategic reference framework mentioned above.
24 | NÚÑEZ FERRER & KERNOHAN
Industrial policy based on state aid, tax incentives or other forms of soft-credit concessions should be limited and, if used, based on stringent criteria and for a strictly limited period of time. These should also not replace the private financial markets where available. Assistance should always aim at restructuring and adapting industries to new challenges and not sustain their losses. In the single market, actions to support domestic industries should not be undertaken with the aim of artificially undercutting competitors from other member states. This is already an obligation under EU competition law, but the stringency of its application is variable. Finally, one of the main barriers for competitiveness in Europe is the underdeveloped services market. The growth potential of Europe lies to a large extent in developing this sector. Gros et al. (2004) clearly indicate that too much capital in the EU is immobilised in the declining sectors (mainly industry) and too little in growing sectors. It is important to mention this even if the study is centred on industrial competitiveness. It is also interesting that the free movement of industrial goods is a reality, while services are largely landlocked. A competitiveness policy centred on assistance to industry risks being detrimental if it comes at the expense of investment in growing sectors. The relevant opportunity costs have to be considered seriously. Improving the services sector, being a large employer and an important sector for the overall economy, even for industry, can bolster overall competitiveness. Industry and services are not independent, but interdependent. A better service growth also bolsters overall demand. Member states should find the courage to remove trade barriers in the services sector, which the European Commission proposed with the Services Directive (COM(2004) 2 final/3). This move is overdue, as lack of progress is contrary to single market aspirations. In aggregate 60 to 70% of the EU’s economic activity depends on the services sector, and thus limiting the free provision of services undermines prospects for growth and competitiveness. There will undoubtedly be transitory adjustment periods, but improved services provision in the EU will benefit the competitiveness of Europe across the board. As we have seen, future employment creation in the new member states will largely depend on the development of services. This is also true for the rest of the EU, but the scale of potential labour restructuring needs is a particular challenge for the new members. Without a strongly developing services sector there is a risk of mounting unemployment.
9.
Policy Implications for the EU
The European Union has shown concern over the general weaknesses in competitiveness in the EU. This is reflected in the policy proposals of the EU in the Financial Perspectives (COM(2004)101 final) and the subsequent Communication (COM(2004)187 final) and the calls for better policy coordination in the Treaty Establishing a European Constitution (Articles I-15 and I-17). While these proposals have positive aspects, the way these are implemented in practice will have a large impact on their effectiveness in promoting industrial competitiveness. The European Commission has rightly pinpointed the economic weaknesses hampering the reaping of the full benefits of the internal market. To fully exploit the single market, the fragmented national systems in many economic areas have to be removed. Furthermore, commitments by the member states to work towards EU actions, such as the Lisbon strategy, fail to be followed up by the member states. The free provision of services is a crucial element for enhancing growth and competitiveness in Europe, and this report underlines the importance to renew the efforts to implement the Services Directive.
ENLARGEMENT AND INDUSTRIAL COMPETITIVENESS | 25
9.1
Policy coordination
The studies have revealed that before considering any state intervention in support of the industrial sector, the EU could already achieve advances by pushing for the reduction in the non-tariff barriers that still exist. But these trade barriers are not the only items undermining EU growth. There is a certain lack of transnational cooperation that leads innovation and industrial structures to be more fragmented than they should be. The EU can play a role in improving cooperation here. The EU should put pressure to increase macroeconomic, labour and fiscal policy coordination, especially in the eurozone. The ECB can lead a dialogue (Gros et al., 2004) on non-inflationary sustainable growth policies. While macroeconomic policies in the member states should reflect their circumstances, policy conflicts and inconsistency between the member states and EU objectives should be minimised. The European Commission’s request for more policy coordination is understandable, but there are limits to this process. A one-size-fits-all approach to macroeconomic policy, based on bureaucratic assessments, is risky. There is however a case for reinforcing the role of strategies and the enforcement of their implementation when countries commit themselves to an objective such as the Lisbon strategy. 9.2
Cohesion and structural Funds
There is evidence that an appropriate level of infrastructure is necessary to develop the economic potential of the new member states, improving the economic environment for the industrial sector. Some of the new countries still require important investments. However, neither the ‘absorption capacity’ of a country nor the level of aid – indicators often used as proxies for a countries development capacity – is sufficient to predict success in developing the national or regional economy. The economic and industrial development of a country depends on the appropriate mix of policies and investments. Structural Fund operations, if wisely allocated, can create the necessary market signals for enterprises. However, development is created neither by decree nor by accumulating infrastructure in specific areas alone. It is thus of paramount importance that the structural investments are based on a sound overall economic analysis and strategy, ensuring that the size and direction of the funds invested are in relation with the real endogenous potential of the areas assisted. The European Commission should ensure that development plans and Operational Programmes are not only drafted to be able to successfully absorb the funds offered by the European Union, but that the strategies underlying the use of EU aid are sound and robust. To do so the European Commission should reinforce the ex-ante economic evaluation capacity, as well as the subsequent monitoring and ex-post evaluation. This is especially important in the new member states where a substantial share of government funds for investment and development are linked to co-financing EU operations. Thus, the National Development Plan and the Operational Programmes ensuing from it become the main development strategy of the country. Given this situation, the Commission should ensure that EU assistance is appropriate and coherent. It is also important to understand the macroeconomic policy context of the country, to ensure that investments are not aimed at sectors that fail to develop due to policy failure rather than a lack of investment. The work by Hashi (2004) has clearly described such cases. This might create conflicts of competence arising from the subsidiarity principle in the preparation of plans and place limits on the Commission’s competences. The Commission and
26 | NÚÑEZ FERRER & KERNOHAN
member states may disagree on the strategies. It is thus important to create an improved dialogue between the member states and the Commission, as well as a better guidance of the objectives of the funds. 9.3
The Lisbon Agenda
The EU has failed to agree on a strong financial intervention by the European budget to promote investments in R&D, while this is considered a key factor for European economic development. It is important that the member states increase their support for innovation, as this is one of the few fields were Europe still has a certain competitive edge in the world market. Subsidies are however not the only action possible. Some member states should also improve their internal market, by reducing bureaucratic and tax burden on companies. 9.4
Assessment for the EU
The policy competences of the EU cannot by themselves propel European competitiveness; the full participation of the member states is crucial. Economic strategies approved by member states have to be followed and enforced, which is currently not the case. The EU also needs to develop further the strategic character of its budget interventions, moving away from the simple redistribution and ‘absorption capacity’ of funds more towards efficiency and results-driven approaches, across all policies.
10. Conclusions This paper has discussed the main challenges that the further development of the industrial sector poses for the new member states and for the old EU15. The principal messages emerging from the papers is that industrial competitiveness in the new member states will depend on the level of innovation and their capacity to develop high-technology products. The results of the studies do not encourage a heavy intervention by the state, as this has not been successful in the past and often damages rather than assists the economic development of the country. Rather, the state should aim to ensure that the investment climate in the country is positive. Furthermore, the decline of the agricultural sector, combined with a rise in productivity in industry along with a reduction over time of the building and construction sectors, may be likely to put pressure on the labour market. Hence, the development of the services sector is crucial for these countries. But efforts and changes are not only required from the new member states. The development of the services sector in Europe holds the key to improving European competitiveness in general. For the new member states this has particular relevance. There is a need for the old members of the EU to adapt, restructure their labour markets and implement the revised Lisbon strategy. This paper recommends improving the business environment in the member states and also completing the single market for services, thus implementing the services directive to allow the EU to develop its economic potential.
References Ambroziak, A.A. (2005), “State Aid as an Instrument for Reinforcing Competitiveness of Polish Undertakings. Necessity for Retargeting of the Granted Aid?”, paper presented at the final conference of the project on Changes in Industrial Competitiveness as a Factor of Integration: Identifying Challenges of the Enlarged Single European Market, CEPS, 2526 November, Brussels. Balcerowicz, E. and M. Sobolewski (2005), “Competitiveness of the Polish Manufacturing Sector: Does Government Policy Matter?”, paper presented at the final conference of the project on Changes in Industrial Competitiveness as a Factor of Integration: Identifying Challenges of the Enlarged Single European Market, CEPS, 25-26 November, Brussels. Baldwin, R. (1994), Towards an Integrated Europe, London: Centre for Economic Policy Research (CEPR) and Cambridge: Cambridge University Press. Baldwin, R., J. Francois and R. Portes (1997), “The Costs and Benefits of Eastern Enlargement: The Impact on the EU and Central Europe”, Economic Policy, No. 24, April, pp. 125-176. Barry, F.G. (2002), “EU Accession and Prospective FDI Flows to CEE Countries: A View from Ireland”, in Robert E. Lipsey (ed.), Real and Monetary Aspects of FDI in Industrial Countries, Deutsche Bundesbank/Springer Verlag. Borbély, D. (2005), “Foreign Trade Specialization on the EU Market: Dynamics, Determinants and Competitiveness”, paper presented at the final conference of the project on Changes in Industrial Competitiveness as a Factor of Integration: Identifying Challenges of the Enlarged Single European Market, CEPS, 25-26 November, Brussels. Buiter, W. and C. Grafe (2002), Patching up the Pact: Some Suggestions for Enhancing Fiscal Sustainability and Macroeconomic Stability in an Enlarged European Union, CEPR Discussion Paper No. 3496, Centre for Economic Policy Research, London. Canning, D. (1999), Infrastructure’s contribution to aggregate output, World Bank Policy Research Paper No. 2246, World Bank, Washington, D.C. Coricelli, F. and B. Jazbec (2001), Real Exchange-Rate Dynamics in Transition Economies, CEPR Discussion Paper No. 2869, Centre for Economic Policy Research, London. Davis, D.R. and D.E. Weinstein (2002), Technological Superiority and the Losses From Migration, NBER Working Paper No. 8971, National Bureau of Economic Research, Cambridge, MA, June. Derviş, K., M. Emerson, D. Gros and S. Ülgen (2004), The European Transformation of Modern Turkey, CEPS Paperback, Centre for European Policy Studies, Brussels. Deutsche Bundesbank (2001), “Monetary Aspects of the Enlargement of the EU”, Monthly Report, October. Durjasz, P. (2001), “How to balance real and nominal convergence? The case of Poland”, paper presented at the East-West Conference of the Austrian National Bank, Vienna, 5-6 November. Egger, P. and K. Kratena (2003), “A Tale of Competition between Eastern and Southern Europe, Review of Word Economics”, Weltwirtschaftliches Archiv, Vol. 139, No. 1.
| 27
28 | NÚÑEZ FERRER & KERNOHAN
Emerson, M. and D. Gros (1998), Impact of Enlargement, Agenda 2000 and EMU on Poorer Regions, The Case of Portugal, CEPS Working Document No. 125, Centre for European Policy Studies, Brussels. European Commission (2001), European Competitiveness Report 2001, Eur-Op. European Commission (2002a), Communication from the Commission on Streamlining the Annual Economic and Employment Policy Coordination cycles, COM(2002) 487 final. European Commission (2002b), Proposal for a Directive of the European Parliament and the Council on services in the internal market, COM (2004) 2(03). European Commission (2004a), Communication from the Commission to the Council and the European Parliament – Financial Perspectives 2007 – 2013, COM(2004) 487 final. European Commission (2004b), Communication from the Commission to the Council and the European Parliament on Building our common Future – Policy challenges and Budgetary means of the Enlarged Union 2007-2013, COM(2004) 101 final. Filipová, L., G. Jaromír and M. Šimek (2005), “Impact of Changes in Competitiveness on Czech Labour Market Developments”, paper presented at the final conference of the project on Changes in Industrial Competitiveness as a Factor of Integration: Identifying Challenges of the Enlarged Single European Market, CEPS, 25-26 November, Brussels. Global Competitiveness Report (1996), World Economic Forum, Geneva. Gros, D. and M. Suhrcke (2000), Ten Years After: What is so special about Transition Countries?, HWWA Discussion Paper, No. 86, Hamburg. Gros, D. et al. (2002), The Euro at 25, Special Report of the CEPS Macroeconomic Policy Group, with Niels Thygesen, Massimiliano Castelli, Thomas Mayer, Juan F. Jimeno and Roberto Perotti, Centre for European Policy Studies, Brussels, December. Gros, D. et al. (2004), Breaking the Reform Deadlock, 6th Annual Report of the CEPS Macroeconomic Policy Group, with Niels Thygesen, Massimiliano Castelli, Thomas Mayer, Juan F. Jimeno and Roberto Perotti, Centre for European Policy Studies, Brussels. Halpern, L. and C. Wyplosz (2001), “Economic Transformation and Real Exchange Rates in the 2000s: The Balassa-Samuelson Connection”, paper commissioned by the Secretariat of the United Nations Economic Commission for Europe and published as Chapter 6 in Economic Survey of Europe, No. 1., UN/ECE, Geneva, September. Hamilton, D. and J. Quinlan (2004), “Partners in Prosperity: The Changing Geography of the Transatlantic Economy”, Centre for Transatlantic Relations, Johns Hopkins University, Washington, D.C. Hashi, I. (2004), The Comparative Analysis of State Aid and Government Policy in Poland, Hungary and the Czech Republic, CASE (Centre for Social and Economic Research), Warsaw. Ingram, G.K. and Z. Li (1997), Motorization and road provision in countries and cities, World Bank Policy Research Paper No. 1842, World Bank, Washington, D.C. Kinoshita, Y. and N.F. Campos (2003), Why Does FDI Go Where it Goes? New Evidence from the Transitional Economies, CEPR Discussion Paper No. 3984, Centre for Economic Policy Research, London. Krynska, E. (2000), Polskie Specjalne Strefy Ekonomiczene (Polish Special Economic Zones), Warsaw: Wydawnictwo Naukowe Scholar.
ENLARGEMENT AND INDUSTRIAL COMPETITIVENESS | 29
Pelkmans, J., D. Gros and J. Núñez Ferrer (2000), Long-run Economic Aspects of the European Union’s Eastern Enlargement, Working Document, Netherlands Scientific Council for Government Policy (WRR), The Hague. Querioz, C. and S. Gautman (1992), Road infrastructure and economic development: Some diagnostic indicators, World Bank Policy Research Working Paper No. 921, World Bank, Washington, D.C. Sinn, H-W and R. Michael (2001), The Minimum Inflation Rate for Euroland, NBER Working Paper No. 8085, National Bureau of Economic Research, Cambridge, MA. Stephan, J. (2000), EU-Integration and Development Prospects of CEECs. The ProductivityGap and Technological Structural Change, Papers 112, American Cairo - Economics and Political Sciences. Szapary, G. (2000), Maastricht and the choice of exchange rate regime in transition countries during the run-up to EMU, NHB Working paper No. 7, National Bank of Hungary, Budapest. UN, Economic Commission for Europe (2001), Economic Survey of Europe 2001, Chapter 6, United Nations, New York and Geneva. Vincentz, V. (2004), “A Note on Relative Prices, Investment and Productivity”, contribution prepared for the project on Changes in Industrial Competitiveness as a Factor of Integration: Identifying Challenges of the Enlarged Single European Market, February. Weinstein, D.E. (2002), “Migration for the Benefit of All”, International Labor Review, Vol. 141, No. 3. Welfens, P.J.J. (2005), “Impact of the Real Exchange Rate on Trade, Structural Change and Growth”, paper presented at the final conference of the project on Changes in Industrial Competitiveness as a Factor of Integration: Identifying Challenges of the Enlarged Single European Market, CEPS, 25-26 November, Brussels. Welfens, Paul J.J. and D. Borbély (2004), “Exchange Rate Developments and Stock Market Dynamics in Transition Countries: Theory and Empirical Analysis”, paper prepared as part of the 5th Framework Programme Changes in Industrial Competitiveness as a Factor of Integration: Identifying Challenges of the Enlarged Single European Market, EIIW, Wuppertal, Germany. World Bank (2002), Transition – The First Ten Years, World Bank, Washington, D.C. Wziątek-Kubiak, A. and I. Magda (2005), “Differentiation of changes in competitiveness among Polish manufacturing industries”, paper presented at the final conference of the project on Changes in Industrial Competitiveness as a Factor of Integration: Identifying Challenges of the Enlarged Single European Market, CEPS, 25-26 November, Brussels.
Annex. The Balassa-Samuelson Effect The evolution of the real exchange rate due to the Balassa-Samuelson effect can easily be depicted by several equations. The real exchange rate can be written as:
sr = ε + π * −π where ε is the rate of expected depreciation of the nominal exchange rate, π and π* are the inflation rates (based on the CPI index) in the transition country and eurozone, respectively. The overall inflation rate can be decomposed to inflation rate in the traded sector and inflation rate in the non-traded sector, πT and πN, respectively. Also in this case the asterisk will denote the eurozone. α will be the share of the tradables in the CPI index and its composition is assumed to be the same in the transition country and the eurozone. Thus,
π = απ T + (1 − α )π N and π * = απ T * + (1 − α )π N * . From this it follows that:
s r = ε + απ T * + (1 − α )π N * − απ T + (1 − α )π N . Due to the international arbitrage, it must hold that the inflation rate of domestic tradable goods is equal to the inflation of the eurozone tradable goods plus the expected rate of depreciation. Therefore,
π T = π T* + ε Then we can find that:
[
]
sr = −(1 − α ) (π N − π T ) − (π N * − π T * ) . From this it follows that the real exchange rate will appreciate if the difference between the excess inflation in the domestic non-tradable sector over the tradable sector is larger than that in the eurozone. And the higher differences in productivity levels in the transition countries compared to the eurozone indicate that that will probably be the case. The gap between the GDP per capita levels in the candidate countries and their EU partners is very wide. Thus there is large potential for catching–up and productivity increases.
| 30
Bookshop: http://shop.ceps.be
About CEPS Founded in 1983, the Centre for European Policy Studies is an independent policy research institute dedicated to producing sound policy research leading to constructive solutions to the challenges facing Europe today. Funding is obtained from membership fees, contributions from official institutions (European Commission, other international and multilateral institutions, and national bodies), foundation grants, project research, conferences fees and publication sales. Goals •
To achieve high standards of academic excellence and maintain unqualified independence.
•
To provide a forum for discussion among all stakeholders in the European policy process.
•
To build collaborative networks of researchers, policy-makers and business across the whole of Europe.
•
To disseminate our findings and views through a regular flow of publications and public events.
Assets and Achievements •
Complete independence to set its own priorities and freedom from any outside influence.
•
Authoritative research by an international staff with a demonstrated capability to analyse policy questions and anticipate trends well before they become topics of general public discussion.
•
Formation of seven different research networks, comprising some 140 research institutes from throughout Europe and beyond, to complement and consolidate our research expertise and to greatly extend our reach in a wide range of areas from agricultural and security policy to climate change, JHA and economic analysis.
•
An extensive network of external collaborators, including some 35 senior associates with extensive working experience in EU affairs.
Website: www.ceps.be
Programme Structure CEPS is a place where creative and authoritative specialists reflect and comment on the problems and opportunities facing Europe today. This is evidenced by the depth and originality of its publications and the talent and prescience of its expanding research staff. The CEPS research programme is organised under two major headings: Economic Policy Macroeconomic Policy European Network of Economic Policy Research Institutes (ENEPRI) Financial Markets, Company Law & Taxation European Credit Research Institute (ECRI) Trade Developments & Policy Energy, Environment CENTRE FOR& Climate Change EUROPEAN Agricultural Policy
C
POLICY
Politics, Institutions and Security The Future of Europe Justice and Home Affairs The Wider Europe South East Europe Caucasus & Black Sea EU-Russian/Ukraine Relations Mediterranean & Middle East Place du Congrès 1 ▪ B-1000 Brussels CEPS-IISS European▪ Fax: Security Forum Tel: (32.2) 229.39.11 (32.2) 219.41.51
www.ceps.be ▪
[email protected] STUDIES E In addition to these two sets of research programmes, the Centre organises a variety of activities
within the CEPS Policy Forum. These include CEPS task forces, lunchtime membership meetings, network meetings abroad, board-level briefings for CEPS corporate members, conferences, training seminars, major annual events (e.g. the CEPS Annual Conference) and internet and media relations.
P
S