Challenges for Data Mining on Sensor Data of Interlinked Processes Marco Stolpe and Katharina Morik Chair of Artificial Intelligence (LS 8) Department of Computer Science TU Dortmund University, Germany
[email protected] [email protected]
Benedikt Konrad, Daniel Lieber and Jochen Deuse Chair of Industrial Engineering Department of Mechanical Engineering TU Dortmund University, Germany
[email protected] [email protected] [email protected]
Abstract In industries like steel production, interlinked production processes leave no time for assessing the physical quality of intermediate products. Failures during the process can lead to high internal costs when already defective products are passed through the entire value chain. However, process data like machine parameters and sensor data which are directly linked to quality can be recorded. Based on a rolling mill case study, the paper discusses how decentralized data mining and intelligent machine-to-machine communication could be used to predict the physical quality of intermediate products online and in real-time for detecting quality issues as early as possible. The recording of huge data masses and the distributed but sequential nature of the problem lead to challenging research questions for the next generation of data mining.
1
Introduction
The creation of high-quality products demands a continuous monitoring of quality properties along the process chain. Certain industries, e.g. steel production, put a constraint on the available time between processing steps. In such interlinked production processes, goods are processed sequentially in a defined number of stations and given order. Here, examining the physical properties of a product between stations is often too time-consuming or even impossible. However, if the quality can only be checked at the end of the process, an already defective product might be unnecessarily passed through the entire value chain, consuming energy and causing machine deterioration, as well as rejection and reworking costs [4, 6, 8]. Since the quality of the final product depends on how it was processed, the quality-related physical properties of intermediate prod-
ucts may be predicted by models based on recorded process data. This data can include process parameters from the machines themselves as well as measurements from additional sensors. Ideally, prediction models would be deployed directly at the sensors and their prediction results sent over a network to subsequent machines in real-time. These could then decide on the further processing. For example, products that cannot reach the desired quality anymore could be scrapped. Data mining already has been successfully used for the automatic detection of faulty processing modes, based on similar process data. However, as will be explained, the prediction of quality-related product properties in interlinked production processes differs from the detection of faulty modes in several respects. Research questions arise that challenge state-of-the-art methods in data mining. This paper is arranged as follows: Section 2 introduces a rolling mill case study and describes its process chain, the recorded data and the accompanying data mining task. Section 3 explains the differences between fault detection and quality prediction. It then poses challenging new research questions for selected phases of the data mining process. First efforts to solve these questions and preliminary results are presented in Sect. 4. At the end, we conclude and discuss future work.
2
Case Study: Rolling Mill
The rolling mill case study described in the following sections is provided by a leading German steel producer. It is representative for the data mining challenges discussed in this paper.
2.1
The Process Chain
Beginning with continuous casting or ingot casting in the steel mill, stainless steel long products are processed se-
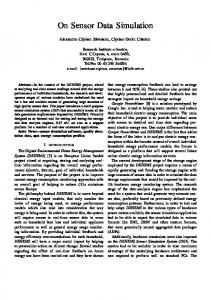
Process Chain
Steel block
Rotary hearth furnace
Block roll
Finishing roll 1
Finishing roll 2
Separation facility
Cutted steel rods
Ultrasonic Heat treatment tests (optional)
Data
Temperature
Velocity Speed Force Grooves
Metallurgical quality properties
Figure 1. Process chain of a rolling mill
quentially while passing through the stations of the rolling mill (see Figure 1). At first, steel blocks from the steel mill are inserted into a rotary hearth furnace consisting of five different subsequent heating zones.While passing through the zones, each steel block is heated up to the forming temperature required for rolling. After leaving the furnace, three different rolling mills, one block roll and two finishing rolls, deform the steel ingot according to a preset automated reduction plan. However, depending on the assessment of a machine operator, the plan can also be interactively modified. The rolled product is then transferred to the separation facility where each individual steel rod is cut into final length and bundled into batches as ordered. Followed by a cooling-down period at the end of the process, the quality of each cutted steel rod is determined by material features resulting in ultrasonic tests. Subsequent to these tests, additional heat treatment such as tempering, quenching, annealing and hardening as well as finishing can be conducted if required.
2.2
Recorded Data
Machine parameters and sensor measurements are or will be collected at each processing unit (see Figure 1). The data can be joined with global information, like customer order data, block dimensions or material properties, and can also be linked to quality information documented during the ultrasonic tests.
Customer Order and Static Data A customer order consists of a certain number of steel rods of potentially different lengths and diameters. Based on these dimensions, it can be calculated how many steel blocks are needed to produce the rods. Each steel block can be related to its corresponding order by a unique identifier.
Process Data At the rotary hearth furnace, one thermal sensor per zone records value series data describing which temperature the blocks are exposed to while moving through the oven. Furthermore, information on the specific position in the oven and the period of time per zone are documented. The data is recorded in real-time with a sampling rate of up to 100Hz. The records allow for a reconstruction of the material temperatures based on physical models. At the rolls, multivariate value series data will be collected, such as rolling temperature, rolling velocity and speed, rolling force, roller grooves and adjustment for each roll pass. The data allows for a reproduction of the rolling process and the material behavior during deformation. The data can be recorded at a sampling rate of up to several measurements per millisecond. Quality-related Data The quality of cutted steel rods is described by metallurgical quality properties. For each order, it is known how many cutted steel rods had a certain type of error, like insufficient deformation, segregation or partial melting. Aggregated information on the errors is available by error keys, summarizing the different ultrasonic test results. Since the marking of heated blocks and cutted rods is impractical, it is currently impossible to track which cutted rods have been part of which steel block.
2.3
The Data Mining Task
From a data mining perspective, each processing station records multivariate value series data that describes how the individual steel blocks were processed. Based on this data and the recorded quality information, one or more prediction models need to be trained for each processing step. The models predict what physical quality individual steel blocks will have at the end of the process. While the training of the model may take place off-line, the prediction and a subsequent decision-making must happen in real-time.
3
Challenges for Data Mining
In the following, it is shown how quality prediction differs from fault detection. These differences, the distributed, but sequential nature of the prediction task and huge amounts of data pose challenges to state-of-the-art data mining methods. Moreover, the lack of quality information on individual steel blocks is related to a new type of machine learning problem.
3.1
on data from the current station, but also on data of predecessor stations. An interpretation of the trained models might then lead to knowledge about the existing interdependencies. Based on this knowledge and the actual predictions transmitted, subsequent machines could react to potential problems in real-time. In the ideal case, they would be able to adjust their working parameters autonomously in accordance with the quality requirements. The following sections compare the central processing of data to a decentralized approach.
Fault vs. Quality Prediction 3.2.1
Fault detection consists of identifying machine states that differ from a normal mode of operation. Normal states and malfunctions, respectively, are explicitly specified by a domain expert or, for complex state descriptions, could also be learned. Fault prediction is concerned with the question when machines will fail in the future, based on the monitoring of machine states over time. Data mining methods have already been used successfully in both areas [7]. The derived models can be as simple as thresholding rules and get as complex as neural networks. However, usually failures at one processing station don’t cause faults at other stations. This allows for the learning and application of local models that have to deal with single machines only. In comparison, the quality of the final product potentially is influenced by the operational modes of all machines in the process chain. Certain quality issues could only arise, for example, if two or more machines were in a particular state together. Hence, global prediction models over several processing stations need to be trained. Moreover, faulty states are usually easier to describe or at least to identify than states which can lead to quality issues. For instance, in the steel industry, quality often depends on the intuition of experts who can hardly describe their knowledge explicitly. Here, states which occur during normal operation and beyond that are not classified as faulty ones can nevertheless impact the quality of a product negatively.
3.2
Centralized vs. Decentralized Processing
The multivariate value series data, which describe the processing of single steel blocks, is recorded locally at different processing stations. This corresponds to the scenario of vertically distributed data, where the feature set of the training examples is partitioned and each feature subset is being stored on different nodes in a network. The physical quality of intermediate products needs to be predicted after each processing step and the result communicated to subsequent machines. Hence, instead of a single global model, at least one model for each processing station must be trained. Due to the potential dependencies mentioned in Sect. 3.1, usually these models need to be trained not only
Centralized Processing
Since training may happen off-line, a solution could be to transfer all available data for learning to a central machine and train individual prediction models for each processing station. It must be considered though that depending on the temporal resolution of sensors, processing stations can produce hugh amounts of data in a short period of time. For instance, the rotary hearth furnace can produce several gigabytes of temperature recordings per week. This can result in about one terabyte of data for training, just from a single processing station. Apart from training on smaller samples or aggregated data, such amounts of data might be handled by approximation algorithms like the Ball Vector Machine [17] or one-pass algorithms. A research question is how sampling, compression or approximation would affect the prediction accuracy. In comparison to training, where time is not crucial, the prediction itself is only allowed to take a few milliseconds. The trained prediction models could either be deployed at the individual processing stations or at a central machine. Since the current prediction model additionally depends on data of its predecessor stations, this data must be transferred over the network. In both cases, the amount of data transferred would become larger with each station. For matching the real-time constraint, it is therefore necessary to intelligently reduce and limit the data transferred between machines. Here, several options exist which are discussed in the next section. 3.2.2
Decentralized Processing
Instead of transferring all data to a central machine, it might be more beneficial to exploit the already decentralized structure of the data and to apply distributed data mining algorithms. In the case study, the focus is on vertically distributed data. A promising algorithm is the distributed one class ν-SVM by Das et al.[5]. The one class ν-SVM introduced by Sch¨olkopf et al. [13] determines a hyperplane which separates ν percent of the data points with maximum margin from the origin. Points lying on the other side of the hyperplane are marked as outliers. For the case study,
models could either be trained only on process data belonging to steel blocks which have a desired quality or on those with quality issues. The distributed one class ν-SVM by Das et al. [5] trains local models at each network node. The local outliers and small samples from the local nodes are then transferred to a central node, where a global model is learned. Only local outliers which are also global outliers are output. It could be shown that in comparison to centralization, less than 1% of the communication costs are needed for detecting more than 99% of the global outliers. Up to now, it is unknown whether the techniques used by this algorithm can be transferred to other algorithms like clustering, for instance. Another problem is the real-time constraint during prediction. For global classification with the one class ν-SVM, all feature values of an object must be transferred over the network. Several solutions or combinations thereof could solve this problem. Not all features might be relevant to the prediction task. Algorithms for the extraction and selection of features from value series data, like methods trees [10], could possibly find appropriate transformations and reduce the number of features. Transformations might also include translation into a symbolic representation by algorithms like SAX [9] and the extraction of patterns, like general sequential patterns (GSP) [15]. The shapelet technique [19] finds time series patterns which are most relevant to a class. Compression and aggregation methods like KRIMP[14], which is based on the MDL principle, may be used in a preprocessing step, as long as they preserve the most important properties of the data. These algorithms should be developed further to become resource-aware, dynamically choosing the ratio of compression, depending on the bandwidth and current network load. Classification algorithms based on compressed or aggregated data should also be able to estimate the confidence in their predictions and indicate if it falls below a certain threshold. Instead or in addition to the extracted feature values, prediction results of predecessor stations can be transferred to the current node and combined to a single prediction. This combination might be improved by respecting confidence values. However, it is unclear how to reliably combine the confidence values of different learning algorithms, like Decision Trees [12] and SVMs [18]. Assfalg et al. [1] proposed a solution which derives confidence estimates from confidence ranges, but in general, the literature on this topic is rare.
3.3
are either defective or not. Consequently, for several sets of examples, only aggregated label information, namely how many examples in the set had a particular label, is available. This new type of learning problem is called learning from aggregate outputs [11] or learning from label proportions and has gained attention in the machine learning community, only recently. Not many algorithms exist which could meet the requirements of the aforementioned scenario, concerning prediction accuracy and training time. The development of a new algorithm for learning from label proportions, presented in Sect. 4.2, was driven by the case study.
4
First Results
First results were achieved by training models on data from the rotary hearth furnace. Moreover, a new algorithm for learning from label proportions has been developed.
4.1
Prediction on Temperature Profiles
In general, the labels for individual steel blocks are missing. In cases in which all steel rods of an order had sufficient quality, the processing of the corresponding individual steel blocks must have been proper at all stations in the chain. If all rods had bad quality, the processing must have been faulty at at least one processing station. In this way, labels for some temperature curves recorded in the rotary hearth furnace could be reconstructed, resulting in 3,257 curves indicating a high quality and 1,504 curves related to a low quality. For better comparison of their shapes, all curves were either interpolated or extrapolated to the same length, with each curve being represented by a vector of 300 temperature values. A one class ν-SVM model trained on the high quality curves could reach a cross-validated prediction accuracy of 72,20%. For cross-validation, the model was trained only on a single class, but tested on both classes. A one class ν-SVM trained on the low quality curves led to an accuracy of 82,74%. However, especially in the latter case, an interpretation of the results is difficult due to the fact that quality issues might not have been caused by the rotary hearth furnace. On both types of curves, a Random Forest [3] model achieved a prediction accuracy of 92,42%. In the future, the results will be improved by a more sophisticated extraction of features. Further experiments need to be conducted, once data from the remaining processing stations is available.
Missing Quality information 4.2
Missing labels for individual steel blocks due to technological restrictions pose another issue. All information that can be calculated is how many blocks of an order had a certain type of defect, assuming that all blocks in an order produce the same amount of rods and that whole blocks
The LLP Algorithm
The LLP algorithm for learning from label proportions, introduced in [16], was developed in the context of the case study. Assuming that similar examples also have similar labels, the algorithm’s core step consists of clustering all
examples and labeling the clusters heuristically. Thereby, it minimizes the difference of the label proportions which would result from such cluster labeling to the given proportions. Taking the remaining difference as a fitness criterion, in an outer loop the algorithm changes the attribute weights of examples by an evolutionary strategy. In this way, the difference to the given label proportions is reduced even further. The clustering algorithm can be exchanged, as long as it partitions the set of examples. Using k-Means, LLP has only linear run-time in the number of examples and produces compact models consisting of labeled centroids which can be used for fast classification. LLP was compared to state-of-the-art methods for learning from label proportions on several data sets from the UCI repository[2]. It achieved a significantly higher or similar prediction accuracy, but needed less time for training. For application on value series data, it is planned to replace the evolutionary feature weighting by method trees [10] which can learn a proper combination of transformations on value series.
5
Conclusions
The training of models for quality prediction and the intelligent transmission of prediction results from sensors to other machines over a network in real-time could lead to more informed and current decisions on the processing of products. However, as demonstrated in the case study, interlinked production processes pose several challenges to data mining. Huge amounts of sensor data demand fast learning algorithms when training is centralized. The already decentralized storage of data could benefit from distributed data mining algorithms. It is planned to develop distributed cluster algorithms which can be used with LLP. However, the learning of global models from purely local ones is challenging for vertically distributed data, due to possible correlations between features across processing stations. In addition, the real-time constraint during prediction requires low communication costs between stations and models that are fast to apply. Algorithms need to be developed that produce models which can self-adapt to current workloads, guaranteeing hard upper bounds on communication costs and processing time. Acknowledgements
[2] [3] [4] [5]
[6] [7] [8]
[9]
[10]
[11]
[12] [13]
[14]
[15]
[16]
[17]
This work has been supported by the DFG, Collaborative Research Center SFB876, project B3. [18]
References [1] J. Assfalg, H. P. Kriegel, A. Pryakhin, and N. Schubert. Multi-represented classification based on confidence estimation. In Advances in Knowledge Discovery and Data Min-
[19]
ing, volume 4426 of Lecture Notes in Computer Science, pages 23–34, Berlin, Heidelberg, 2007. Springer. A. Asuncion and D. J. Newman. UCI machine learning repository, 2007. L. Breimann. Random forests. Machine Learning, 45:5–32, 2001. B. Bugayev, Y. Konovalov, Y. Bychkov, and E. Tretyakov. Iron and Steel Production. Books for Business, 2001. K. Das, K. Bhaduri, and P. Votava. Distributed anomaly detection using 1-class SVM for vertically partitioned data. Statistical Analysis and Data Mining Journal, 2011. (accepted for publication). P. Figueiredo. Technological learning and competitive performance. Edward Elgar, 2001. R. Isermann. Fault-diagnosis systems: an introduction from fault detection to fault tolerance. Springer, 2006. A. Kugi, W. Haas, K. Schlacher, K. Aistleitner, H. Frank, and G. Rigler. Active compensation of roll eccentricity in rolling mills. IEEE Transaction on Industry Applications, 36(2):625–632, 2000. J. Lin, E. Keogh, L. Wei, and S. Lonardi. Experiencing SAX: a novel symbolic representation of time series. Data Mining and Knowledge Discovery, 15(2):107–144, 2007. I. Mierswa and K. Morik. Method trees: building blocks for self-organizable representations of value series: how to evolve representations for classifying audio data. In Proc. of the 2005 Workshop on Genetic and Evolutionary Computation (GECCO), pages 293–300, New York, USA, 2005. D. R. Musicant, J. M. Christensen, and J. F. Olson. Supervised learning by training on aggregate outputs. In Proc. of the 7th IEEE Int. Conf. on Data Mining (ICDM), pages 252– 261, Washington, DC, USA, 2007. IEEE Computer Society. J. R. Quinlan. Induction of decision trees. Machine Learning, 1(1):81–106, 1986. B. Sch¨olkopf, J. C. Platt, J. C. Shawe-Taylor, A. J. Smola, and R. C. Williamson. Estimating the support of a highdimensional distribution. Neural Comput., 13:1443–1471, July 2001. A. Siebes, J. Vreeken, and M. van Leeuwen. Item sets that compress. In J. G. Ghosh, D. Lambert, D. B. Skillicorn, and J. Srivastava, editors, Proc. of the 6th SIAM Int. Conf. on Data Mining, pages 395–418, 2006. R. Srikant and R. Agrawal. Mining sequential patterns: Generalizations and performance improvements. In Proc. of the 5th Int. Conf. Extending Database Technology (EDBT), pages 3–17, London, UK, 1996. Springer. M. Stolpe and K. Morik. Learning from label proportions by optimizing cluster model selection. In Proc. of the 21th European Conf. on Machine Learning (ECML). Springer, 2011. (accepted for publication). I. W. Tsang, A. Kocsor, and J. T. Kwok. Simpler core vector machines with enclosing balls. In Proc. of the 24th Int. Conf. on Machine Learning (ICML), pages 911–918, New York, NY, USA, 2007. ACM. V. N. Vapnik. Statistical Learning Theory. Wiley, Chichester, GB, 1998. L. Ye and E. Keogh. Time series shapelets: a new primitive for data mining. In Proc. of the 15th ACM SIGKDD Int. Conf. on Knowledge Discovery and Data Mining, pages 947–956, New York, NY, USA, 2009. ACM.