Challenges in Building a Portal for Sensors World-Wide Suman Nath
Jie Liu
Feng Zhao
Microsoft Research
Microsoft Research
Microsoft Research
[email protected]
[email protected]
[email protected]
ABSTRACT SensorMap is a portal web site for real-time real-world sensor data. SensorMap allows data owners to easily make their data available on the map. The platform also transparently provides mechanisms to archive and index data, to process queries, to aggregate and present results on a geocentric web interface based on Windows Live Local. In this position paper, we describe the architecture of SensorMap, key challenges in building such a portal, and current status and experience.
1.
MOTIVATION
The commoditization of cheap, embedded, sensor-equipped devices and the accelerated trend towards ubiquitous Internet connectivity presents the new opportunity for creating a single web portal for a broad spectrum of real-time information about the world around us. Example services provided by such a portal include: a Parking Space Finder service, for directing drivers to available parking spots near their destination; a Bus Alert service, for notifying a user when to head to the bus stop; Waiting Time Monitors, for reporting on the queuing delays at post offices, food courts, etc.; a Lost and Found service, for tracking down lost objects; and a Person Finder service, for locating your colleagues or monitoring your children playing in the neighborhood. Although each of these services can be built independently, a common portal is more useful; for example, it would allow someone to find parking spots near a post office with small waiting time. To realize this vision, we are building a common platform where people can share their data about the world in useful ways. Geo-centric web services such as Windows Live Local (http: //local.live.com) and Google Maps (http://maps.google. com) provide simple API to visualize spatially and geographically related data over a map interface. The desire to add useful geographic related information to a map interface has resulted in a number of domain specific applications. Examples of such applications overlay housing information1 , crime-rate statistics2 , weather3 , and so on over maps. However, these existing solutions, although useful, have several drawbacks in achieving our vision of publishing and querying real-time sensor data over maps-based web interfaces. First, publishing even a single stream of data as a useful service is a nontrivial task. Programmers need to 1
http://www.housingmaps.com http://www.chicagocrime.org/map/ 3 http://www.wunderground.com 2
Copyright is held by the author/owner(s). WSW’06 at SenSys’06, October 31, 2006, Boulder, Colorado, USA. Copyright 2006 ACM 1-59593-343-3/06/0011 ...$5.00.
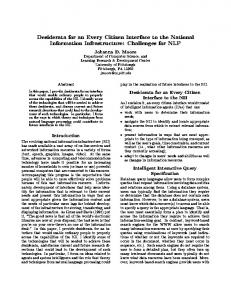
Figure 1: SensorMap Architecture. understand complicated web map API and to manage the acquisition, archiving, indexing, and displaying of data. Second, existing applications are mutually incompatible. One cannot bring up a single map that shows both the housing information and crime rates in an area. Third, existing solutions allows showing data only as points (called PushPins) over the map; they do not provide basic useful functionalities such as querying live sensors based on location or aggregating results from a number of sensors in a useful manner. The SenseWeb project at Microsoft Research aims to address these challenges by providing a research web portal, called SensorMap [6] (http://atom.research.microsoft. com/sensormap) and a set of tools for data owners to easily publish their data and for users to make useful queries over the live data sources. SensorMap allows data owners to easily make their data available on the map. The platform also transparently provides mechanisms to archive and index data, to process queries, to aggregate and present results on geo-centric web interfaces such as Windows Live Local, etc. We believe that such a platform will encourage the community to publish more live data on web and to build useful services on top of that data.
2.
SENSORMAP ARCHITECTURE
The SensorMap portal consists of the following four components (Figure 1): the GeoDB indexes static metadata about sensors so that it can be queried efficiently, the DataHub web service provides an interface for registration of new sensor and archiving of real-time sensor data, the Aggregator clusters geographically near-by sensors and summarizes data from sensor clusters in useful ways, and the SensorMap GUI lets users query data sources and view results on the map.
2.1
GeoDB
GeoDB is a database housing sensor metadata. The metadata includes information such as publisher name, sensor location, sensor name, sensor type, data type, unit, sensor data access methods, and free text descriptions. We envision that typical user queries will be based on sensor types, descriptive keywords, and geographic locations; e.g., they
street maps, satellite images, etc. In addition, it lets endusers to pose queries on available sensors. SensorMap currently supports three types of queries: i) geographic queries specified by drawing geometric shapes (e.g., a region, a route) directly on the map, ii) type queries specified by sensor types within the viewport, and iii) free text queries specified by keywords describing sensors. It overlays the results returned from the aggregator on Windows Live Local. Note that the GeoDB and the Aggregator are transparent to both the data publishers and users. The interface also allows users to save views (geographical region, sensor type filters, etc.) on the client machine as cookies, which can be quickly retrieved later. Figure 2 shows a snapshot of SensorMap showing street parking data in part of San Francisco4 . Figure 2: SensorMap interface for parking sensors.
3.
may ask for a list of all cameras along a route or the average temperature reported by all the thermometers inside a geographic region. To efficiently support these types of queries, GeoDB indexes the metadata by using hierarchical triangular mesh (HTM) indexing scheme [8] which is particularly suitable for geographic queries. The indexing is implemented as table-valued functions in a SQL server.
This section describes a few key challenges in building a web portal like SensorMap. These challenges are primarily caused by the goal of collecting and presenting continuously changing, diverse types of data, which pushes the limits of current web technologies. We describe our current working directions to address them in future releases.
2.2
Aggregating data from vastly different sensors and services on a shared Web portal poses a few fundamental challenges. First, data sources may have very different interfaces such as proprietary communication protocols, data presentation, and accessibility. Networked sensors, even the Internet ready ones, are typically behind firewalls due to management boundaries and security concerns. Web services are popular ways to tunnel through firewalls using HTTP ports and XML encoding. SensorMap uses web service interface for sensor registration and data caching. Before publishing data to SensorMap, a data publisher must first register the sensor by providing its static description. This meta data describes sensor name, sensing type, location, data type, units, URL, as well as a free text description of the sensors, and is used in searching sensors for a given user query. In SensorMap, we use a Sensor Description Markup Language (SDML) to encode these properties. Unlike SensorML [2], SDML only describes sensor data interfaces rather than the internal structure of sensors. Thus, it is much simpler and lighter-weight than SensorML. However, SDML syntax is similar to SensorML’s; we can incorporate SensorML’s features into SDML as we need and SensorMap can incorporate SensorML when it matures. To further help data publishers to use these web services, we extended the MSRSense [9] toolkit (can be downloaded from http://research.microsoft.com/nec) with data publishing capabilities. MSRSense is a collection of software tools that allow users to collect, process, archive, and visualize data from a sensor network. It contains: a reconfigurable microserver execution environment, an extensible library implementing signal processing and event detection algorithms, an extension to Excel 2003 (Senscel) to import, visualize and processing sensor data, interface to SQL server to archive and retrieve data, and a web-service interface to register and publish sensor data to SensorMap. Using a SensorMap
DataHub
There are basically two ways to make real-time data available on SensorMap. For sensors that provide public web interfaces, they can register their URL directly to GeoDB. These URLs are used by the SensorMap client to fetch realtime data. For sensors with Internet connection but no URL (such as those behind firewalls), the DataHub web service provides a simple interface to cache sensor data. The sensors are clients for the DataHub web service, and can send in real-time data using standard web service calls. The Aggregator or the SensorMap GUI directly retrieve these cached data from DataHub rather than trying to contact the sensors. Section 3.1 discusses more on publishing sensor data to DataHub and SensorMap.
2.3
Aggregator
The aggregator creates icons representing sensor data that can be mashed up with maps. Depending on the sensor type, an aggregator can reside either on the client side or on the server side. It accepts queries from the client and redirects the geographic components of the queries to the GeoDB. After obtaining the metadata of a set of sensors that satisfy a client query, it contacts the sensors for their real-time data. It then aggregates the data accordingly (e.g., depending on the zoom level of the underlying map shown to the client). By doing so, SenseWeb provides useful summarization of data to the client; for example, when a user is browsing at a city level, instead of showing him hundreds of temperature sensors in the city, SensorMap shows only one icon with aggregated results. What aggregation is performed by the aggregator depends on sensor types. For example, for data collected from thermometers, average and standard deviation of temperatures reported by thermometers in a neighborhood are displayed.
2.4
SensorMap GUI
The GUI is based on Windows Live Local, and therefore shares its attractive features such as zooming, panning,
3.1
4
CHALLENGES
Data Publishing
Street parking data is published by Streetline Networks, Inc.
publishing component from the MSRSense library, a sensor is automatically registered to the SensorMap DataHub, and all sensor data received by the component is sent to the DataHub for caching. Secondly, the interoperability and extensibility of different sensor types is challenging. For example, weather data can be published by public web site like weather.com as well as weather stations from hobbyists’ backyards. In order to meaningfully aggregate data from multiple sources, we need common representation of sensor types and units. As an open sensor portal site, we must anticipate new sensor types to be added. We cannot design SensorMap based only on a fixed set of sensors. We believe that using a standard ontology to publish data is a key requirement, since it enables automation of processing tasks within the portal. The ontology has to be extensible such that data aggregation and presentation methods can be standardized within SensorMap based on abstract types. For example, we can define aggregation methods, such as MIN, MAX, and AVERAGE, for all scalar sensor data. When a new sensor type is added, as long as it is indicated as a subtype of scalar, the same aggregation methods can apply. Currently, there is no lack of such web ontology frameworks (e.g., NASA SWEET 5 and IEEE SUMO 6 ), however, the biggest problem is that they are mutually incompatible. Moreover, most of these standards are incomplete and have no useful implementation which explains why they are not used by most data publishers. The community needs to work towards addressing this problem.
3.2
Scalable Data Management
The large amount of data provided by the portal poses new data management problems. Consider a centralized solution where the portal itself collects sensor data on demand, computes clusters at required granularity, and aggregates data within each cluster. This is different from traditional data warehouse model where underlying data changes infrequently or from traditional data stream model where data is continuously pushed and queries are long running. A more appropriate model is to maintain an approximate view of the database and to materialize the portion of interest on demand. The materialization is done by using unexpired cached data and by collecting additional data from a carefully chosen subset of sensors of the area of interest. Several challenges arise in this model. First, query planning, optimizations, and cache management need to incorporate the cost of collecting data from the sensors. Second, if the area of interest contains a large number of sensors, a sample of them can be used to compute aggregate result. Ideally, the sample should be roughly uniform over the area of interest. However, depending on query workload, cached data may become spatially skewed. Thus, the sensors to be probed must be selected carefully to complement the cache content. Third, if a flat cache is used, sensor data selected by a query (cached data + collected data) need to be clustered and aggregated for each query which can be very expensive. A more desirable solution is to cache the aggregated clusters and results. This is tricky, however, since aggregated results are computed from multiple sensor data that 5 NASA Semantic Web for Earth and Environmental Terminology. http://sweet.jpl.nasa.gov/ontology/ 6 IEEEP1600.1 Suggested Upper Merged Ontology
may have different expiry times; without clever algorithm an aggregated result may be invalid when any of the input data expires, limiting the benefits of cached aggregate results. SensorMap maintains a variant of R-tree, called COLR-Tree, for efficient spatio-temporal query processing. COLR-tree provides a natural way to index clusters and cache aggregate results at different granularities. An aggregate result is computed from partially aggregated data in the cache and dynamically collected data from sensors. COLR-Tree intelligently selects sensors to collect live data from such that they and the unexpired sensors on the cache spread uniformly over the area of interest. An aggregate result at non-leaf nodes of the COLR-tree is maintained in a data structure such that on expiration of an input sensor data, only part of the aggregate result expires. Thus, if two queries partially overlap in space, the latter one can reuse the results computed by the first one if they are issued within a short period of time. Our implementation within SQL server and evaluation with real workload from Windows Live Local shows that it scales to around 100 queries per second over around 400,000 sensors. In case our centralized solution does not scale sufficiently, we will distribute the R-tree nodes across multiple machines, similar to how IrisNet distributes an XML hierarchy over multiple organizing agents [4]. Mobile clients such as cellphones browsing sensor data pose bigger challenges since user queries need to be evaluated in the context of users’ locations. Even if such contexts can be extracted, context-specific queries reduce opportunities for sharing data and increase load of the backend.
3.3
Data Visualization
Variety of sensor data needs to be displayed on the portal in meaningful ways. Current version of SensorMap shows sensor data as points—each sensor or sensor-group is represented by an icon whose shape denotes the sensor type and color denotes the sensor value. For many sensor data, such simple display method is insufficient. For example, data from a dense deployment of temperature sensors could be better displayed as contour maps showing temperature gradients, archived data of a traffic sensor could be displayed in a way that highlights temporal congestion patterns, and so on. Moreover, when the amount of data to be displayed is large, data needs to be summarized in useful ways so that users can easily extract the useful information. Several geometric or statistical summarization techniques can be used for this purpose. For example, locations of a large number of sensors can be represented by an approximate convex hull [5], or by a sensor cluster and a circle representing the magnitude the cluster. Such summarization can often be done in many different ways, with all summaries being equally good. Such non-uniqueness of summaries can be a problem in the context of a portal when underlying data sets, queries, or client viewports change. Imagine a user panning a rectangular window over a region of the US and wanting to see summarized geometric information about the contents of that window - for example temperature readings from sensors. Depending on how the summarization algorithm is implemented, small motions or small changes in the window content may cause the algorithm to choose a very different summarization. Even though this new summarization may be equally good in terms of any error quality
metric, the sudden change may be distracting—especially if continuous motion of the window causes high-frequency oscillations between two solutions, especially near the borders of the viewport. The situation can be worse if the underlying data is mobile. Existing geometric summarization techniques overlook this property and further research is required to produce stable summaries that avoid the above problems. Addressing above problems is challenging in the context of a web portal for several reasons. First, the solutions need to be provided within the web service framework rather than a stand alone application like Google Earth. Second, one can not hope to provide all possible useful visualization methods since many of those are specific to data domains. Rather we need to identify and provide a small set of simple abstractions that can be used to compose a variety of more complex visualization. Section 3.5 discusses more on this issue.
3.4
Sensor Discovery
Even though SensorMap provides tools to easily register and publish sensor data, we cannot expect all data publishers to proactively put their sensors on SensorMap. Many useful sensors already exist on the Web; they are just not linked from SensorMap. For example, many departments of transportation put traffic cameras on Web, USGS puts real time stream gauge information on Web, and so on. Just as existing Web portal such as Yahoo! automatically crawls the Web to discover new web pages, a sensor portal needs similar crawlers to automatically discover and index live data sources on Web. Although many existing sensors can be accessed through their web pages, automatically discovering them is challenging for a few reasons. First, these pages typically do not have a well-defined structure that could hint that a page might represent a sensor. Second, unlike typical web pages, these sensor web pages typically do not link to each other; they are often isolated. Finally, even if a page representing a sensor is found, extracting necessary metadata to describe the sensor is nontrivial. One may require using natural language processing techniques to extract such information. Current version of SensorMap includes a crawler to automatically discover and annotate traffic cameras available on the Web. The crawler exploits the facts that traffic camera web pages are often maintained at various departments of transportation web sites, camera web pages often contain keywords like “live,” “camera,” “webcam,” etc., and almost all traffic cameras are made available as .jpg images. To annotate a camera with its location, the crawler extracts keywords near the camera URL in its web page. The keywords often describe locations such as “Camera at the I-405 South exit 2.” Inputting these location keywords into local search engines such as Windows Live Local or Google Maps return latitudes and longitudes of places such as restaurants, shops etc. near the location. The location of the camera is then approximated by removing outliers of these results and taking the center of the remaining. Note that the above crawler works in a relatively narrow domain, which vastly simplifies the problem. Writing a crawler for general sensors is still an open problem. The problem becomes more complicated when we consider mobile sensors such as cellphones with cameras. Their locations need to be updated consistently when they move, which is not trivial to do in a scalable fashion.
3.5
Mash-up API
To realize the full potential of a portal like SensorMap, it should be easily extensible and mashed-up with other applications and service. As example scenarios, a user should be able visualize real time traffic data from SensorMap and driving directions from Google Maps together or set a trigger that sends him a mail when the traffic condition is good. Providing a general mash up framework is tricky since it may need to deal with the semantics of the underlying data. In the second example above, the mash-up code needs to parse and understand the traffic data from SensorMap. However, we believe that by providing modular and composable rendering API, some part of the mash-up process can be automated. Consider the first example above—with Google Maps and Windows Live Local API, it requires multiple JavaScript programs at the client, each of which does the custom conversion of its raw data (traffic, driving directions, etc.) to a visual representation. But, automatic integration of multiple JavaScript parsers is hard. We propose pushing the rendering API all the way out to the data publisher based on abstract types. One possibility is to have data publishers generates rendered representations of data, rather than raw data. That is, instead of sending (for example) driving directions in proprietary format (as is done in Google Map and Windows Live Local mash-ups), the publisher (through a publishing toolkit) does the interpretation of this data into one of a small number of common visual representations: points, lines, regions, and images. A standard JavaScript at the client can then automatically render these data types from different data sources to compose more complex visualization. The JavaScript can also handle functionalities like panning, zooming, etc. The client can have controls to add and delete feeds, change the order of the layers, and so forth. While the flexibility of this architecture adds some cost to the provider, the benefit of the composability will outweigh the cost. Conceptually, the client program in this architecture is similar to an RSS aggregator, except that visual map data are being aggregated for display rather than textual headlines. In some sense, the four fundamental data types (points, lines, region, and image) represent a “narrow waist” of this visual mash-up framework. Note that since abstract and UI only data representations lose the semantics of sensing types, this interface limits the aggregation mechanisms we can apply. However, it can work as a complement to known-type aggregation so that we can quickly incorporate new kinds of sensors.
3.6
Other Challenges
Privacy and data ownership are big concerns for sharing physical, real-time data. Sensor data may reveal other information about publishers and their surroundings. A publisher may want to control how the data are being used. Our approach to this is to have an authentication framework and to allow a publisher to decide the privacy level of his sensors: a sensor may be viewed only by the publisher, or by a group he creates, or by everyone. However, this is not sufficient in many cases. A much deeper social issue is the data ownership. For example, just because one can set up a web camera from his apartment window to look at the restaurant across the street, he may not have the right to publish the waiting time of that restaurant on the web. These social concerns are beyond the technical issues addressed in this paper, but
it may have profound implication of the success of web sites like SensorMap.
on top of standard maps and satellite images. This has enabled an array of applications that show static or semistatic data on maps. Examples include real-time bus locator7 , movie finder 8 , James Reserve data management sys4. EXPERIENCE AND STATUS tems [1], etc. As mentioned before, these applications are We have released the first version (V1) of SensorMap in mutually incompatible to each other; it is not possible, for July 2006 (http://atom.research.microsoft.com/sensormap). example, to correlate the bus route to a theater showing In addition to the data sources incorporated by us, a few a movie. Moreover, Google Maps and Windows Live Local groups (e.g., parking spot availability in San Francisco by API basically allows developer to put a point (PushPin) over StreetLine Networks Inc., soil data by John Hopkins Unithe map; it does not provide useful functionalities such as versity) have volunteered to publish data on SensorMap. query processing, clustering, summarization, etc. over the During the course of design, implementation, and deploydata. SensorMap is aimed to address these limitations. ment of this V1 version, we encountered a lot of difficulties, some of which worth mentioning here. 5.2 Query Processing over Internet-connected We found that the web service framework, although simSensors ple and easy to develop new applications, is still very difficult Several projects including IrisNet [4], HourGlass [7], Hito debug, especially when the application depends on several Fi [3], etc. aim to provide infrastructure support to process other components. The differences between the production complex queries over distributed Internet-connected sensors. environment out side the firewall and the internal developThe focus of these projects is complimentary to that of ment environment make the situation even worse. Most of SenseWeb; one can imagine replacing our current query the time when we pushed SensorMap from our internal deprocessing component with a distributed one. Based on our velopment machine to the external production machine, we estimated workload in near future, we feel that our current broke some dependencies and figuring out the exact problem architecture will perform reasonably well. Moreover, most still remains an art to us. In fact, our V1 release had fewer distributed query processors require infrastructure support; features than our internally deployed version; mainly bee.g., they require controls over different machines in the incause porting them to the external machine was tricky. We frastructure to execute query processing components. Senfeel that more tools are needed to easily deploy and debug sorMap does not assume such infrastructure at this point. web service. In the beginning, we planned to host within SensorMap the data collected from all sensors. However, it posed a legal question: who will be responsible for the content of the data? For example, who will be responsible if someone registers a webcam and shows copyrighted or obscene images via SensorMap? After much discussion, we decided to move to an architecture where the sensor data is owned by the publishers and is downloaded directly from publisher’s site to the client. Moreover, a publishers need to get an account from us and authenticate each time he publishes data. The architecture of downloading data from publisher to client introduces new security concerns. In addition to predefined data types (like temperature, image, traffic, etc.), SensorMap also supports HTML documents as sensor data. When a publisher wants to publish data beyond our prespecified data types, he can simply make an HTML page containing his data. SensorMap displayed an icon for the HTML data and showed HTML page as a pop up window when user moused over the icon. We discovered that this model was vulnerable, since malicious publisher could put JavaScript code within the HTML page which could compromise a system when executed. To avoid this, we now only automatically display the publisher name and the URL and require users to click on the URL before we show the HTML page in a new browser window. The effect is now equivalent to browsing a new URL in a new browser window.
5.
CONCLUSION
SenseWeb is an ongoing project with the goal of creating an online searchable portal of live data from the physical world. The portal, called SensorMap, is publicly available and allows data publishers to publish new data sources and users to query the collection of data. We hope that simple interface and useful features of SensorMap will encourage the community to publish more data sources which can act as seeds for world-wide sensor web.
7. [1] [2] [3] [4] [5] [6] [7]
[8]
RELATED WORK
SensorMap combines the benefits of map-based portals and query processing systems on wide-area sensors. We here discuss the work related to these two areas.
5.1
6.
[9]
REFERENCES
James reserve data management systems. http://dms.jamesreserve.edu/. Sensor Model Language (SensorML), by Open Geospatial Consortium Inc. http://vast.nsstc.uah.edu/SensorML/. Cooper, O., Edakkunni, A., Franklin, M., Hong, W., Jeffery, S., Krishnamurthy, S., Reiss, F., Rizvi, S., and Wu, E. Hifi: A unified architecture for high fan-in systems. In VLDB (2004). Gibbons, P. B., Karp, B., Ke, Y., Nath, S., and Seshan, S. Irisnet: An architecture for world-wide sensor web. IEEE Pervasive Computing 2, 4 (2003). Hershberger, J., Shrivastava, N., and Suri, S. Cluster hulls: A technique for maintaining the shape of a point stream. In ICDE (2006). Nath, S., Liu, J., Miller, J., Zhao, F., and Santanche, A. Sensormap: A web site for sensors world-wide. In Demo at ACM SenSys (2006). Shneidman, J., Pietzuch, P., Ledlie, J., Roussopoulos, M., Seltzer, M., and Welsh, M. Hourglass: An infrastructure for connecting sensor networks and applications. Tech. Rep. TR-21-04, Harvard University, 2004. Szalay, A., Gray, J., Fekete, G., Kunszt, P., Kukol, P., and Thakar, A. Indexing the sphere with the hierarchical triangular mesh. Tech. Rep. MSR-TR-2005-123, Microsoft Research, September 2005. Woo, A., Seth, S., Olson, T., Liu, J., and Zhao, F. A spreadsheet approach to programming and managing sensor networks. In IPSN/SPOTS (2006).
Map-based Portals
The current versions of Google Maps (and Google Earth) and Windows Live Local provide a simple API that allows developers to create custom maps and draw their own data
7 8
http://www.busmonster.com/ http://www.25hoursaday.com/MovieFinder