among private cloud, community cloud, public cloud and conventional Enterprise IT .... This section identifies the best elastic model which optimizes resource ...
Challenges, Strategies and Metrics for Supply-Driven Enterprises Paul Manuel, Helal Al-Hamadi and Kalim Qureshi Department of Information Science Kuwait University Kuwait
ABSTRACT Businesses today must maintain a laser-like focus on containing costs and increasing efficiencies in every possible way in order to generate profits and maintain competitiveness. Supply chain management (SCM) & optimization is a critical aspect of modern enterprises and an ever-green research area. IT dept plays a major role in the optimization of supply chains. This paper presents a critical review of IT methodologies for optimizing supply-driven chains which have complex inventory systems. The convergence of business unit and IT dept using state-of-art cloud technology is recently accepted as a solution to optimize such complicated supply chains. On the other hand, there is still ongoing debate on the choice of the model among private cloud, community cloud, public cloud and conventional Enterprise IT models. Specifically, it is not certain which model is the most appropriate for supply-driven enterprises. Google and Amazon argue that public cloud is a better choice from the perspective of resource management since public cloud provides the least elasticity. Business growth is the main objective of any enterprise. Resource Management is one of the parameters of business growth. Even though public cloud is an optimal model from the perspective of resource management, this paper states that community cloud is the most suitable model for supply-driven enterprises from the perspective of business growth. We conduct simulation experiments and demonstrate that community cloud is the optimal model to supply-driven enterprises.
1. Introduction The supply chain is a network of suppliers, factories, warehouses, distribution centers and retailers through which raw materials are acquired & transformed and finished goods are delivered to customers. An efficient supply chain management not only saves costs and eliminates delays & uncertainties, but also makes the business stable during recession and economical turns [6]. Supply chain optimization is not necessarily zero-inventory or just-in-time inventory. Supply chain optimization involves several parameters such as optimization of resources (assets and network), capacity utilization, green (environmental) issues, quality of service, time to market, expansion and business continuity. Kuwait EQUATE Petrochemical Company has a complex supply-driven chain network. Inventory of EQUATE is the most complicated one. The suppliers are hybrid which is a mix of both demand-driven and supply-driven suppliers. Kuwait National Petroleum Company (KNPC) supplies petroleum derivatives to EQUATE and the supply of KNPC is not determined by EQUATE. OPEC and Kuwait Government decide the output of oil. The output of oil by KNPC varies according to the market demand and oil price. Based on the output of the oil, the supply of petroleum derivatives by KNPC to EQUATE varies.
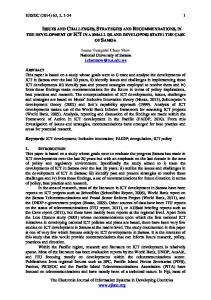
Other raw materials to EQUATE are oxygen, nitrogen, compressed air and gases etc. These raw materials are supplied by Kuwait Industrial Gases Company, Shuaiba Oxygen Company and other local suppliers. These suppliers are demand-driven suppliers since the supplies by these suppliers are determined by the production requirements of EQUATE. The enterprises such as EQUATE with supply-driven chain is called supply-driven enterprises [8]. See Figure 1. KNPC
Supply-Driven Supplier Petroleum derivatives EMC Polyethylene, Styrene Monomer, Ethylene Glycol Sales Supply-Driven Enterprise Oxygen, Gases Nitrogen, Compressed air
Demand-Driven Suppliers Fig 1: Kuwait EQUATE Petrochemical Company
It is accepted that the convergence of business unit and IT dept using state-of-art cloud technology is a solution to optimize complicated supply chains [4,10,14,20,11]. There are two basic models to align business unit and IT unit. They are conventional enterprise IT model and cloud model. The cloud model has two types which are private and public clouds. The community cloud is an extension of private cloud. Any enterprise has to choose an IT model among enterprise IT model, public cloud and private (community) cloud. The question is “which model is the most appropriate model to suit supply-driven enterprise from the perspective of business growth?” This paper provides an answer to this question. We collect data from different sources and conduct simulation experiments applying Gartner formula [15] to estimate business growth. We conclude that the community cloud is the most appropriate model for supply-driven enterprises. Business growth is the ultimate goal of any enterprise. In this paper we discuss challenges, strategies and metrics of SCM from the perspectives of business growth.
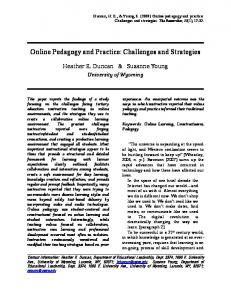
2. Challenges, Strategies and Metrics of SCM Any business has only one objective which is business growth. The business growth is achieved by minimizing investment and maximizing profit. We compile all important parameters of business growth and provide a narrative discussion on the hierarchical levels of business growth [1,2,3,6,7,9,12,13,14,16,19,21]. The challenges, strategies and metrics of business growth are shown in Figure 2. Business Growth
Minimize Investment & Maximize Profit
Business Continuity
Strategic Planning & Forecasting
Scheduling Supply Chain
Resource Management
Challenges
Strategies
Disaster Recovery
Integration
Elastic System
RPO & RTO
Agility, Flexibility, Quality
Elasticity
Metrics
Fig 2: Challenges, strategies and metrics of business growth
2.1. Challenges of SCM Some common challenges of supply chain enterprises include 1. Business Continuity: It is 24x7 availability of system in good condition and it is not hammered by safety, security, or maintenance issues. 2. Strategic Planning & Forecasting: In order to face business competition, a successful enterprise needs to forecast market behavior and customer requirements. The enterprise has to plan the supply chain for the next few years based on the market forecasting. 3. Scheduling Supply Chain: It involves moving raw materials from suppliers to manufacturer and moving finished goods from manufacturer to customers. It also involves efficient management of just-in-time (JIT) warehousing. 4. Resource Management: Efficient Management of resources is not only exploiting the full potential of resources but also minimizing wastes.
2.2. Strategies to manage the challenges of SCM The common strategies of the respective challenges of SCM are
Integration: It is a key strategy to manage the two challenges (Strategic Planning & Forecasting and Scheduling Supply Chain) [6,7,12,13,19]. It is a horizontal merger of the entire supply chain network (SCN) [12].
Disaster Recovery: It is a primary strategy to maintain business continuity [21]. A disaster recovery plan is like car insurance. You don't realize its value until you're in an accident.
Elastic System: The business of supply-driven enterprises fluctuates like share market index. It is busy some time and it is idle on some other time. As business is active, the architecture needs to scale up proportionately. As business slows down, the architecture needs to scale down accordingly. Supplydriven enterprises require an elastic IT model. It is critical to build an elastic architecture in such a way that the elasticity is proportionate with business needs. Enterprise IT only scales up and does not scale down. Cloud technology provides an elastic system for optimal resource management [4,10,14,20]. Elasticity is an integral feature of the cloud [21].
2.3. Metrics to measure the strategies of SCM Here we describe the metrics to measure the strategies which we discussed above.
Agility, Flexibility and Quality Enterprise Integration is measured by (i) agility (ii) flexibility and (iii) quality [7,19]. Today the concept of agility has become popular and is still growing in popularity in the management and technology literatures [1,16]. Flexibility is a broad term [21]. Quality of Integrated System [13] is a combination of clarity, availability and reliability
RPO and RTO Recovery Point Objectives (RPO) is a key for identifying the point at which data is recoverable. RPO represents an acceptable loss in the event of a disaster or service interruption. Recovery Time Objectives (RTO) represents the time period required to get systems or applications back in service without a major disruption to the business. Everything ties into RPOs and RTOs. It’s the starting point for understanding costs and return on investment [21]. They are reciprocally proportional to the cost of disaster recovery: The closer RTO and RPO are to zero, the more expensive DR provisioning will be. If the recovery time takes days or even weeks, costs will likely be significantly less.
Elasticity The usage of IT recourses of supply-driven enterprises fluctuates. A good system expands when the business is active and it shrinks when it is idle. Elasticity is to measure the flexibility of a system how much it scales up with the business growth and how much it scales down with the business slow-down.
See Figure 3. Enterprise IT provides scalability whereas could architecture provides elasticity [4,10,14,20]. TCO per Month
Scalability
Elasticity
CAPEX
OPEX
Actual Usage of IT Infrastructure by Enterprise
Time Fig 3: TCO per month = IT_CAPEX/(months of life) + IT_OPEX per month.
3. Elastic Resource Management As it is discussed before, supply-driven enterprises require an elastic IT model. The goal is not to have different cloud providers, but pick one which fits into corporate strategy [14]. A private cloud [14] is a set of computing resources that is dedicated to an organization, usually on-premises. A community cloud provides an opportunity for multiple organizations with similar needs or like interests to share infrastructure. A public cloud [18] involves computing resources hosted externally but shared with other organizations and dynamically provisioned and billed on a utility basis – pay for what you use as you use it. This section identifies the best elastic model which optimizes resource management of an enterprise.
3.1. Formula to measure elasticity IT_CAPEX The Capital Expense in IT (IT_CAPEX) includes the following 5 components [5,17]: 1. Compute – CPU, core and RAM requirements. 2. Network – network cards, cables, network switching equipment other accessories including power, heating and cooling requirements. 3. Virtualization – server hardware and software virtualization, enabling business applications to be easily moved from server to server. This includes deploying virtual machines and hypervisors. 4. Storage –fully virtualized data centers with SAN technologies.
IT_OPEX The Operating Expense in IT (IT_OPEX) includes the following 3 components [5,17]: 1. Computing Services - Usage and consumption of services (storage & computing) used. 2. Management – maintenance and administration of resources of compute, network, virtualization and storage units. This includes Security and availability, Personnel, and subcontract costs. 3. Power, space, and cooling costs – electricity utility bill and maintenance of A/C, office, etc.
TCO per month The total cost of ownership (TCO) for a month is calculated as follows [5,17]:
Elasticity The elasticity is measured as
Fig 4: The experimental results shows the elasticity of different models
3.2. Simulation Results The enterprise IT model is “buy-&-use”. In the enterprise IT model, most of the expense is CAPEX with a small OPEX. OPEX is the running cost of IT Department. CAPEX is the procurement of servers and data centers and it is one-time investment. The public cloud model is “rent & use” (pay-as-you-go). The TCO (CAPEX + OPEX) of the public cloud model is the cost based on the meter of utilizing IT services and the meter details are listed in the
chargeback bills from the service providers. In Figure 4, the TCO of public cloud traverses along the graph of Actual Usage of IT resources by the enterprise without much gap. The community cloud model is “lease & use”. In the situation of community cloud, the enterprise leases cloud infrastructure gear rather than buying it. The CAPEX of the community cloud is the cost of leasing cloud infrastructure gear. That is why the TCO of community cloud is flat for a certain period in Figure 4. The simulation results are depicted as graphical format in Figure 4 and as bar chart in Figure 5.
Elasticity 200.00
185.23
180.00 160.00
141.95
140.00
116.11
120.00 100.00 80.00 60.00 40.00 20.00 0.00
Public Cloud
Community Cloud
Enterprise IT
Figure 5: Elasticity of three models
In order to run the business, the invested IT_CAPEX & IT_OPEX should be higher than the required IT_CAPEX & IT_OPEX [20]. If the elasticity is 100%, it is an ideal situation. If elasticity is less than 100%, IT resources do not meet the need of business units and it hurts the business. If elasticity is greater than 100%, the fund is lavishly spent and it will hurt business profit. Our simulation results are displayed in Figure 4 and 5. Sample data is collected by different surveys. It is clear that the public cloud has distinct advantage over other models from the perspective of resource management. This is indeed the claim of Amazon and Google [18, 20]. However, our quest is to find an appropriate model to maximize the business growth because the mission of an enterprise is only business growth not just optimization of resource management.
4. Business growth We continue to carry out simulation experiments to measure the business growth of supply-driven enterprises. We use Gartner formula to measure the business growth [15].
4.1. Formula to measure business growth Return on Investment (ROI): Return on Investment (ROI) is a performance measure used to evaluate the efficiency of an investment in a division of an enterprise or to compare the efficiency among different investments. On the other hand,
Return on Assets (ROA) is a performance measure used to evaluate the efficiency of the whole asset of an enterprise. In SCM, a company invests in different divisions such as inventory, marketing, manufacturing and IT dept. We are evaluating the efficiency of investment in IT dept. ROI is more appropriate measure than ROA in our scenario.
Inventory Turns (InT): Inventory Turns (InT) is the number of times a business sells its inventory. A low turnover implies poor sales and, therefore, excess inventory. A high ratio implies strong sales.
InT growth illustrates the increase/decrease of the efficiency of inventory over time.
Fig 6: The parameters of Business Growth
Revenue Growth: Revenue growth illustrates sales increases/decreases over time. It is used to measure how fast a business is expanding. If a company generated $75 billion in revenue during 2008 and $100 billion in revenue during 2009, the company experienced roughly a ($100 billion/$75 billion)-1 = 33% increase in revenue.
Business Growth: The business growth involves SCN partner satisfaction and enterprise’s user satisfaction in addition to ROI growth, InT growth, and revenue growth. See Figure 6. The business growth for a financial year is given below [15]:
where w1+w2+w3+w4+w5=100%. The above one is a minor variation of Gartner formula [15].
4.2. Simulation Results We collected data from five companies on RPO, RTO, agility, flexibility, and quality. Enterprise’s user satisfaction and SCN partner satisfaction are measured in a 100-point scale which is based on RPO, RTO, agility, flexibility, and quality. See Figure 8. We recall that resource management is a part of ROI. 14.50%
B u s i n e s s
14.00% G r 13.50% o w t 13.00% h
14.20% 13.80%
12.50%
12.90%
12.00% Enterprise IT
Community Cloud
Public Cloud
Fig 7: The business growth of different models
Figure 7 shows the business growth of the one of five companies. The business growth using community cloud is 14.20% while the business growth using Enterprise IT is 12.90% and the business growth using public cloud is 13.80%. The Figure 7 shows that community cloud has a distinct advantage over the other two models from the perspective of business growth. RPO (100%) Enterprise’s user
SCN partner
RTO (100%)
Agility (100%)
Flexibility (100%)
Quality (100%)
Company A Company B Company C Company D Company E Company A Company B Company C Company D Company E
Fig 8: Template to store data for Enterprise’s user satisfaction and SCN partner satisfaction
We conclude that the community cloud is the best for SCM optimization of supply-driven enterprises.
5. Conclusion Amazon and Google claim that public cloud is the most efficient and cost-effective model of modern enterprises. As in section 3, we agree that it is true from the perspective of resource management. But resource management is not an ultimate goal of an enterprise. The ultimate goal of an enterprise is business growth. Resource management is one parameter of business growth. In section 4, we demonstrate that community cloud is the most appropriate model from the perspective of business growth for supply-driven enterprises. Thus we conclude that the community cloud is the best for SCM optimization of supply-driven enterprises. We use truncated Gartner formula [15] in our simulations. For accurate results, we suggest the following Gartner formula which needs data for three consecutive years: Return on investment (ROI) for the year N: ROI(N) =
(Net company profit during year N / Net IT investment during year N)*50% + (Net company profit during year N–1 / Net IT investment during year N–1)*30% + (Net company profit during year N–2 / Net IT investment during year N–2)*20%
Inventory Turns (InT) for the year N: InT(N) =
(Goods sold from inventory during year N)/(Ave inventory investment during year N)*50% + (Goods sold from inventory during year N–1)/(Ave inventory investment during year N–1)*30% + (Goods sold from inventory during year N–2)/(Ave inventory investment during year N–2)*20%
Revenue Growth (RG) for the year N: RG(N) =
((change in revenue during year N) * 50%) + ((change in revenue during year N – 1) * 30%) + ((change in revenue during year N – 2) * 20%)
The business growth (BG) for the year N is given below [15]: BG(N) =
(Enterprise’s user satisfaction * 25%) + (SCN partner users’ satisfaction*25%) + (ROI(N)*25%) + (InT(N) * 15%) + (RG(N) * 10%).
Acknowledgement:
This work is supported by Kuwait University, Research Grant No. [WI
07/11].
References [1] [2] [3]
Agarwal A, Shankar R, and Tiwari MK (2006) Modeling the metrics of lean, agile and leagile supply chain: An ANP-based approach. European Journal of Operational Research 173(1):211-225 Balaouras S, Yates S, Staten J, Kane C (2009) How the Cloud Will Transform Disaster Recovery Services. Infrastructure & Operations Professionals, July 24 Cataldo M, Wagstrom P, Herbsleb J, Carley K (2006) A Fine-Grain Measure of Coordination: Implications for the Design of Collaboration and Awareness Tools. Human Computer Interaction Consortium 2006 Winter Workshop, Fraser, CO. 1-5 February 2006
[4] [5] [6] [7] [8] [9] [10] [11] [12]
[13] [14] [15] [16] [17] [18] [19] [20] [21]
Dell Compellent (2011) Self-Service Provisioning and the Private Cloud. Dell white paper March 2011 An EMA White Paper (2011) Cisco UCS: A Real-World TCO Analysis. Enterprise Management Associates, Boulder, CO 80301, April 2011 Fox MS (2202) Integrated Supply Chain Management. Enterprise Integration Laboratory, University of Toronto, Canada, 2002 Gunasekaran A, Ngai EWT (2004) Information systems in supply chain integration and management. European Journal of Operational Research 159(2):269-295 Hull BZ (2005) Are supply (driven) chains forgotten? International Journal of Logistics Management 16(2):218 – 236 Izza S, Imache, Vincent RL, Lounis Y (2008) An Approach for the Evaluation of the Agility in the Context of Enterprise Interoperability. Enterprise Interoperability III, Part I pp 3-14 Maitland J (2011) Amazon GovCloud lurches toward private vs. public cloud. SearchCloudComputing.com, TechTarget network 18 August Microsoft Corporation (2008) Microsoft System Center Virtual Machine Manager 2008. General overview white paper Nagurney A (2009) A system-optimization perspective for supply chain network integration: The horizontal merger case. Transportation Research Part E: Logistics and Transportation Review 45(1):1-15 Naumann F, Leser U, Freytag JC (1999) Quality-driven Integration of Heterogeneous Information Systems. VLDB pp 447-458 Plankers B (2011) Policing the private cloud, Strategies for building a private cloud. Private Cloud e-zine 1(2) May Pettey C, Steven H (2011) Gartner Announces Rankings of Its 2011 Supply Chain Top 25. Gartner Press Release, Scotsdale, Arizona, June 2 Sherehiy B, Karwowski W, Layer JK (2007) A review of enterprise agility: Concepts, frameworks, and attributes. International Journal of Industrial Ergonomics 37:445–460 Slack E (2011) How to Track the Cost of Storage - what is Storage TCO and why should you care? Storage Switzerland, August 30 Subramanian K (2011) Public Clouds. A whitepaper sponsored by Trend Micro Inc Swafford PM, Ghosh S, Murthy N (2008) Achieving supply chain agility through IT integration and flexibility. International Journal of Production Economics 116(2):288-297 Varia J (2011) Amazon web services - architecting for the cloud: best practices. Amazon Web Services, January Whitepaper (2011) Reality Check – A Smart Business Continuity Strategy Can Offer Maximum Results at Minimum Cost. CDW Corporation