Change Awareness in Software Engineering Using Two Dimensional Graphical Design and Development Tools James Tam Department of Computer Science University of Calgary 2500 University of Calgary Calgary, T2N 1N4 Canada +1 403 220 3532
[email protected]
Lorin McCaffrey Frank Maurer, Saul Greenberg Software Development Department of Computer Science Tec4 Systems Inc. University of Calgary 215A 10th Street N.W. 2500 University Dr. N.W. Calgary, T2N 1V5, Canada Calgary, T2N 1N4 Canada +1 403 283 8876 +1 403 {220 3531, 220 6087}
[email protected] {maurer, saul}@cpsc.ucalgary.ca
ABSTRACT In this paper, we discuss several display mechanisms for representing changes in the UML (Unified Modeling Language) class diagrams: animated replays [5,6], storyboards [3], iconic representations and a documentation method. These display mechanisms were implemented in a prototype UML editor. We present the results of an empirical interface refinement study that was conducted to determine the strengths and weaknesses of the four change display mechanisms. The results show some preference for the symbolic presentation of changes, specifically that most study participants liked the documentation method best. Qualitative result summaries are given for documentation and the other mechanisms. Keywords Change Awareness, UML design, groupware 1 INTRODUCTION Quite often software development projects are very large and the documents produced are constantly evolving over time. Not only does a developer have to keep up with what changes have occurred, they might also have to determine if these changes are relevant to them and if so how will they will deal with these changes. If the project is even moderately large, this process can be quite challenging. As described by Luqi [8], “A change in one module can trigger a change in another, which can trigger further changes in a chain of indirect effects. The extent of such chains can be difficult to predict without computer assistance, especially for complex systems.” Change Awareness is the ability to keep up with changes that were made to development documents. Tam, J., McCaffrey, L, Maurer, F. and Greenberg, S. (2000) Change Awareness in Software Engineering Using Two Dimensional Graphical Design and Development Tools. Report 2000-670-22, Department of Computer Science, University of Calgary, Alberta, Canada, October. http://www.cpsc.ucalgary.ca/grouplab/papers/index.html
2 PURPOSE OF THIS STUDY This study deals with only a subset of these problems. Its focus is two-fold: 1) Evaluate examples of different asynchronous change display mechanisms to determine the effectiveness of each for models of software using a subset of the UML as an example. In real time (synchronous) projects when a developer modifies the work, the changes will immediately show up for the other developers. For non-real time environments (asynchronous), the changes made by one person will not immediately show up for another person until either explicitly requested or a specific period of time has passed. 2) Gain some insight into how software engineers currently handle the issue of Change Awareness. 3 THEORETICAL BASIS AND PREVIOUS WORK Much of the theoretical basis for this study comes out of the work of Gutwin and his Ph.D. Thesis [6], which discussed the issue of workspace awareness in real time groupware (collective workspace) environments. Even though he concentrated on being aware of changes to a real time groupware environment and we are focusing on awareness of changes in a project in a non-real time environment only a few adaptations of his framework were necessary. In his thesis, Gutwin described several different methods of portraying change related information [6]. These methods can be classified along two different dimensions, placement and presentation. In terms of placement, a change indicator can either have situated or separate placement. The placement for a change indicator is said to have situated placement if the change related information is located with the item that changed. The placement is said to be separate if the change related information is located in a different place from where the change occurred (perhaps in another part of the window or
in an entirely different window). Another way of categorizing the method in which change related information could be communicated is by how the information is presented. Change related information could either be communicated literally or symbolically. If all of the change-related information is described in the same form that it is gathered then the information is said to be communicated literally. If only some subset of the information or a synthesized version thereof is used to describe a change, then the information is said to be communicated symbolically.
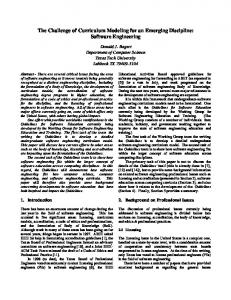
Figure 1: Using color to indicate if a class had changed or not In addition to this different intensities of color were used to indicate how many changes had been made to the class. For the purposes of this study, we define one change as being the addition of a new method or attribute to a class, the deletion or modification of an existing method or attribute of a class or the spatial movement of a class.
In addition to this, Gutwin described several basic questions, which we used as a starting point in determining what type of information should be captured in a groupware type of interface. The questions that we asked during the study included the following: •
Did any changes occur and if so roughly how many changes occurred?
•
Who initiated the change?
•
What were the changes made?
•
When were the changes made?
•
How were the changes made?
The more changes that had been made to a class, deeper a shade of red would be used. As shown in figure 2 below, class Foo has undergone one change so it’s shading of red is the faintest. Class Bar has undergone two changes so that it is shaded in a deeper value of red. Finally class Coca has been changed the most, having been changed three times so that it has the deepest value of red.
4 METHODOLOGY USED HTML image maps were used to implement examples of change indicators. Each participant could view and interact with a prototype UML editor. There were four different versions of the prototype created, one for each of the different ways that changes could be presented. This prototype simulated a software-modeling tool and depicted a software project consisting of a number of classes that had previously undergone a series of changes. The diagrams were annotated with change information presented in a variety of formats, and test participants were asked a series of questions related to those changes. The within-subjects design of the study also allowed us to ask the participants for comparison opinions between sets of indicators. The results can be used to determine which types of visual indicators are the most useful in helping developers keep track of changes in graphical representations of software.
Figure 2: Using color value (shading) to indicate how much a class had changed. Thus the color change indicator will therefore be used to communicate two things: •
Has a particular class changed or not?
•
Roughly how many changes have been made to the class?
Essentially the method of using color to communicate changes at the class level is a situated and symbolic means of representing change. It is situated because the change indicator is presented as a part of the class (where changes have taken place). It is symbolic because the indicator does not literally show all of the changes that have been made to the class but merely shows some representation to indicate that the class has been modified and how much that it has been modified.
Because class diagrams commonly show a hierarchy of information for each class (each class contains nested data and method fields) our prototypes included two levels of change indicators. At the class level, color was used to indicate that a change has taken place in the class. Classes that were changed were colored red while unchanged classes retained their original (tan/yellow) color. In Figure 1, below class Bar is colored red to indicate that the class has somehow changed while class Foo retains the original color for class diagrams indicating that it hasn’t changed.
The reason that it was decided to use a symbolic and situated change indicator at the class level is simple. This was done in order to not overwhelm the user with all the minute details of changes that occurred to the class. This way the user is presented with a choice, they can either see only the coarse view of the changes (communicated by color values) or they can choose to see the detailed view of 2
When the tester clicks on a class for the animated replay display method [5,6], all the changes that were made to that class would be shown to the user. However this decision created a few limitations for this study (please refer to the section 8, titled “Limitations of the Study”).
the changes that took place on a class-per-class basis (the second level). Because the participant can always use the four display mechanisms we implemented to see more detail about class level changes (as well how those parts changed) we wanted color to provide an at-a-glance method of indicating to the user that a class had changed and roughly how much it had changed. As mentioned by Lyn Bartram [1] when referring to the work of Woods [10], “…graphical representations such as shape, symbols, size, color and position are very effective in information visualization because they are mentally economical [you can notice them without conscious effort]”. In a way these color indicators are similar to the “wear” indicators that were discussed by Hill et al. [7]. Hill suggested using color in a spreadsheet to show how often each cell had been used.
Since it was decided not to make the relationships between classes manipulatable by the test participants, all of the relations pertaining to a class would also have their changes replayed at the same time that the changes to the class were shown. 4.2
This change display mechanism used a storyboard [3] to display the changes that have occurred to the class diagram. The storyboard technique [3] illustrates the changes that took place by capturing them with a series of still frames. There was a frame created in the storyboard [3] for each change that was made (c.f. Figure 4). Users can enlarge any storyboard [3] frame into an expanded view. Extra information about the change (who executed it and when) is given at the top of the expanded frame when this is done.
When the amount of information needed about changes to a diagram is more than can be answered by the class level change display mechanism (color), the user of the prototype looks to the method/attribute level change mechanism. For this second level mechanism, we compared the use of four different of methods of displaying changes, animated replays [5,6], storyboards [3], icons, and documentation (that provided textual descriptions of changes that were made). The example implementations that we used of these four methods are shown below in table 1.
4.3
Presentation
Separate
Literal
1) Animated replay [5,6]
2) Storyboard [3]
Symbolic
3) Iconic
4) Documentation
Table 1: Classifications of change indicators used in this study 4.1
Symbolic and Situated
Iconic representations are attached to objects that have changed (c.f. Figure 5). Icons could be attached differently to graphics in order to distinguish specific field changes (to attributes & methods) from changes made to classes as a whole. Changes pertaining to the whole class would place the icon in the upper left hand corner of the class diagram. Changes that were made to the fields of the class would place the icon on the right hand side of the field that had changed. Additionally, the icon that indicated that the class had changed would be larger than the icons that indicate that fields in the class had changed. In both cases, extra information about the change (who executed it and when) was given in a text-callout if a participant clicked on an icon.
Placement Situated
Literal and Separate
4.4
Symbolic and Separate
This technique used written documentation that described the changes that have taken place (c.f. Figure 6), which appears in a separate window below where the window where the changes occurred. The documentation describes the executor of the change, as well as the date and time the change took place.
Literal and Situated
This change display mechanism employed playback animations of changes that took place on selected classes in the class diagram (c.f. Figure 3) to illustrate the changes that were made. These animations would show an exact replay [5,6] of the changes that were made. If a class were deleted from the diagram then an animation of the class gradually disappearing would be displayed. If a class was moved within the display, then the animation would show the class traveling from its original location to its new location.
5 TEST PARTICIPANTS The test participants for this study were chosen from the Computer Science and Computer Engineering programs at the University of Calgary as well from industry. The participants were expected to have at least a basic understanding of UML. This study required the participation of at least eight participants (four for the pilot and four for the main study). Nine participants were run through the study.
Since it was thought that playing back all of the of changes made to the entire diagram all at once would a bit overwhelming for test participants, it was decided in this study to have changes displayed on a class-by-class basis. 3
Study participants would see literal replays of the last user’s actions on the class diagram.
Figure 3: Animated replay of changes (literal and situated representation of changes) [5,6]
Storyboard pane
Extra change information Detail pane
Figure 4: Storyboard replay of changes (Literal, separate representation of changes) [3] 4
Class level change Indicator.
Field level change indicator.
Ghosted image indicating class movement.
Extra change information
Figure 5: Iconic representations of changes (symbolic, situated representation of changes)
T h e d o c u m e n ta tio n m a k e s n o te o f th e e x e c u to r o f th e c h a n g e s a s w e ll a s th e d a te a n d tim e th e c h a n g e to o k p la c e .
Figure 6: Documenting changes (symbolic, separate representation of changes) in the form of documentation 5
Finally the participant was asked for their opinions on how to modify the change display mechanism so that it would be more effective at portraying changes. This procedure (exploring the diagram and answering the postscenario questions) was then repeated for the remaining three scenarios.
6 Procedures Used Beforehand, we prepared a mock-project using UML and then, using this base project as our starting point each time, performed four sets of changes to the class diagram. Each change set included four basic changes: the addition of information to a diagram, the deletion of existing information from the diagram, the modification of existing information on the diagram and the movement of different parts of the diagram. The examples we chose for each of those changes were ones we deemed to be typical of changes an engineer might make to a UML diagram, such as adding new subclasses, or adding and removing class attributes. All test participants were exposed to each change display mechanism (a withinsubjects design). Each change display mechanism was shown displaying a different set of changes, to eliminate memorization. As well, the order of change display mechanisms was randomized so that learning would not bias the results in favor of any one mechanism.
When the participant had completed all four of their assigned scenarios (and viewed all four change display mechanisms), then the post-test interview was administered. During this interview we asked the participant to indicate which change display mechanism they preferred and why they preferred it. Additionally they were asked to describe any other methods that they would employ if this were a real software project that they were working on and they were trying to keep up with the project. . This way we not only discovered which change display mechanism performed best for the participant but also gained some understanding of how people currently cope with the issue of change awareness in the absence of any change awareness support.
Each participant was first asked to fill out a pre-test questionnaire. The main point of the pre-test questionnaire was to determine the amount of experience that the person has working in the field of Computer Science as well as their skill and knowledge with the UML. These questions could possibly be used later to determine if there is any relation between computer experience and UML knowledge and the preferences that they have towards each type of change indicator. Each person filled out the pretest questionnaire prior to beginning the study.
7 FINDINGS From the data we gathered, some general things can be said about change awareness in software engineering, independent of the change display mechanism used to display those changes. A common occurrence that was observed in all cases was that the participants either did not like or were confused by the representation of movement (c.f. Table 2). This is likely because UML diagrams are two-dimensional graphical representations of program code (where spatial movements do not carry any semantic meaning). Even though class diagrams can be shifted around in the two dimensional UML representation, there is no analogy for
Next, the test participant was shown the first test scenario. They were told that they had been away from their work project for a period of time and they must determine what has changed (due to other members of their work group) since the last time that they worked on the project. The person was given a period of time in which they can familiarize themselves with the prototype and the mockproject. This period of time was not fixed so that participants could take as long as they wished to familiarize themselves with operation of the prototype.
Replay
After this brief exploratory period, the post-scenario interview was administered to the person. The questions during the post-scenario interview attempted to determine if the person understood how the change display mechanism worked. In addition to this, specific questions about the changes that were made to the project were asked, such as what parts of the project had changed and how, and who made the changes and when.
Tester 1
X
Tester 2
X
Storyboard
Documentation
X X
Tester 3
X
X
Tester 4
X
X
Tester 5
X
X
Tester 6
Also, the participant was asked to rate the effectiveness of the change display mechanism on a Likert scale from one to five. One was described as “Useless” and five was described as being “Very Effective”. The person was then asked to provide details for their rating choice.
Icons
X
X X
Tester 7
X
X
Tester 8
X
X
Tester 9
X
Total
2
5
X
5
7
Table 2: Testers who had problems explaining the move operation or missed it entirely cross-referenced by scenario. 6
customizable color-coding scheme a user could decide how different changes were represented with different colors.
this type of change in the text based representation. Also three of the test users mentioned that movement should not be a spatial move but instead should be a hierarchical one. A hierarchical move occurs when a class has been deleted from one package and added to another package. As expected, all three of these test participants had mentioned that this type of move was very important and should have been represented in the Change Awareness system rather than representing spatial moves.
In addition to these general findings, we were able to determine the strengths and weaknesses of the specific change display mechanisms we used. At first glance, it appears there was a significant difference in preference between the different change display mechanisms (c.f. Table 3). Over half the users indicated that they thought that Documentation was the best method.
In addition to this domain-specific confusion about movement, the individual change display mechanisms were able to show movement in only limited (and sometimes unclear) ways, as will be mentioned in the section called “Type II Findings”. Related to the issue of movement is user configurability of the change display mechanisms. There were many comments supporting idea of being able to filter out irrelevant changes (especially movement). As well, user modification of the granularity of the change display mechanisms seemed to be a recurring topic in the post-scenario and post-test interviews.
•
•
Number of test users who rated this method as best
Replay [5,6]
1
Storyboard [3]
1
Iconic
2
Documentation
5
TOTAL
9
Table 3: Summary of User Preferences However, the participants’ comparative ratings did not suggest such a significant difference. Documentation rated, on average, only 0.5 points higher than the second place mechanism on a five-point scale (c.f. Figure 6)
Another observation made by several participants was that displaying changes in hierarchical form was a good idea. As previously mentioned, a coarse change indicator (color) was used to indicate that some changes have occurred. If the user was interested in seeing more information related to the changes, then this information could later be explicitly requested. Everyone who was run through the study was successful in equating the coarse indicator (color) with a changed item. However many of the people misinterpreted the meaning of our use of color value: •
Method of Representing Changes
Comparative Ratings 5 4.5 4 3.5 3 2.5 2
Four people thought that different colors should be used to represent different types of changes (they indicated that currently classes that were colored differently were changed but they did not explicitly explain how color and change were related).
1.5 1 Replay
Storyboard
Iconic
Documentation
Display Mechanism
Figure 6: Comparative ratings of mechanisms In addition to these comparative numbers, we collected a large amount of qualitative data about the usability of the individual display mechanisms. For any change display mechanism, the strengths and weaknesses can be classified at three levels:
One person had guessed that the color value (shading) was correlated with the number of changes that had been made but this person was unsure of themselves and also indicated that they might have thought color value was used to indicate the type of change.
I.
Strengths and weaknesses that are due to qualities inherent in the specific quadrant in the presentation/placement table (Table 1) and would be present in any examples of such. We will describe these as a ‘Type I’ findings.
II.
Strengths and weaknesses that are due to the example method of implementation we chose to represent the specific quadrant (storyboards [3], for example) and would be present in any implementation of that example. We will use the
Another person totally misinterpreted the use of color and thought that color was already used to indicate the type of changes that were made.
Obviously, some mechanism for indicating exactly how color relates to change (the number or type of changes made) must be clearly indicated to the user, otherwise there is a great potential for confusion. Perhaps the use of a legend or color key would be useful here. With a 7
What was somewhat more surprising to us was that many of the test participants mentioned that they had problems with movement in the case of the Iconic representation as well. Since there is a sort of “ghosted out” image (c.f. Figure 5) showing the path the class had been moved, it was thought that this change indicator for the movement of items would have been clearer than it was.
term ‘Type II’ to classify these findings. III.
Strengths and weaknesses that are due to our own implementation of the specific mechanism (our version of the storyboard [3] as opposed to someone else’s, for example). Weaknesses in this category can be considered confounds and will be discussed as such in the limitations section.
Storyboard [3] The major drawback of the storyboard representation was the fact that the user was still doing before-after comparisons, only this time on a frame-by-frame basis. Far too much clicking (back and forth between frames) and comparing between frames was needed to retrieve all the change information. However, the storyboard representation provided a chronological overview, and a convenient way to determine approximately how many changes had occurred since the user last saw the project (one need only count the frames).
7.1 Type I findings Situated vs. Out-of-Place One noticeable trend in the qualitative data collected was the user’s comments on gaze shifting when using separate change indicators (storyboard [3] and documentation). In these mechanisms, the system is queried for change information by a mouse click on the part of the user. The results of this query appear in a separate window from where the action occurred. This forces the user to gazeshift, or look back and forth between the change information and the location to which it refers. Many of our test participants found this to be a lot of work.
As well, some actions do not lend well to storyboard display. It was thought that movement might be a problem in at least some of the cases since the only way that users could determine that something had moved from one frame to the next was by comparing the position of classes from frame to frame. This is supported by the fact that over half the people tested noted difficulties with movement in the case of the storyboard (c.f. Column 2 in Table 2). Deletions proved to be quite hard to identify as well.
Symbolic vs. Literal Participants expressed a liking for symbolic methods over literal methods, especially in terms of speed. It seems the symbolic methods (iconic and documentation) can abstract a complicated series of change steps into a quickly readable format. The information presented by the literal methods actually seemed to take longer for participants to absorb.
Replay [5,6] The data collected suggests that most actions are immediately identifiable to a user when an exact replay is shown. User control of the replay (speed, level of detail or frame rate) was not available in our prototype, and elicited some negative responses from our participants. It is suggested that any future implementations strive to address these concerns.
7.2 Type II findings Documentation A typical reason given as to why documentation was the preferred method was because it was described as being, "fast and efficient". You could see all of the changes related to a class with only one mouse click. Several of the users thought that it provided the richest potential for describing changes but that an automated system should also provide the ability for users to append their own custom documentation to system generated documentation of changes.
Yet another comment that was made by the test participants was that they wanted to have the option of seeing the current version of the project. This was often found to be a comment made in the case of the replay method (c.f. Figure 3) where two users said they would have wanted an overlay of the current version of the project that they could compare to while the animations showing changes took place. This is consistent with the fact that six of the users said that in the absence of any automated change awareness support, they would do some sort of before and after comparison of changes in order to track the changes that occurred.
However, almost every test user had trouble with the movement change in the case of the documentation method. This was expected because what the documentation used was a text description of changes and it is difficult to be able to describe how an item moves in space using only written descriptions. Iconic Changes were displayed symbolically using icons. The time it took our participants to learn the meanings behind the icons was reassuringly short, although is still worth mentioning that the familiarization process was not automatic. The main benefit of this method was the quick recognition of how many changes had occurred and what these changes were.
7.3 Information Indirectly Derived From This Study Indirectly this study also provided some insight into some of the information that users thought was important with regard to a change. This study asked questions about: 8
What changed? How did these things change? Who made these changes? When did they make these changes?
9 CONCLUSION Showing change information in a software engineering project is a daunting task. Tool developers have a variety of means of displaying change information in UML editors, with some benefits and drawbacks to each method. In this study, medium fidelity prototypes were used to test the effectiveness of several change display mechanisms, one from each quadrant of Gutwin’s [6] presentation/placement table. Situated methods required less shifting of the user’s gaze, while symbolic methods were able to abstract complicated change actions into a quickly readable format. Out of the four change display mechanisms the authors implemented – animated replay [5,6], storyboards [3], icons, and documentation – the documentation method was best liked among test participants.
It was noted by most of the test participants that in real life that if this was a real software project that they were working on and they were trying to track the changes made to it, the person would simply ask the person who made the changes. This indicates that it is important that the “who” information be imparted. Additionally, three of the test participants indicated that it was very important to determine why a change was made. They mentioned that quite often this is one of the most important pieces of information related to a change. As was noted by one participant, the higher meaning behind the change, such as the change in requirements as demanded by the customer, could be invaluable information.
As the comparative data was not overwhelmingly in any one method’s favor, we are not able to suggest any of our implementations of change display as the best for software engineering. However, the results do suggest that future research should be directed towards symbolic methods for representing change, as their abstraction abilities seem to provide the most benefits. A multileveled approach as used in our prototypes (class color indicating some changes have occurred, followed by querying of the system for more detail) is promising. Flexibility of the display mechanism to change with changing work situations such as the inclusion of a user configurable filtering mechanism, should also be given high priority in future projects.
8 LIMITATIONS OF THE STUDY There are a number of limitations / simplifications that were made for the purposes of this study: Although test participants are told to imagine that they are software designers / developers that are working in a real world software project, in reality, a software designer would have seen the project before and therefore have some memory of the project before the changes were made. Our participants were asked to act out this role without the benefit of this memory. The test participants included computer science students who were currently enrolled in or had completed undergraduate software engineering courses as well as graduate software engineering students who were working in industry. It is likely that the experience and knowledge of these groups differ and this may have an effect on the findings of the study.
REFERENCES 1. Bartram, L. Perceptual and Interpretative Properties of Motion for Information Visualization, Technical Report (CMPT-TR: 1997-15) from Simon Fraser University, 1997.
Medium fidelity prototypes were used instead of fully implemented systems. Consequently this meant that not all features were available. One effect was that not all of the change indicators presented enough information to be able to answer the questions in the questionnaires and interviews. For instance, the replay method did not allow test users to determine who made a change, when the change occurred or the order in which the changes took place. In addition, many elements in the class diagram did not provide the same level of detail. For example, class relationships – the ‘arrows’ in UML – were not clickable and could not be queried for more information about the changes made to them (addition, deletion, etc). Most of the data that was gathered from this study is qualitative in nature and took the form of summaries of the interview responses as well as observations. The possibility for bias from the researchers in these recording techniques should not be ruled out. 9
2.
Booch, G., Rumbaugh, J., Jacobson, I. The Unified Modeling Language User Guide, Addison Wesley Longman, 1999.
3.
Dix, A., Finlay, J., Abowd, G., Beale, R. HumanComputer Interaction, Prentice Hall, 1993, 176 & 367.
4.
Fowler, M., Scott, K. UML Distilled, Addison Wesley Longman, 1997.
5.
Gutwin, C., Greenberg, G. Design for Individuals, Design for Groups: Tradeoffs Between Power and Workspace Awareness, Proceedings of the Conference on Computer-Supported Cooperative Work, Seattle, ACM Press, 1998, 207- 216.
6.
Gutwin, C. Workspace Awareness In Real-Time Distributed GroupWare, A Ph.D. Thesis, University of Calgary, 1997. Available from http://www.cs.usask.ca/faculty/gutwin/publications/
7.
Hill, W., Hollan, J., Wroblewski, D. and McCandless, T. Edit Wear and Read Wear, Proceedings of the Conference on Human Factors in Computing Systems, New Orleans, The Association for Computing Machinery, 1991, 3 – 9.
10. Woods, D. Towards a theoretical base for representation design in the computer medium: Ecological perception and aiding human cognition. In, Flach, Hancock, Caird and K. Vicente (Eds.), An Ecological Approach to Human-Machine Systems I: A Global Perspective, pages 157-188. Lawrence Erlbaum Associates, 1995.
8. Luqi. A Graph Model for Software Evolution, IEEE Trans. Software Eng., 16, 8 (Aug. 1990), 917 - 927. 9. Rumbaugh, J., Jacobson, I., Booch, G. The Unified Modeling Language Reference Manual, Addison Wesley Longman, 1999.
10