The International Archives of the Photogrammetry, Remote Sensing and Spatial Information Sciences, Volume XLII-3, 2018 ISPRS TC III Mid-term Symposium “Developments, Technologies and Applications in Remote Sensing”, 7–10 May, Beijing, China
CHANGE DETECTION OF HIGH-RESOLUTION REMOTE SENSING IMAGES BASED ON ADAPTIVE FUSION OF MULTIPLE FEATURES GuangHui Wang1,2,*, HuaBin Wang2, WenFeng Fan2, Yu Liu2, ChenChen2 1
China University of Mining and Technology, Xuzhou 221116,
[email protected] 2 Satelite Surveying and Mapping Application,NASG,Beijing 100830,China Commission III, WG III/1
KEY WORDS: Change Detection, Color Gistogram, Linear Gradient Histogram, EMD distance, Histogram Curvature
ABSTRACT: In view of the traditional change detection algorithm mainly depends on the spectral information image spot, failed to effectively mining and fusion of multi-image feature detection advantage, the article borrows the ideas of object oriented analysis proposed a multi feature fusion of remote sensing image change detection algorithm. First by the multi-scale segmentation of image objects based; then calculate the various objects of color histogram and linear gradient histogram; utilizes the color distance and edge line feature distance between EMD statistical operator in different periods of the object, using the adaptive weighted method, the color feature distance and edge in a straight line distance of combination is constructed object heterogeneity. Finally, the curvature histogram analysis image spot change detection results. The experimental results show that the method can fully fuse the color and edge line features, thus improving the accuracy of the change detection.
1. INTRODUCTION With the rapid development of spatial information technology, the spatial resolution, spectral resolution and temporal resolution of remote sensing images are continuously improved. The acquired surface information is more abundant and the fields of application are more widely used. How to make use of abundant feature information of high-resolution remote sensing images and suppress information interference caused by imaging conditions and natural conditions has become a hot issue in remote sensing image change detection research. The traditional single-pixel and single-feature change detection algorithm cannot meet the accuracy and completeness of the change detection (Wei, L. et al., 2010). Therefore, objectoriented multi-feature fusion change detection algorithm (Gong, J.Y. et al., 2008 and Zhang G., Li Y., Li Z., 2010.) becomes the focus of high-resolution remote sensing change detection. The multi-feature derived from the image is the carrier of the change detection information, which mainly includes the features of spectrum, edge and texture. Image object features are used for multi-temporal change detection. The usual change detection algorithm uses a single feature, such as Bovolo and Bruzzone (2008), which uses image spots mean information to detect the change; Zhuang Huifu and Deng Kaizhong et al. (2016) proposed the image texture detection algorithm based on texture features, which builds differential images through multidirectional and multiple texture features to improve the accuracy of change detection; Li Song et al. Li S. (2010) proposed a change detection algorithm based on texture analysis and ratio transformation, which effectively analyzes the landslide disaster information by analyzing the texture features and calculating the texture indexes; Wang R. et al. (2005) put forward the line feature change detection algorithm, which obtains the change detection result by extracting the edge gradient information, compression and fitting of the image and avoids the complicated process of line matching, and has strong practicability. These algorithms above verify the validity and usability of the feature from different perspectives. However,
the applicability and accuracy of the single feature model are not ideal. Li L. et al (2014) combined the spectral information with the texture information to propose a multi-feature fusion change detection algorithm. Wei L. et al. (2013) proposed a multi-feature popular embedding model, which fully integrated multi-feature information to obtain complete change information. The above multi-feature fusion method mostly uses the features of spectrum and texture, failing to consider the color space distribution information and the image edge feature. In order to make full use of the color space distribution information and the edge linear gradient feature of the remote sensing image, this paper borrows the ideas of object oriented analysis proposed a multi feature fusion of remote sensing image change detection algorithm. First using multi-scale segmentation algorithm for image object segmentation and calculate the color histogram and edge linear gradient histogram information of the image object; then utilizing the color distance and edge line feature distance between EMD statistical operator in different periods of the object, using the adaptive weighted method, the color feature distance and edge in a straight line distance of combination is constructed object heterogeneity; the closer the heterogeneity of the object to zero, the lower the possibility of change, and the higher the possibility of changing away from zero. Based on the above theory, the histogram curvature analysis is used to obtain the change of the spot detection result. 2. CHANGE DETECTION BASED ON MULTIFEATURE FUSION 2.1 Image segmentation Image segmentation is the basis of object-oriented image analysis, the results will have a significant impact on subsequent analysis (Wu Z., 2013). In this paper, the multiscale segmentation algorithm (Chen Y., et al., 2006) is adopted. By calculating the eigenvalues of the shape and spectral heterogeneity of each band, the algorithm adaptively determines the weight according to the information of each band. Through
This contribution has been peer-reviewed. https://doi.org/10.5194/isprs-archives-XLII-3-1689-2018 | © Authors 2018. CC BY 4.0 License.
1689
The International Archives of the Photogrammetry, Remote Sensing and Spatial Information Sciences, Volume XLII-3, 2018 ISPRS TC III Mid-term Symposium “Developments, Technologies and Applications in Remote Sensing”, 7–10 May, Beijing, China
iterative calculation, until the image object's shape and spectral weight is greater than the given weighted threshold, stop the iteration to complete multi-scale image segmentation. For any band of image i , its heterogeneity is given by:
fi i hcolor (1 i )hshope
(1)
hshope (1 sm )hcm sm hsm
(2)
Where i is the weight of the spectral heterogeneity hcolor in the
i
band, and the shape heterogeneity hshope is determined by the
weight of the shape smoothness, the shape smoothness hsm , and the shape compactness
hcm .
quantized into 5 parts. Finally, the color histogram of the image object is obtained. 2.2.2 Linear feature extraction: The texture of high-resolution remote sensing images is rich. When using such algorithms as canny, soble and lapace to directly extract the edges of low-rise buildings, the edges are rather trivial and it is difficult to express the characteristics of the image objects. In this paper, Line Segment Detector operator (Gioi, R.G.V., et al., 2012) is used to detect objects with obvious geometry in remote sensing images. The gray of a line area is discontinuous. Therefore, a pixel in a straight line corresponds to a gradient direction. A histogram established by the gradient direction of a straight line pixel can represent the shape feature of the image object. The gradient of f ( x, y ) at point ( x, y ) on the image is defined as:
2.2 Color and edge gradient feature extraction:
f ( x, y ) [Gx , Gy ]T [
The paper must be compiled in one column for the Title and Abstract and in two columns for all subsequent text. All text should be single-spaced, unless otherwise stated. Left and right justified typing is preferred. Histogram is a kind of spatial statistical feature, color and edge of the linear gradient histogram can better express the distribution of the spatial characteristics of the object. In this paper, the color histogram and edge linear gradient histogram of image object are used to describe the spectral features and spatial features of image objects of different phases. 2.2.1 Color feature extraction: Color is the most significant, simplest, and most important visual feature of images. Color features have less reliance on the size, orientation and viewing angle of the image. Dou J. et al. (2005) applied the global color histogram to the field of image retrieval. Common RGB model has the following deficiencies: 1) Don’t meet people's perception of color; 2) The difference between the two points in perception is relatively small, which is difficult to express by two points in the color space in the non-uniformly distributed RGB color space. The HSV color space is a visual perception oriented model that meets the three elements of hue, brightness, and saturation perceived by the human eye. Therefore HSV color space is used to extract color features. Color histogram extraction mainly includes two steps: RGB model and HSV model conversion, HSV quantization. First RGB model into HSV model, the specific formula is as follows:
V
1 ( R G B) 3
(3)
3 (4) min( R G B) V GB (5) H 2 G B Where R is the red band image, G is the green band image, and B is the blue band image. After HSV color conversion, every pixel on the image can be represented by H, S, V values. According to the characteristics of human eye perceived color, three components of HSV are not uniformly quantized In this paper. The hue H-space is quantized 8 parts, the luminance Vspace is quantized into 5 parts, the saturation S-space is S 1
f f T , ] x y
(6)
Gradient is a vector whose size and direction are:
G( f ( x, y )) f ( x, y )
Gx 2 Gy 2
(7)
( x, y) arctan(Gx Gy )
(8)
Where ( x, y) is the direction of the maximum variation of the grayscale of f ( x, y ) at this point. Counting linear gradient direction histogram H (i ) based on the direction of linear pixels. The linear gradient histogram characterizes the distribution of the linear orientation of the image objects. The image objects with different temporal phases have different linear distributions. 2.3 Earth Mover’s Distance The degree of change of the image objects in two periods can be expressed by the distance between the objects. Currently commonly used histogram distance are Euclidean distance, pasturing distance, histogram intersection distance, chi square distance and so on. These distances have inevitable drawbacks, only compare differences between the corresponding position of the histogram, which requires the extraction of color features of the image 、 the edge of the linear features must be strictly corresponding. However due to the phenomenon of "same material with different spectrum, same spectral from different materials" in remote sensing images, errors are inevitable. The mathematical model of EMD is described below as: Histogram n bin, the value of each bin is A has binA1 , binA2 , binA3 , , binAn histogram B has n bin, the value of each bin is binB1 , binB 2 , binB 3 ,
, binBn ;
cij i j represents the distance from bini to bin j , xij represents the number of binAi converted into binBj , the
EMD is transformed into the minimum value of
n
n
1
1
cij xij , that is EMD
distance is defined as:
DEMD 1 1 cij xij / 1 1 cij n
n
n
This contribution has been peer-reviewed. https://doi.org/10.5194/isprs-archives-XLII-3-1689-2018 | © Authors 2018. CC BY 4.0 License.
n
(9)
1690
The International Archives of the Photogrammetry, Remote Sensing and Spatial Information Sciences, Volume XLII-3, 2018 ISPRS TC III Mid-term Symposium “Developments, Technologies and Applications in Remote Sensing”, 7–10 May, Beijing, China
2.4 Similarity adaptive combination The combination of color feature and linear feature is one of the keys to achieve multi-feature fusion. The commonly used method is the weighted combination. Set A and B for color distance and edge linear distance, C and D as corresponding weights, then the weighted combination of color and edge line is as follows:
DIS hsv DHSVEMD line DLINEEMD
(a)
(10)
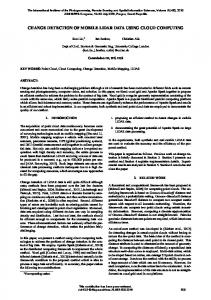
Among them, the determination of A and B become the key issue of feature fusion. The determination of color and edge line weights relies mainly on the following criteria: In a colordominated area, the weight of the color is higher, otherwise the line weight is higher. Literature (Wu Z., 2013 and Wang A., Wang S., Lucieer A., 2010) proposed an automatic weighting method for spectral and texture features in remote sensing image segmentation. However, the determination of weights is too complicated and difficult to promote. Therefore, this paper proposes an adaptive weight determination method. According to the color features of two-phase object, the color and edge linear features are dynamically adjusted. Figure 1 (a) is the vegetation region in 2013, figure 1 (b) and (c) are the color histogram and the edge linear gradient histogram in 2013.Figure 1 (d) is the road constructed in 2015,figure 1 (e) and (f) are the color histogram and the edge linear gradient histogram in 2015.It can be seen that the linear gradient histogram of the two regions are close to each other, but there is a big difference between the color histograms.
(b)
(c)
(d) (e) (f) Figure 2. Edge of the line dominant region Through the above analysis, when the color difference between the current and the post phase is relatively large. the maximum probability of the color histogram difference is relatively large. Hereby, the color and edge line weights are adaptively set according to the color histogram. Definition:
k abs maxft1 max ft 2
In the formula, max (f) is the maximum probability value of the color histogram. The maximum probability value of the color histogram reflects the color information to some extent. Therefore, when the color is dominant, the weight of the color is increased appropriately, and vice versa.
sqrt max max ft1 , max ft 2 , k 0.2 whsv sqrt mix max ft1 , max ft 2 , k 0.2 (a)
(b)
(c)
(12)
(13)
2.5 Histogram curvature analysis Setting
heterogeneous values of all objects is Dn , and the heterogeneity value is close to
D D1 , D2 ,
(d)
(e) Figure 1. Color dominant region
(f)
Figure 2 (a) is the bare land in 2013, Figure 2 (b) and (c) are the color histogram and edge linear gradient histogram in 2013; Figure 2 (d) is the building in 2015, Figure 2 (e) and (f) are the color histogram and edge linear gradient histogram in 2015It can be seen that the color histograms of the two regions are close to each other, but there is a big difference between the linear gradient histograms.
zero, indicating that the possibility of image change is small. Away from zero value areas, the greater the likelihood of change. Most of the images have not changed, then the heterogeneity histogram is a gradual decline form. In this paper, we use the method of heterogeneity histogram curvature analysis to determine the threshold of change detection. The method has strong adaptability. Heterogeneity values of the image objects show a one-sided normal distribution trend, and the heterogeneity values of the changed area and the non-changing area of the object tend to have obvious differences. By analyzing the curvature of the histogram, the threshold value of the change detection can be determined. According to the basic principle of calculus, the smaller the curvature value is, the smaller the curvature of the curve is, and the less the probability of the mutation is. For the discrete data, the curvature value can be approximately expressed as:
This contribution has been peer-reviewed. https://doi.org/10.5194/isprs-archives-XLII-3-1689-2018 | © Authors 2018. CC BY 4.0 License.
1691
The International Archives of the Photogrammetry, Remote Sensing and Spatial Information Sciences, Volume XLII-3, 2018 ISPRS TC III Mid-term Symposium “Developments, Technologies and Applications in Remote Sensing”, 7–10 May, Beijing, China
k
f i 2 f i f i 1
1 f i 1 f i 2
(14)
3/ 2
Where f (i ) is the frequency value corresponding to the i the position. Taking i corresponding to the maximum value k as the optimal threshold for change detection, the final change area is extracted.
(a)
(b)
(c)
(d)
(e)
(f)
3. RESULTS AND DISCUSSION 3.1 Experimental data The experimental data are satellite remote sensing images of ZY-3 in 2013 and 2015 in Suzhou. The spatial resolution of the image is 2.1 meters, which is composed of four bands of blue, green, red and near infrared. Images have been image registration, histogram matching and other pretreatment. The experimental data are 1800 pixels 1420 pixels in an urban area of Suzhou, as shown in Figure 3 (a) and (b).
(a)2013
(b)2015 (c) segmentation result Figure 3. Suzhou City Image
(g) Figure 4. Different weight results of change detection
3.2 Experimental Analysis The multi-scale segmentation algorithm is used to segment remote sensing images after registration and histogram matching, and segmenting the multi temporal remote sensing image, and obtain the image spots with spectral and shape homogeneity. The optimal segmentation scale is mainly determined by people's experience and knowledge. The shape factor is involved in the weight of the shape consistency. The optimal shape factor can obtain the image object with a reasonable boundary. The compactness indicates the regularity degree of the image object. If the degree of compactness is too high, the image features after the segmentation are not unique, and images appear umpire spots. According to the author's experience and knowledge, the segmentation parameters of the image are determined as follows: (a) segmentation scale 100, shape factor 0.45 and compactness 0.5; (b) segmentation scale 80, shape factor 0.5 and compactness 0.64.Then the segmentation results of the previous and the later period are overlaid to generate the final vector file as shown in Figure 3 (c). In order to verify the effectiveness of the multi feature fusion algorithm, a single feature and a fixed weight algorithm are compared with the algorithm in this paper. In Figure 4, the black represents a non - changing region, and the white represents the changing region; the ellipse is a virtual detection area and the rectangle is a leak detection region. Figure 4 (a) is a standard change detection result based on visual interpretation. Figure 4 (b) ~ (f) is the change detection result of the weight of color characteristics of 1, 0.7, 0.5, 0.3, 0. Figure 4 (g) is the result of this article. Table 1 is the accuracy comparison of the six change detection results.
whsv 1
whsv 0.7
whsv 0.5
line 0
line 0.3
line 0.5
Dete ct chan ge
Detect no chang e
Dete ct chan ge
Detect no chang e
926. 63
575.7 9
787. 38
715.0 6
684. 95
Dete ct no chan ge 781. 23
319. 83
979 0.90
391. 94
9682. 54
380. 51
9312. 45
1004 .78
105 72.1 3
131 8.57
10258 .33
116 7.90
10409 .01
Dete ct chan ge Actual changes Actual no changes Total False Detectio n rate Missing Detectio n rate Correct rate
0.318
0.297
0.326
0.533
0.383
0.463
0.905
0.909
0.873
whsv 0.3
line 0.7 Dete ct chan ge
Dete ct no chan ge
whsv 0
line 1 Dete ct chan ge
Detect chang e
This contribution has been peer-reviewed. https://doi.org/10.5194/isprs-archives-XLII-3-1689-2018 | © Authors 2018. CC BY 4.0 License.
Algorithm in this paper Dete ct no chan ge
Detect chang e
1692
The International Archives of the Photogrammetry, Remote Sensing and Spatial Information Sciences, Volume XLII-3, 2018 ISPRS TC III Mid-term Symposium “Developments, Technologies and Applications in Remote Sensing”, 7–10 May, Beijing, China
Actual changes
1110. 882
355. 293
128 8.89 9
177.2 76
117 4.86 6
327.5 81
Actual no changes
594. 31
973 5.95
867. 573
9243. 16
374. 53
9699. 93
Total
1705 .19
987 1.72
215 6.47 2
9420. 435
154 9.34
10027 .51
False Detectio 0.349 0.402 0.242 n rate Missing Detectio 0.242 0.121 0.218 n rate Correct 0.918 0.910 0.939 rate Table 1. Accuracy comparison by method with different weights The analysis of the chart can draw the following conclusion: Figure 4 (b) only uses color features for change detection, which has more false detection and some missing detection. Figure 4 (f) only uses the edge line features for change detection, and the leakage detection is very serious. Color features and edge linear features weighted for change detection. When the color weight is 0.7, although false part of Figure 4 (c) is marked as non-change, but there are still some missing detection. When the color weight and edge line weight are both 0.5, there is more missing detection and false detection in Figure 4 (d). When the weight of color is 0.3, compared with Figure 4 (c) and (d), the false detection decreases, but the missing detection increases. Using the algorithm to detect the change in this paper, there is still some false detection and missing detection in the changing region of Figure 4(g), but the false detection rate and missing detection rate are lower than the fixed ones. The algorithm is compared with the method of determining the weight of literature (Wu Z., 2013) and literature (Wang A., Wang S., Lucieer A.,2010) (Table2). The experimental results show that the accuracy of this method is high. Literature Variance threshold=20
Literature Spectral weight=0.5
Algorithm in this paper
False Detection 0.319 0.316 0.242 rate Missing Detection 0.208 0.246 0.218 rate Correct rate 0.926 0.919 0.939 Table 2. Change detection accuracy comparison of the for algorithms 4. CONCLUSION In this paper, a multi-feature fusion algorithm for remote sensing images change detection is proposed with the objectoriented analysis theory. The adaptive weighted combination of color features and edge line features is achieved, which provides a way to detect the change of HSV color histogram and edge linear gradient histogram. Histogram curvature analysis is used to obtain the change detection results of image spots, so that the optimal threshold of change detection can be
automatically determined. The experimental results show that the method is based on the spectral information of image spots, and fully and effectively mine and fuse the advantages of image multi-feature detection, reduce the false detection rate and miss detection rate, and improve the accuracy of change detection. The algorithm takes both the color feature and the edge linear feature into account and can extract the most kinds of change information. However, it is easy to misdetect for regions with large changes in vegetation coverage, which will be the main work of the next step.
ACKNOWLEDGEMENTS The authors would like to express my gratitude to all those who helped me during the writing of this thesis. My deepest gratitude goes foremost to Jianlei Li, for his useful suggestions on my thesis. This research is fund by the National Key Research and Development Program of China(NO.2016YFB0501403). REFERENCES Bovolo, F.,Bruzzone, L. and Marconcini, M.,2008. A Approach for Unsupervised Change Detection Based Semisupervised SVM and a Similarity Measure. Transactions on Geoscience & Remote Sensing. pp.2070-2082.
Novel on A IEEE 46(7),
Chen Y., et al.,2006. Remote Sensing Image Classification Research Based on Object Oriented and Rules. Journal of Wuhan University: Information Science Edition, 31(4), pp.316320. Dou J., Wen J. and Liu C., 2005. Image Retrieval Technology Based on Color Histogram. Infrared and Laser Engineering, 34(1), pp.84-88. Gioi, R.G.V., et al., 2012.LSD:A line segment detector. Image Processing on Line, 2(4):pp.35-55. Gong, J.Y. et al., 2008.Object-level change Detection method based on full-scale Image Segmentation and its Application in Wenchuan earthquake.Science in China. 51(S2), pp.110-122. Li L., et al.,2014. A method of Remote Sensing Image Change Detection Based on Multi-feature Fusion. Journal of Surveying and Mapping, 43(9),pp.945-953. Li S., Li Y. and An Y., 2010. Automatic Identification of Landslides Based on Change Detection. Remote Sensing Information, 35(1),pp.27-31.
Wei, L. et al.,2010. Adaptive Change Detection of Remote Sensing Image Fusion. Journal of Remote Sensing,14 (6),pp.1196-1211. Wei L. and Wang H., 2013. High Resolution Remote Sensing Image Change Detection Based on MSE Model. Spectroscopy and Spectral Analysis, 33(3),pp.728-732. Wu Z., 2013. Remote Sensing Image Segmentation Method Based on Spectral, Texture and Shape Information. Journal of Surveying and Mapping, 42(1),pp.44-50.
This contribution has been peer-reviewed. https://doi.org/10.5194/isprs-archives-XLII-3-1689-2018 | © Authors 2018. CC BY 4.0 License.
1693
The International Archives of the Photogrammetry, Remote Sensing and Spatial Information Sciences, Volume XLII-3, 2018 ISPRS TC III Mid-term Symposium “Developments, Technologies and Applications in Remote Sensing”, 7–10 May, Beijing, China
Wu Z., 2013. Remote Sensing Image Segmentation Method Based on Spectral, Texture and Shape Information. Journal of Surveying and Mapping, 42(1), PP.44-50. Wang A., Wang S., Lucieer A.,2010. Segmentation of Multispectral High-resolution Satellite Imagery Based on Integrated Feature Distributions. International Journal of Remote Sensing, 31(6), pp.1427-1439. Zhang G., Li Y., Li Z., 2010. A New Object-based Change Detection Method. Science China Technology Sciences, 53(S1), pp.105-110. Zhong J. and Wang R., 2005. Multi-temporal Remote Sensing Image Change Detection Based on Adaptive Parameter Estimation. Journal of Surveying and Mapping. 34(4),pp. 331336. Zhuang H., Deng K. and Fan H., 2016. Texture Feature Vector and Maximum Entropy Method for Unsupervised Change Detection of SAR Image. Journal of Surveying and Mapping. 45(3),pp.339-346.
This contribution has been peer-reviewed. https://doi.org/10.5194/isprs-archives-XLII-3-1689-2018 | © Authors 2018. CC BY 4.0 License.
1694