2017 SECOND IEEE INTERNATIONAL CONFERENCE ON E LECTRICAL , COMPUTER AND COMMUNICATION T ECHNOLOGIES
Change Detection using Image Differencing: A Study Over Area Surrounding Kumta, India Karthik Department of ECE NMAM Institute of Technology Nitte, India
[email protected] Abstract—Major resources for spatial change detection are remotely sensed data. In this paper, we discuss the change detection using image differencing technique over Kumta region, Karnataka, India. Accurate change detection results are very important to know the relationship between human interactions with environment in order to have a better understanding and decision making. An attempt has been made to recognize the changes in Land-Use/Land-Cover (LU/LC) over a period of four years from 2012 to 2016. Support Vector Machine (SVM) algorithm is used to classify the study area. A considerable amount of classification accuracy has been attained to have a very decent image differencing results. No major misclassifications were observed between the classes and change detection statistics are presented in terms of percentage of change and are also analyzed with respect to annual rainfall over the considered area. Keywords—remote sensing, change detection, image differencing, classification, SVM
I.INTRODUCTION The field of remote sensing has been generating great interest in analysts who are trying to collect/extract information in global scale such as area of a particular land-use/land-cover. It uses powerful sensors placed at a large distance from the object of interest and captures the characteristics of the object with high clarity. Current technology involves sensors placed on geostationary satellites or high-altitude airplanes for capturing information by recording reflection of an object. More research has been concentrated on satellite imagery containing multispectral information. Accurate change detection results are very important to know the relationship between human interactions with environment in order to have a better understanding and decision making. Many techniques have been developed and used for change detection. Every kind has its own merits, de-merits and applications. Simple image difference change detection technique has been used in order to study the changes over past four years on LU/LC of earth surface[1].
852
Shivakumar B R Department of ECE NMAM Institute of Technology Nitte, India
[email protected] The most commonly used change detection technique includes post-classification comparison, image differencing, change vector analysis and principal component analysis[2][3][4]. With the availability of high resolution spatial and temporal data, the research over remote sensing has spread from extracting information about an object to analyzing a particular phenomenon such as natural hazards and disasters like floods and landslides. This paper intends to study the change detection in LU/LC over area surrounding North Canara district, Karnataka, India. Change detection enables us to understand the flora and fauna of the surface as well as the changes in the surface over a period of consideration. In this study, we discuss the image differencing change detection technique applied over the study area between the periods 2012 to 2016. The major objective of the study was to find the percentage of change in LU/LC classes over the considered area over the last 4 years. The study areas were classified using Support Vector Machine classifier. Support Vector Machine was observed to produce accurate results even under few training samples [5][6]. Both the classified maps were then processed using image differencing technique, which produces the difference image. The difference image is then analyzed and reasoned along with the required data to produce the change statistics.
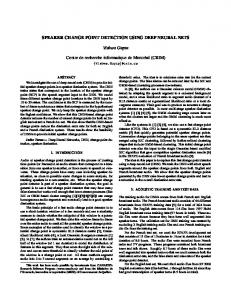
II.STUDY AREA The study area considered is located between the points 14032`26.54``N 74017`11.28`` E: 14039`3.28`` N 74050`13.33`` E, 13046`23.79`` N 74036`13.84``E: 13053`21.76`` N 7508`57.85`` E as shown in Figure 1. Geographically, study area is found in the south-western part of Indian subcontinent. The spatial tile covers the locations around Kumta Taluk, North Canara District, Karnataka, India. It is a part of coastal agro-climatic region which majorly covers natural vegetation including evergreen forest. It also covers part of Western Ghats with continuous undulated terrain.
978-1-5090-3239-6/17/$31.00 © 2017 IEEE
2017 SECOND IEEE INTERNATIONAL CONFERENCE ON E LECTRICAL , COMPUTER AND COMMUNICATION T ECHNOLOGIES
III.DATA AND METHODS LISS III Linear Imaging and Self Scanning III (LISS III) image was accessed from Indian Remote Sensing (IRS) p6 platform. It consists of 4 spectral bands: Green (0.52-0.59 µm), Red (0.62-0.68 µm), Near Infrared (NIR) (0.77-0.86 µm), and Short Wave Infrared (SWIR) (1.55-1.70 µm) with a spatial resolution of 23.5m. Studying vegetation in red and NIR is essential in vegetation studies as they separate pure vegetation from the bare soil and water bodies. The study area taken from LISS-III is shown in Fig. 1.
indicates during 2014 the Coastal region were recorded rainfall of 14% more than the normal and for the year 2015 it is 22% more than normal. In 2012 and 2013 it is recorded below normal[7]. The Fig. 3 and TABLE I shows rainfall statistics for Pre-Monsoon from 2012 to 2015.
Fig. 2.
Fig. 1.
2012 LISS-III study area.
LANDSAT 8 The LANDSAT 8 spacecraft built by Orbital Science Corporation, under contract to NASA (National Aeronautics and Space Administration) and uses orbital standard LEOStar-3 satellite bus. The image captured by LANDSAT 8 consists of 11 spectral bands: Coastal/Aerosol (0.433-0.453µm), Blue (0.45-0.515µm), Green (0.525-0.600µm), Red (0.630-0.680µm), Near Infrared (0.845-0.885µm), Short Wavelength Infrared-1 (1.560-1.660µm), Short Wavelength Infrared-2 (2.1002.300µm), Panchromatic (0.500-0.680µm), Cirrus (1.3601.390µm), Long Wavelength Infrared-1 (10.30-11.30µm) and Long Wavelength Infrared-2 (11.50-12.50µm).The study area taken from LANDSAT-8 is shown in Fig. 2. Rainfall Statistics over Study Area Pre-Monsoon majorly covers five months starting from January to May out of which January and February pertain to winter season and other three months pertain to summer period. The normal rainfall for Pre-Monsoon is 129mm which constitutes only 11% of annual rainfall. The Fig. 3
2016 LANDSAT-8 study area.
Support Vector Machine (SVM) Classifier Support Vector Machine was developed by V. Vapnik and co-workers in the framework of statistical learning theory[8]. It was initially a binary (two-class) algorithm. Vapnik showed that it can be extended to solving an n class problem by finding n hyperplanes between the classes. This requires the solution on n Quadratic Programming (QP) optimization problems. This strategy is also known as one-against-the-rest. SVM uses kernel tricks as a function to identify hyper-planes. Basically kernel tricks takes low dimensional input space and transform it to high dimensional space and thereby converting nonseparable problems into a separable one.
Percentage departure of cummulative rainfall from normal for the period from 1st January to 31st May for Coastal Region .
Fig. 3.
853
2017 SECOND IEEE INTERNATIONAL CONFERENCE ON E LECTRICAL , COMPUTER AND COMMUNICATION T ECHNOLOGIES
TABLE I.
PERCENTAGE DEPARTURE OF CUMMULATIVE RAINFALL. Year % Departure from average 2012 -53 2013 -18 2014 14 2015 22
The remotely sensed data is complex and there are possibilities that LU/LC classes may overlap with each other. Support Vector Machine is well suited for heterogeneous data where getting pure training pixels are challenging task. Several experimental studies proved that Support Vector Machine produces better classification results for the provided data sets. Change Detection The change detection techniques have been used in remote sensing to identify the changes in geographical location, recognizing, classifying and quantifying the type of changes and finally assessing the accuracy through change detection statistics. Change information obtained here is simple binary differencing i.e. change vs. no change[9]. A total of 5 well separable land-use/land-cover classes were identified on both considered data sets. Support Vector Machine multispectral classifier results in classifying Water Body, Evergreen Forest, Deciduous Forest, Agricultural Fields and Scrub Land more effectively. For resulted classified sets, change of information obtained by simple binary differencing using change detection technique as shown in Fig. 6. Then change detection statistics are generated for the difference map. Image Differencing Image differencing is a method of subtracting the DN (Digital Number) value of one data with the other one of the same pixel for the same band which results in new image. Mathematically, image differencing can be represented as follows (1) Where I1 and I2 represents images taken from two different time periods and (x,y) are coordinates and represents difference image[10]. I1 image was obtained from LISS III from March, 2012 and image I2 is obtained from LANDSAT 8 from March, 2016. Both data are taken from same month in order to have a better change detection results under same climatic condition. A set of threshold values based on standard deviation from mean value are used to determine difference in pixels[11]. Pixels with change in radiance are distributed in the tails of the distribution curve [2] whereas pixels with no change 854
are distributed around the mean [1]. As changes can happen on both directions, the analyst has to decide the order of the image to be subtracted [10]. In change detection statistics table, initial state of classes is represented in columns and final state of classes are represented in rows. Statistics shows how initial state pixels were classified in the final state image percentagewise. Class Total in row indicates the total percentage of pixels in each initial state class, and Class Total in column indicates the total percentage of pixels in each final state class. The Row Total column is a percentage-wise summation of all the class’s final state pixels that fell into the selected initial state classes. This may not be the same as the Final State Class Totals because it is not required that all initial state classes are included in the analysis. The Class Changes row represents the total percentage of initial state pixels that changed classes. The Image Difference row is the difference in the total number of equivalently classed pixels in the two images, computed by subtracting the Initial State Class Totals from the Final State Class Totals. An Image Difference that is positive indicates that the class size increased, if it is negative indicates that the class size decreased. (2)
IV.RESULTS AND DISCUSSION Classification Results for 2012 LISS III Imagery. A total of 5 well separable LU/LC classes were identified on considered two data sets. To validate the classification results, spatial accuracy assessment was carried out for resultant classified images. In order to measure the agreement between the reference and classified information Kappa coefficients were calculated. Support Vector Machine classifier effectively classified LISS-III data with overall classification accuracy of 82.40% and Kappa coefficient 0.7167 as shown in Fig. 4 and TABLE II indicates the classification results. Evergreen Forest (PA= 72.73%, UA = 100%) and Water Body (PA= 100%, UA = 100%) classes were effectively classified with Kappa values of 1 each. Agricultural Land (PA= 100%, UA = 71.43%) and Scrub Land (PA= 100%, UA = 71.43%) classes were also extracted successfully with Kappa values of 0.7085 each. Deciduous Forest (PA= 96.55%, UA = 58.33%) class was extracted with mediocre Kappa value of 0.4575.
2017 SECOND IEEE INTERNATIONAL CONFERENCE ON E LECTRICAL , COMPUTER AND COMMUNICATION T ECHNOLOGIES
TABLE II.
CLASSIFICATION RESULTS FOR 2012 LISS-III IMAGERY. a
Class
RT 28
b
CT 28
c
NC 28
d
PA
Water Body 100% Evergreen 154 112 112 72.73% Forest Deciduous 58 96 56 96.55% Forest Agricultural 5 7 5 100% Fields Scrub Land 5 7 5 100% Totals 250 250 206 Overall Classification Accuracy Overall Kappa Statistics
e
UA
f
Class
Khat
100%
1.0000
100%
1.0000
58.33%
0.4575
71.43%
0.7085
71.43%
0.7085
CLASSIFICATION RESULTS FOR 2016 LANDSAT-8 IMAGERY.
TABLE III. a
b
c
RT 25
CT 24
NC 24
d
PA
Water Body 96% Evergreen 152 124 124 81.58% Forest Deciduous 53 83 51 96.23% Forest Agricultural 7 11 7 100% Fields Scrub Land 13 8 7 53.85% Totals 250 250 213 Overall Classification Accuracy Overall Kappa Statistics
82.40% 0.7167
e
UA
f
Khat
100%
1.0000
100%
1.0000
61.45%
0.5107
63.64%
0.6259
87.50%
0.8681
85.20% 0.7596
a
RT- Reference Totals, b CT-Classified Totals, c NCNumber Correct, d PA- Producer’s Accuracy, e UA-User’s Accuracy,f Khat –Kappa Value
a
Classification Results for 2016 LANDSAT-8 Imagery. LANDSAT-8 data was classified with overall classification accuracy of 85.20% and Kappa coefficient 0.7596 as shown in Fig. 5 and TABLE III indicates its accuracy values. Once again, Water Body and Evergreen Forest classes were extracted with Kappa value of 1 each. For 2016 LANDSAT-8 Data Water body and Evergreen Forest was accurately classified with Khat value 1.
Image Differencing Results Fig. 6 shows the Change Detection Difference Map. Evergreen
RT- Reference Totals, b CT-Classified Totals, c NCNumber Correct, d PA- Producer’s Accuracy, e UA-User’s Accuracy, f Khat –Kappa Value
Fig. 5.
Fig. 4.
Classified Image of 2012 LISS-III Imagery.
Deciduous Forest (Khat =0.5107), Agricultural Fields (Khat =0.6259) and Scrub Land (Khat =0.8681) were classified with considerable amount of accuracy. Scrub land class was extracted with a very decent Kappa value of 0.8681. Agricultural Fields and Deciduous Forest classes were not well extracted and showed mediocre Kappa values of 0.6259 and 0.5107 respectively.
Classified Image of 2016 LANDSAT-8 Imagey.
Forest has seen an increase in its cover by about 4.475% during the study period. Major contributor for increase in Evergreen Forest cover is Deciduous Forest. 2.436% of the Evergreen Forest in 2016 was because of loss in Deciduous Forest cover. Deciduous Forest cover has seen a decrease of 13.644%. According to results, 19.799% of the Deciduous Forest was seen to be converted to Evergreen Forest. This could be because of the excess rainfall during the study period.
855
2017 SECOND IEEE INTERNATIONAL CONFERENCE ON E LECTRICAL , COMPUTER AND COMMUNICATION T ECHNOLOGIES
Around 83% of the Water Body cover was retained during the study period and minor parts of the Water Body class were converted into Deciduous Forest and Scrub Lands. Agricultural Fields class saw a major increase in its cover by a whole 49.376%. 7.842% of the Scrub Land was observed to be converted to Agricultural Fields. Scrub Land also saw an increase of about 16275%. The new land cover gained around 37% and 24% from Deciduous Forest and Agricultural Fields.
V.CONCLUSION The results indicate an increase in the area of Evergreen Forest by 4.475% of its original coverage. This could be due to good rainfall between the period of study. Agricultural Fields has seen 49% increase from its original value. This could be due to increasing population and demand for food supplies. Fig. 6.
Change Difference map of the study area. TABLE IV. CHANGE DETECTION STATISTICS
Initial State Final State Water Body Evergreen Forest Deciduous Forest Agricultural Fields Scrub Land Class Total Class Changes Image Difference
Water Body (in %)
Evergreen Forest (in %)
Deciduous Forest (in %)
83.322 1.207 6.349 2.752 6.371 100.00 16.678 -14.921
0.018 97.512 2.436 0.018 0.016 100.00 2.488 4.475
0.334 19.799 74.636 2.093 3.138 100.00 25.364 -13.644
This is indeed a good development to the country, as the growth in agricultural land cover makes the country stable with respect to food supplies. The increase in Agricultural Fields was because of conversion of Scrub Land and Evergreen Forest into Agricultural Fields. Contrary to increase in agricultural fields, Water Body and Deciduous Forest cover has decreased by 14.921% and 13.644% respectively. It is surprising to see decrease in Water Body cover as the rainfall has been more than good over the period of study. No forest encroachment has been observed over the study area. Scrub Land also has seen 16.275% increase in its cover. Most of it is from Deciduous Forest cover as seen by the statistics. More detailed results can be obtained by continuing the study for next few years and record the results over same/different types/resolution of remotely sensed data.
[3].
REFERENCES
[9].
[1].
[2].
856
D. Lu, P. Mausel, E. BrondÃ-zio, and E. Moran, ―Change detection techniques,‖ Int. J. Remote Sens., vol. 25, pp. 2365–2401, 2009. A. Singh, ―Digital change detection techniques using remotely-sensed data,‖ Int. J. Remote Sens., vol. 10, no. 6, pp. 989–1003, 1989.
[4]. [5].
[6].
[7].
[8].
[10].
Agricultural Fields (in %) 0.928 0.002 1.691 89.536 7.842 100.00 10.464 49.376
Scrub Land (in %)
Row Total
Class Total
0.742 0.914 37.690 24.107 36.547 100.00 63.453 16.275
100.000 100.000 100.000 100.000 100.000
100.000 100.000 100.000 100.000 100.000
E. F. Lambin and A. H. Strahlers, ―Change-vector analysis in multitemporal space: A tool to detect and categorize land-cover change processes using high temporal-resolution satellite data,‖ Remote Sens. Environ., vol. 48, no. 2, pp. 231–244, 1994. F. Abadi, ―An assessment,‖ J. Athl. Train., vol. 91, no. 1, pp. 7–14, 2010. M. Pal and P. M. Mather, ―Support vector machines for classification in remote sensing,‖ Int. J. Remote Sens., vol. 26, no. 5, pp. 1007–1011, 2005. F. Roli and G. Fumera, ―Support vector machines for remote sensing image classification,‖ Eur. Remote Sens., 2001. V. N. Vapnik, The Nature of Statistical Learning Theory, 1st Editio. Springer Science+Business Media, LLC, 2000. J. Im, J. Rhee, J. R. Jensen, and M. E. Hodgson, ―An automated binary change detection model using a calibration approach,‖ Remote Sens. Environ., vol. 106, no. 1, pp. 89–105, 2007. J. Gao, Digital Analysis of Remotely Sensed Imagery, 2009th ed. 2009. H. Sciences, ―Detection of land cover changes in El Rawashda forest , Sudan : A systematic comparison Detection of land cover changes in El Rawashda forest , Sudan : A systematic comparison", March, 2012.