Available online http://ccforum.com/content/10/1/R10
Research Vol 10 No 1
Open Access
Changes in appetite related gut hormones in intensive care unit patients: a pilot cohort study Mohsen Nematy1, Jacqui E O'Flynn2, Liesl Wandrag2, Audrey E Brynes3, Stephen J Brett4, Michael Patterson5, Mohammad A Ghatei6, Stephen R Bloom7 and Gary S Frost8 1Phd
Student, Nutrition and Dietetic Research Group, Imperial College, Hammersmith Hospitals NHS Trust, Du Cane Road, London W12 0HS, UK Dietician, Nutrition and Dietetic Research Group, Imperial College, Hammersmith Hospitals NHS Trust, Du Cane Road, London W12 0HS,
2Senior
UK 3Chief
Research Dietician, Honorary Lecturer Imperial College, Nutrition and Dietetic Research Group, Imperial College, Hammersmith Hospitals NHS Trust, Du Cane Road, London W12 0HS, UK 4ICU Consultant, Division of Surgery, Anaesthetics and Intensive Care, Imperial College, Hammersmith Hospitals NHS Trust, Du Cane Road, London W12 0HS, UK 5Graduate student, Department of Metabolic Medicine, Imperial College, Hammersmith Hospitals NHS Trust, London W12 0NN, UK 6Professor of Metabolic Medicine, Department of Metabolic Medicine, Imperial College, Hammersmith Hospitals NHS Trust, London W12 0NN, UK 7Professor of Nutrition, Department of Metabolic Medicine, Imperial College, Hammersmith Hospitals NHS Trust, London W12 0NN, UK 8Professor of Nutrition, Nutrition and Dietetic Research Group, Imperial College, Hammersmith Hospitals NHS Trust, Du Cane Road, London W12 0HS, UK Corresponding author: Gary S Frost,
[email protected] Received: 24 Aug 2005 Accepted: 28 Nov 2005 Published: 23 Dec 2005 Critical Care 2006, 10:R10 (doi:10.1186/cc3957) This article is online at: http://ccforum.com/content/10/1/R10 © 2005 Nematy et al., licensee BioMed Central Ltd. This is an open access article distributed under the terms of the Creative Commons Attribution License (http://creativecommons.org/licenses/by/2.0), which permits unrestricted use, distribution, and reproduction in any medium, provided the original work is properly cited.
Abstract Introduction The nutritional status of patients in the intensive care unit (ICU) appears to decline not only during their stay in the ICU but also after discharge from the ICU. Recent evidence suggests that gut released peptides, such as ghrelin and peptide YY (PYY) regulate the initiation and termination of meals and could play a role in the altered eating behaviour of sick patients. The aim of this study was to assess the patterns of ghrelin and PYY levels during the stay of ICU patients in hospital. Methods Sixteen ICU patients (60 ± 4.7 years, body mass index (BMI) 28.1 ± 1.7 kg/m2 (mean ± standard error of the mean)) underwent fasting blood sample collections on days 1, 3, 5, 14, 21 and 28 of their stay at Hammersmith and Charing Cross Hospitals. Changes in appetite and biochemical and anthropometric markers of nutritional status were recorded. A comparison was made to a group of 36 healthy volunteers
Introduction Impaired appetite is a common feature of illness. A recent review suggested that 10% to 40% of adult patients admitted to hospital exhibit some level of nutritional depletion [1], with much weight loss, occurring over the period of hospitalisation
matched for age and BMI (54.3 ± 2.9 years, p = 0.3; BMI 25.8 ± 0.8 kg/m2 p = 0.2). Results Compared to healthy subjects, ICU patients exhibited a significantly lower level of ghrelin (day one 297.8 ± 76.3 versus 827.2 ± 78.7 pmol/l, p < 0.001) during their stay in the ICU. This tended to rise to the normal level during the last three weeks of hospital stay. Conversely, ICU patients showed a significantly higher level of PYY (day one 31.5 ± 9.6 versus 11.3 ± 1.0 pmol/l, p < 0.05) throughout their stay in the ICU and on the ward, with a downward trend to the normal level during the last three weeks of stay. Conclusions Results from our study show high levels of PYY and low levels of ghrelin in ICU patients compared to healthy controls. There appears to be a relationship between the level of these gut hormones and nutritional intake.
[2]. This is a matter of particular concern for certain categories of patients. Patients in intensive care units (ICUs) are a vulnerable group. One report suggested 55 out of 129 patients admitted to ICUs were already suffering from malnutrition [3]. Their nutritional status further declines during the intensive
APACHE = Acute physiology and Chronic Health Evaluation; BMI = body mass index; CRP = C-reactive protein; ICU = intensive therapy unit/intensive care unit; MAC = muscle arm circumference; PYY/PYY3–36 = peptide YY or peptide tyrosine tyrosine; SEM = standard error of mean; VAS = visual analogue scale. Page 1 of 9 (page number not for citation purposes)
Critical Care
Vol 10 No 1
Nematy et al.
care and also after their ICU stay [3]. This study noted that despite 20 years of intense awareness, malnutrition was still highly prevalent in hospitalised patients and this continues to affect patients' outcomes. At present, nutritional supplements are used in most hospitals, but their effectiveness varies [4], probably due to the influence of poor appetite. The mechanism of poor nutritional intake in ICU patients remains unclear, but gastric myoneural inhibition and gastrointestinal hypomotility with delayed gastric emptying may be contributing factors. Peptide hormones released from the gut, such as ghrelin and peptide YY (PYY), which stimulate and inhibit the appetite, respectively [5,6], might play a role in the altered eating behaviour of sick patients because the anorexia in sick hospitalised patients is often characterised by a premature feeling of fullness and loss of hunger. Ghrelin, a 28 amino acid peptide, is produced by the stomach and its level is highest in the fasting state, rising sharply before, and falling within one hour of, a meal [7]. Wren and colleagues [8] demonstrated that intravenous ghrelin infusion stimulates appetite and food intake potently in human and recent research showed that circulating ghrelin levels decreased in normal weight subjects after a meal [9]. Ghrelin, a newly discovered gut peptide is potentially an important new peripheral signal to the brain to stimulate food intake in human [8]. The levels of ghrelin and PYY in sick hospitalised patients are unknown. Peptide YY is a naturally occurring peptide that is released into the circulation by intestinal L-cells following food ingestion. PYY3–36 is the major form of metabolically active PYY in both the gut mucosal endocrine cells and the circulation. In human volunteers, exogenous infusion of PYY 3–36 reduces food intake by 30% compared to placebo [10]. Recent work on patients with cardiac cachexia caused by severe pulmonary hypertension showed an exaggerated and early PYY response to a test meal when compared to control subjects [11]. Research so far has demonstrated that PYY physiologically inhibits appetite in human and suggests it is likely to be important in the everyday regulation of food intake. The aim of this study was to investigate the concentration of ghrelin and PYY in patients during their stay in the ICU and, secondarily, the relationship between these levels and measures of appetite and food intake.
Materials and methods Study subjects This was a prospective study undertaken at Hammersmith and Charing Cross Hospitals, London. Local ethics committee approval was obtained for the enrolment of both patients and control subjects. Conscious patients with adequate mental capacity gave written informed consent prior to enrolment; for others, a close relative/partner gave written assent, with deferred patient consent being obtained during recovery.
Page 2 of 9 (page number not for citation purposes)
Patient refusal at this point resulted in complete withdrawal from the study. The inclusion criteria were: male and female patients between the ages of 18 and 85 years who were anticipated to stay in the ICU for longer than three days in the opinion of the consultant. Exclusion criteria were: patients who were anticipated to die, or stay less than three days in the ICU; those who were known to be HIV or hepatitis B surface antigen positive; and patients who were already enrolled in a therapeutic study. The study was performed in accordance with the Declaration of Helsinki. ICU patients Nutritional and medical data were collected from patients, charts, medical notes, dieticians and medical teams. Patients were followed clinically until discharge from hospital or death.
Visual analogue scale As patients recovered from critical illness in intensive care they were asked to complete a visual analogue scale (VAS) for appetite [12]. This was repeated on the days that blood samples were collected throughout their stay. VAS questionnaires were not obtained during intensive care stay as patients were mainly fed nasogastrically or received parenteral nutrition, and were not alert enough to reply to questions. Some patients were never well enough to complete the VAS assessment. Food intake Food intake was estimated from food record charts completed at ward level. Nurses were given instruction on how to complete the intake charts. The nutritional content of the patients' food record charts and healthy subjects' three-day diet diary were calculated using computerised food tables in Dietplan5 (Forrest Hill Software Ltd, Sussex, UK). Anthropometric measurements Anthropometric indices, including triceps skinfold thickness, muscle arm circumference (MAC) and weight were assessed at the nearest point to ICU discharge [13,14]. The admission weight was recorded from the notes if it was known, otherwise it was recorded at the nearest point to ICU discharge. The demi-span was measured to calculate the height in order to compute body mass index (BMI) [15]. Blood sampling Fasting blood samples were taken on days 1, 3, 5, 14, 21 and 28 of stay or date of discharge home. In the ICU, fasting blood samples were taken at 6 a.m. In the ward, fasting blood samples were taken between 7 and 8 a.m. before starting breakfast. Blood samples were centrifuged at 4°C; plasma was then separated, frozen immediately and stored at -20°C until analysis. Patients were followed after transfer to other wards, until day 28 or discharge home if earlier.
Available online http://ccforum.com/content/10/1/R10
Results from albumin, total protein, C-reactive protein (CRP), and haemoglobin concentrations were extracted from the patient records.
Acute Physiology and Chronic Health Evaluation II Acute Physiology and Chronic Health Evaluation (APACHE) II and risk of death scores were calculated to stratify illness severity on admission [16] and to anticipate prognosis. Control volunteers Healthy control volunteers were recruited by advertisement at Hammersmith Hospital.
Results Sixteen ICU patients consented to enrolment and were followed until discharge. The study enrolment profile is shown in Figure 1. Four patients who required renal replacement therapy were excluded from the gut hormone final analysis. Four patients died during the study period and two patients had less than four blood samples (Table 1). Therefore, the sample size was reduced to eight eligible patients for ghrelin and PYY analysis (Table 1). There was one assay failure for PYY so this reduced the sample size from eight to seven patients for PYY. We matched patients and controls for PYY and the number of controls was reduced accordingly.
The inclusion criteria were; volunteers between the ages of 18 and 85 years. Exclusion criteria were: those subjects with a history of significant chronic diseases or muscle wasting diseases; smoking; substance abuse; pregnancy; medical or psychiatric illness; and those who were known to be HIV or hepatitis B surface antigen positive. An appetite questionnaire (visual analogue scale) was completed for control subjects; this was repeated on the days that blood samples were taken and weight was recorded. Control subjects also completed a three-day diet diary to determine their food intake. A tape and callipers were used on their arm to measure MAC and triceps skinfold thickness. Their height and weight were measured in order to calculate their BMI. Subjects were asked to fast from 10 p.m. on the night before each visit and to have only water to drink from midnight. One 10 ml fasting blood sample between 7.30 and 9.30 a.m. on days 1, 3 and 5 were taken from each volunteer.
Demographics of patients and control volunteers The comparative mean age and BMI of the patients and control groups are reported in Table 2. There were 36 healthy volunteers aged 54.3 ± 2.9 years (range 29 to 83 years) with a BMI of 25.8 ± 0.8 kg/m2 (range19.8 to 40 kg/m2) recruited at Hammersmith Hospital (Table 2). Table 1 provides data on methods of feeding, APACHE II and risk of death scores, length of stay in the ICU and total hospital stay, diagnosis and reason of admission of patients to the ICU. Length of stay in the ICU was 12.9 ± 2.2 days (range 2 to 30 days) and total hospital stay was 40.3 ± 6.6 days (range 9 to 84 days). The results of the ghrelin and PYY assays from control subjects (little day to day variation) were grouped together as a pseudo normal range of mean ± SEM, with each subject contributing three data points.
Gut peptides assays Plasma PYY and ghrelin were measured using 'established inhouse radioimmunoassays' as described previously [17,18].
Figure 1
Column chromatography To confirm ghrelin and PYY like immunoreactivity represented endogenous ghrelin or PYY and not non-specific interference, plasma samples were fractioned by Sephadex G-50 gel permeation chromatography [17,18]. The eluted fractions were assayed for ghrelin and PYY immunoreactivity. Statistical analysis A power calculation based on PYY and ghrelin concentration from an interim analysis suggested a sample size of seven patients matched to seven controls (at a power of 95%) would be enough to show significant changes between patients and control subjects (P < 0.05). The data were analysed using SPSS 12.0 for windows (SPSS Science, Apache Software Foundation, Chicago, IL, USA). All data were checked for normality and presented as mean ± standard error of the mean (SEM). An independent two-tailed t test was performed to compare the PYY and ghrelin patterns between patients and control groups. Correlation analysis was performed using Pearson correlation coefficient.
Flow of intensive care patients through the study. study d, day; ITU, intensive therapy unit.
Page 3 of 9 (page number not for citation purposes)
Critical Care
Vol 10 No 1
Nematy et al.
Table 1 Diagnosis of ICU patients No.
Age (years)
1a
68
2b
Feeding method
Target energy in ICU
APACHE II
ROD
LOS (ICU)
LOS (total)
Diagnosis
Reason for admission to ICU
Enteral-NG
1,800
27
0.302
12
48
MVR, hypotensive perioperatively
Haemodynamic, respiratory and renal instability
57
Enteral-NG
1,800
14
0.106
14
42
Cardiac tamponad following heart surgery
Haemodynamic and respiratory disruption
3b
72
Oral
2,000
23
0.489
4
45
Chest pain and collapse
Haemodynamic and respiratory disruption
4b
75
Enteral-NG
1,800
25
0.561
4
26
Biliary sepsis
Haemodynamic instability
5a
77
Oral
1,700
23
0.46
9
17
COPD and pneumonia
Haemodynamic instability
6b
35
TPN
2,000
16
0.256
16
60
Acute pancreatitis
Haemodynamic and respiratory instability
7c
18
Enteral-NG
1,900
16
0.256
8
10
Congenital abnormality in lung vessels
Haemodynamic and respiratory disruption
8b,c
82
Enteral-NG
1,800
20
0.517
25
47
Sigmoid vulvulous, large bowl resection
Haemodynamic and respiratory disruption
9b
73
TPN
1,700
15
0.126
14
25
Post relaparatomy following pancreatecto my
Haemodynamic and respiratory disruption
10
66
Oral
1,800
13
0.227
6
9
Angioplastypost insertion of stent
Haemodynamic instability
11a,c
64
Enteral-NG
1,800
12
0.07
30
81
Post-emergency laparotomy
Renal instability
12a
64
Enteral-NG
1,900
22
0.45
10
84
Post-emergency laparotomy
Haemodynamic and respiratory disruption
13b
43
Enteral-NG
2,000
13
0.143
30
76
Global cerebral damage following hypoglycaemia
Hypoglycaemic coma
14c
43
Enteral-NG
2,265
12
0.239
13
20
Craniotomy for intracerebral bleeding
Mental deterioration due to haemorrhage in cerebellum
15b
80
Enteral-NG
1,800
35
0.823
10
45
Diabetic comaNIDDM
Diabetic come, collapsed at home
16
40
Oral
1,900
17
0.649
2
10
Sepsis (leukaemia)
General deterioration and confusion
aPatients
with renal failure who were dialysis dependent. bPatients were considered for ghrelin and peptide YY statistics. cPatients died during stay in hospital. APACHE, Acute Physiology and Chronic Health Evaluation; COPD, chronic obstructive pulmonary disease; ICU, intensive care unit; LOS, length of stay; MVR, mitral valve prolapse; NIDDM, non-insulin-dependent diabetes mellitus; NG, nasogastric; ROD, risk of death; TPN, total parenteral nutrition.
Page 4 of 9 (page number not for citation purposes)
Available online http://ccforum.com/content/10/1/R10
Table 2
Figure 2
Demographic details of intensive care unit patients and control subjects ICU patients
Control subjects
Subjects (n)
16
36
Age (years)
60 ± 5
54 ± 3
NS
28.1 ± 1.7
25.8 ± 0.8
NS
BMI
(kg/m2)
Deceased
P value
4
BMI, body mass index; ICU, intensive care unit; NS, not significant.
Gut hormones
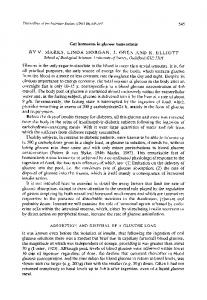
PYY Fasting PYY levels were significantly higher in the ICU patients compared to the control group, as can be seen in Figure 2. Over the period of admission, however, PYY levels significantly fell; at days 21 and 28 there was no significant difference between the ICU group and the healthy controls. There was no significant difference between the initial plasma level of PYY in patients and the one prior to discharge due to a large variation of the level on day one (SEM = 9.6; Table 3). However, there were significant differences between the plasma level of PYY on days three and five of admission and that prior to discharge (34 ± 5.9 and 40.7 ± 7.9 versus 22.3 ± 6.3, p < 0.05 and p = 0.02, respectively; Table 3). Renal failure is known to be associated with high levels of PYY, and it is currently unclear whether this represents the active PYY3–36 [19]. Of 16 patients, four had renal failure and significantly higher PYY levels than those patients that did not have renal failure (day 3 in ICU, 62.2 ± 5.2 versus 34.0 ± 5.9 pmol/l, p < 0.05). We defined renal failure here as dialysis dependency or chronic renal failure; these four patients received dialysis in ICU and were removed from subsequent analysis. A significant difference in PYY levels between patients and the control group is still clearly apparent, even with the removal of data for the four renal failure patients (Figure 2).
Ghrelin Figure 3 shows that fasting ghrelin levels were significantly lower in the ICU patients compared with the control group during the first three weeks of stay; however, this difference disappeared over the fourth week of stay. There was a significant difference between initial levels of ghrelin and that prior to discharge (Table 3). As mentioned above, the four patients who had renal failure were removed from the subsequent analysis. Among the ICU patients, there was no significant difference between men and women. There was no significant difference in PYY and ghrelin concentrations between actual feeding groups (oral, nasogastric and parenteral nutrition), although this was an underpowered observation (data not shown).
Patternintensive during healthy age of plasma and care body peptide unit mass (ICU) (PYY; index stay mean matched (n = ±7 standard control patients) error group compared of(nthe = 31) mean) with during intensive care unit (ICU) stay (n = 7 patients) compared with healthy age and body mass index matched control group (n = 31). Filled circles, ICU patients; solid line, control group; doted line, error bar in control group; * p < 0.05 for patients versus controls. There was no significant difference between patients and control subjects on day 21 and 28. +p < 0.05 for patient day 3 and 5 versus patient day 28.
C-reactive protein Figure 4 shows the degree of acute phase CRP response during ICU stay until day 28. On entering the ICU, patients had significantly higher CRP levels than the control group (99.6 ± 18.4 versus 2.7 ± 0.5 mg/l, p < 0.005; Figure 4). There was a statistically significant decrease in CRP levels from the time of enrolment to the time of discharge (99.6 ± 18.4 versus 25.8 ± 10.4 mg/l, p = 0.001; Figure 4), but there was still clear evidence of an acute phase response. Column chromatography Gel permeation chromatography demonstrated ghrelin and PYY immunoreactivity eluted at the same position as synthetic ghrelin or PYY (data not shown). Markers of appetite and nutritional status On entering the ICU, patients had significantly lower albumin (16.3 ± 1.4 versus 37.4 ± 1.0 g/l, p < 0.005), total protein (45.6 ± 2.6 versus 70.5 ± 1.0 g/l, p < 0.005), and haemoglobin (10.0 ± 1.1 g/dl versus 14.1 ± 0.2, p < 0.005) than the control group. Evaluating appetite using a VAS suggested that ICU survivors felt less sensation of hunger after discharge from the ICU (24.7 ± 7.4 versus 40.9 ± 4.8 mm, p = 0.04), higher nausea (27.3 ± 9.2 versus 5.9 ± 1.4 mm, p = 0.03), and higher satiety (43.3 ± 13.3 versus 16.5 ± 2.3 mm, p = 0.04) compared with control volunteers. Mean daily energy intake after discharge from the ICU was significantly lower in patients compared to the healthy control subjects (873.4 ± 215.7 versus 1687.9 ± 40.4 kcal, p = 0.007).
Page 5 of 9 (page number not for citation purposes)
Critical Care
Vol 10 No 1
Nematy et al.
Table 3 Initial and final plasma concentrations of ghrelin and peptide YY of intensive care unit patients Ghrelin (pmol/l)
PYY (pmol/l)
Day 1
Day 28 ± 3
Day 1
Day 28 ± 3
442.4
494.0
22.1
6.4
282.7
516.5
71.6
48.1
43.6
381.4
29.5
19.2
571.2
567.7
22.8
43.6
600.3
743.9
6.1
10.4
126.7
1,136.8a
b
b
212.7
378.8
61.2
11.4
103.1
232.5
7.0
16.3
297.8 ± 76.3
556.5 ± 98.6c
31.5 ± 9.6
22.2 ± 6.3d
aDischarged
home on day 21. bAssay failure. cP < 0.05. dP = 0.17. Values are mean ± standard error of the mean.
Markers of appetite and nutritional status changed during stay (from admission into the ICU until discharge) as follows: weight decreased (78.4 ± 0.7 versus 68.1 ± 5.2 kg, p = 0.03, n = 7), MAC decreased (28.8 ± 1.6 versus 26.7 ± .0.7 cm, not significant), and triceps skinfold thickness decreased (14.8 ± 4.1 versus 13.9 ± 4.6 mm, not significant). Using the VAS, patients' appetite increased significantly from the time of discharge from ICU to the last week of stay (24.7 ± 7.4 versus 48.3 ± 11.5 mm, p < 0.001). Mean daily energy intake on week 4 was significantly lower than estimated energy requirements (873.4 ± 215.7 versus 1687.0 ± 40.4 kcal, p = 0.007). Compared to at admission, patients had significantly higher albumin (23.3 ± 1.5 versus 16.3 ± 1.4 g/l, p < 0.005), total protein (61.5 ± 3.2 versus 45.6 ± 2.6 g/l, p < 0.005), and haemoglobin (11.2 ± 0.4 versus10.0 ± 1.1 g/dl, p < 0.05) on discharge. However, these levels on discharge still did not reach healthy control subjects' levels (albumin, 23.3 ± 1.5 versus 37.4 ± 1.0 g/l, p < 0.005; total protein, 61.5 ± 3.2 versus 70.5 ± 1.0 g/l, p < 0.005; and haemoglobin, 11.2 ± 0.4 versus 14.1 ± 0.2 g/dl, p < 0.005). Correlations APACHE II scores and day one PYY levels were positively correlated (r = 0.5, p = 0.05 (1-tailed)) and negatively correlated with day one ghrelin (r = -0.3, p > 0.05). Percentage increase in ghrelin during the stay was negatively correlated with percentage change in PYY (r = -0.4, p > 0.05). Decrease in CRP was positively correlated with decrease in PYY (r = 0.2, p > 0.05) and negatively with decrease in ghrelin (r = -0.35, p > 0.05). A positive association was observed between patients' food intake at week four and percentage increase in ghrelin (from week 1 to week 4; r = 0.9, p < 0.05 (1-tailed)) and there was a negative correlation between food intake and percentage decrease in PYY (r = -0.6, p > 0.05). There was a negative correlation between APACHE II score and appetite on day 14
Page 6 of 9 (page number not for citation purposes)
(r = -0.5, p = 0.1 (1-tailed)), day 21 (r = -0.7, p < 0.05 (1-tailed)) and day 28 (r = -0.8, p < 0.1 (1-tailed)).
Discussion Anthropometric data pointed to a deterioration in the nutritional status of patients during their stay in hospital, with a decline in body weight, MAC, and albumin and total protein levels. This is consistent with the finding of Giner and colleagues [3], who studied 129 patients admitted to the ICU and followed them until discharge. Nutrition assessment of our patients suggested that their nutritional status was poor prior to admission to the unit, declined further during their stay in the ICU, and malnutrition continued to be a persistent problem Figure 3
Pattern intensive age andofbody care plasma mass unit ghrelin (ICU) indexstay (mean matched (n = ± 8standard control patients) group error compared of (n the = 36) mean) with healthy during intensive care unit (ICU) stay (n = 8 patients) compared with healthy age and body mass index matched control group (n = 36). Filled circles, ICU patients; solid line, control group; doted line, error bar in control group; * p < 0.05. ** p < 0.001 patients versus controls. There was no significant difference between patients and control subjects on day 21 and 28. +p