International Journal of the Physical Sciences Vol. 7(5), pp. 822 - 826, 30 January, 2012 Available online at http://www.academicjournals.org/IJPS DOI: 10.5897/IJPS11.1484 ISSN 1992 - 1950 ©2012 Academic Journals
Full Length Research Paper
Changes in cosmic ray fluxes improve correlation to global warming A. Ollila Department of Civil and Environmental Engineering, School of Engineering, Aalto University, Espoo, Finland. E-mail:
[email protected]. Accepted 14 December, 2011
In this study, it was found out that ion chamber measurements of cosmic ray fluxes during the last solar cycle ending in 2009 differ essentially from neutron measurements. The ion chamber measurements utilizing geomagnetic aa index as proxy for the years between 1868 and 1936 produced excellent correlation to the global temperature changes for the period of 1868 to 2009. These results indicate that solar activity changes may cause climate changes. Key words: Cosmic rays, ion chamber measurements, climate change, solar cycle.
INTRODUCTION The researchers have published numerous studies indicating fairly good correlations between solar cycle activity changes and the global temperature changes over the last 150 years. These studies represent correlation between the global temperature changes and the sun cycle lengths starting with Friis-Christensen and Lassen (1991) or the geomagnetic activity aa index variations (Cliver et al., 1998; El-Borie and A-Thoyaib, 2006). Some researchers have studied sun activity changes in the millennium scale utilizing cosmogenic isotopes Be and C as proxies for sun spot numbers and cosmic ray fluxes (Usoskin et al., 2005) but the correlations are weaker. The correlation between the two phenomena does not itself present sufficient evidence that solar activity changes may cause climate changes. Additional evidence can be found in a study of a mechanism through which physical and/or chemical interactions affect the climate change. Svensmark (1997) and Svensmark and Friis-Christensen (1998) were the first researchers to introduce evidence about the phenomena on solar cycle variations modulate galactic cosmic ray fluxes in the earth’s atmosphere, which phenomenon could cause clouds to form. They argued that cosmic ray particles collide with particles in atmosphere inducing electrical charges on them and finally nucleate clouds. Kernthaler et al. (1999) and Jorgensen and Hansen (2000) have presented doubts about the existence of the pattern claiming that the evidence was too weak. These
doubts were consequently dispelled by Svensmark and Friis-Christensen (1999) but later Marsh and Svensmark (2000) found out that the correlation was good and valid for low level clouds (< 3 km) only. Palle et al. (2004) have confirmed these findings. MATERIALS AND METHODS This study is based on the analyses of data, which are related to the different parameter changes caused by solar cycles. These parameters include the following physical measurements: Global temperature, aa index, CO2 concentration, ion chamber measurement, and neutron measurement. This data is available mainly from the data bank of The National Oceanic and Atmospheric Administration (NOAA) through internet as indicated later on in each specific case. The only exceptions are the data of Yakutsk ion chamber (station ASK-1), which is available from the author and the muon data created by Ahluwalia (1997). In the past, researchers have generally used annual values that have been filtered. In this study, the author uses the mean values of solar cycle to eliminate the impact of the changes in the sun activity during a cycle on the calculations. This is justifiable given the fact that the focus of this study is on the long term variations. In the linear correlation calculations the Excel functions have been used available in standard PC software.
RESULTS In this study, the regression lines have been calculated using the solar cycle mean values in the aa index (NOOA,
Ollila
823
Table 1. Solar cycle mean values of global temperature change, aa index and CO2 concentrations.
Solar cycle (av. year) 1861 1871 1884 1894 1907 1918 1928 1939 1949 1959 1970 1981 1991 2003
Solar cycle (number) 10 11 12 13 14 15 16 17 18 19 20 21 22 23
Global temper (T) -0.39 -0.28 -0.31 -0.37 -0.5 -0.35 -0.26 -0.02 -0.17 -0.13 -0.12 0.04 0.18 0.42
aa Index 20.7 16.2 15.2 15.1 13.6 16.4 17.7 20.4 23.0 23.4 22.1 24.7 24.8 20.9
CO2 (ppm) 288.70 289.60 291.70 294.60 297.70 301.20 305.40 307.30 311.00 316.90 326.70 338.80 356.60 376.60
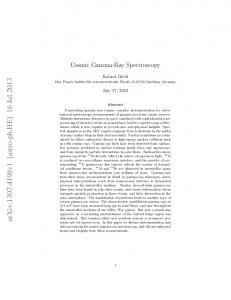
Figure 1. Measured global temperature variations and calculated variations. Calculated values are based on the linear regression fitting of aa index values.
2011a) and values indicating global temperature changes (Jones et al., 2011). These values and CO2 values are listed in Table 1. In the past, researchers have generally used annual values that have been filtered. In this study, the author uses the mean values of solar cycle to eliminate the impact of the changes in the sun activity during a cycle on the calculations. This is justifiable given the fact that the focus of this study is on the long term variations. The results are depicted in Figure 1. The aa index fitting produces the straight line equation T = -1.00724 + 0.0421*aa index with correlation r2 = 0.81 up till year 1991 but the correlation r2 drops to 0.54, when the last solar cycle value was included (T = -1.0444 + 0.0462*aa index). The correlations according to the solar cycle lengths and the sunspot numbers turn to be lower. The strong correlation between the aa index and the temperature changes, point to some interesting areas for
further research. If the sun affects the climate through changes in cloudiness, a research on phenomena that explains cloud formation by ionization is in place. One such phenomenon concerns the changes of cosmic ray fluxes. Ahluwalia (1997) has combined the ion chamber measurements from three stations and he has produced the ion chamber data string for the years 1937 to 1994. Because the data after 1994 was not available for ion chamber measurements in common data bases, this data was asked from Dr. Sergey Starodubtsev, who is the Head of High Energy Cosmic Rays Laboratory in Yakutsk. The original annual data of Yakutsk (station ASK-1) for the years 1953 to 2003 is available from the author. The author has normalized the Yakutsk values into the same value as Ahluwalia (0% for the year 1965 annual value). The graphical presentations of Ahluwalia’s data
824
Int. J. Phys. Sci.
Figure 2. Annual ion chamber data as processed by Ahluwalia (1997) (Muon) and data from Yakutsk (ASK-1).
Moscow, count rate Combined ion chamber
Estimated ion chamber
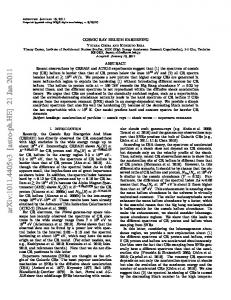
Figure 3. The annual neutron measurements of Moscow and “Combined ion chamber” measurements for 1953 to 2010. Ion chamber measurements are estimated for the period of 2004 to 2009 assuming the symmetrical behaviour of the solar cycle values.
and ASK-1 data are shown in Figure 2. As commented by Ahluwalia (1997), the ASK-1 data is inconsistent with other ion chamber measurements during the period of 1953 to 1963. Thereafter, these two data sets follow each other with minor deviations only. Finally, the ion chamber data set for the years 1937 to 2009 was produced by using Ahluwalia’s data from 1937 to 1965, and ASK-1 data from 1966 to 2009. The author has estimated the years from 2004 to 2009 assuming the symmetrical behaviour for the solar cycle 23 ending in 2009. This continuous data set is called “Combined ion chamber” in this article.
The common understanding has been that the ion chamber measurements and neutron measurements should follow the same pattern, because they measure the same phenomenon by utilizing different sensor technology. The graphs of the neutron measurements from Moscow (NOOA, 2011b) and the newly obtained “Combined ion chamber” measurements are presented in Figure 3. Many researchers have utilised the neutron measurement data of Climax station (NOOA, 2011c) but the data string was available only till year 2006. As can be seen, the ion chamber measurements have started to deviate from neutron measurements after 1991
Ollila
825
Figure 4. Measured global temperature variations and calculated variations. Calculated values are based on the linear regression fitting of CO2 and the ion chamber measurement changes (muon + proxy). The aa index was used as proxy for ion chamber measurements (1868 to 1843).
creating the constant magnitude of relative deviation during the years 1994 to 2004. One could suspect that there is a systematic error in the ion chamber measurements of Yakutsk. The deviation already existed during 1993 to 1994 for Cheltenham/Fredericksburg data (Ahluwalia, 1997) and Yakutsk data follows the changes of these two stations as shown Figure 2. The linear correlation between the Moscow and “Combined ion chamber” produces r2 = 0.92 for years 1958 to 1991 and for the years 1958 to 2003 r2 = 0.60. This is an unexpected change and the reasons can only be speculated. The behaviour of the sun changed radically during the last solar cycle 23 starting from 1996 and ending 2009. The cycle was long and it had a low average sunspot value. In addition, the minimum sunspot values were very low indicating that the sun activity was unusually low. National Aeronautics and Space Administration (NASA, 2009) reported that their probe in the space has measured the highest cosmic ray values in 2009 being 20% beyond anything seen in 50 years. Neutron measurements of Moscow have the all-time maximum during the same year but not so dramatic. The linear correlation for the “Combined ion chamber” data to global temperature changes produces correlation coefficient r2=0.864 for the solar cycles 17 to 23 (years 1934 to 2008). The same kind of correlation for aa index values for the solar cycles 11 to 17 (years 1868 to 1943) gives r2 the value of 0.914. Because cosmic ray measurement values are available only from the year 1937, the aa index values were used as proxy values for
ion chamber measurements before the cycle 17. The proxy values of aa index were obtained by linear fitting between aa index and ion chamber measurements utilizing the solar cycle mean values of the cycle 17 and 18. This data set is called “Muon+proxy”. The linear correlation for “Muon+proxy” and the annual global temperature changes is ∆T=0.39366+0.238576* (Muon+proxy) with r2 value of 0.938. The correlation calculations for CO2 solar cycle mean values (WRI, 2011) produces the linear correlation equation ∆T= 2.91404799+0.008753*CO2 with r2 value of 0.860. The graphs of these parameters are presented in Figure 4. In the temperature changes is a peak during the solar cycle 17 around the year 1939. At same time the same kind of unexpected peak was found in the CO2 data set produced by Beck (Beck, 2007) based on the about 90 000 chemical analysis since 1810. Multilinear correlation of “Muon+proxy” data and this CO2 data does not improve the correlation in respect to temperature changes. DISCUSSION It is not easy to understand why the ion chamber measurements which behave like the sun activity increased during the latest solar cycle 23. However, according to the measurement values this is the case leading into a very good overall correlation. As indicated in the text aforementioned one reason for the Yakutsk (ASK-1) ionization data trend could be a drift in the measurement instrument. Berkova et al. (2008) noticed
826
Int. J. Phys. Sci.
the same trend in this data. They doubt that there could be a drift of the pressure gauge after 1995. The author thinks that the pressure gauge calibration is an easy procedure and it is difficult to believe that it is the reason for the trend changes. Bleeker et al. (2001) have explained that mu mesons monitored by ionization chambers are mainly produced in nuclear collisions of the incoming cosmic ray protons with energies of 15 GeV and more particles with such large magnetic rigidity are only slightly affected by the activity of the sun. Neutron monitoring should be more sensitive for detecting cosmic ray intensity changes originated from the sun. In reality, ionization chamber measurement changes follow very well neutron measurement changes caused by the activity variations of the sun. One can see this correlation in Figure 3 with the value r2 = 0.92 till the year 1991. The author’s idea is that ionization chamber measurements could be the better indication of the sun’s impact on the climate than the neutron measurements because they are based on the ionization phenomenon. This is the same phenomenon as the cosmic rays induce electrical charges on particles affecting cloud formation. Based on these analyses, one could argue that “sun theory” is still alive. The impact mechanism of the sun through cosmic rays and cloudiness may have increased the temperature during the last 150 years. According to Svensmark (2007), a 2% change in low cloud cover can cause a warming effect of 1.2 Wm-2. This value is almost the same as the total anthropogenic warming effect of 1.6 Wm-2 since 1750 as reported by IPPC (2007). There are still two competing theories of global warming: sun theory and anthropogenic impact. The recent changes in the ion chamber measurements need to be confirmed by using the data from other ion chamber stations. If after comparing these data, we still find that the changes described previously are true, further studies are needed to understand the causes of this behaviour. ACKNOWLEDGEMENTS This research was supported by Aalto University through the Adjunct Associate Professorship of the author. Dr. Maija Härkönen has checked and improved the text formulation. The views expressed are those of the author and do not necessarily reflect those of the sponsoring institute. REFERENCES Ahluwalia HS (1997). Galactic cosmic ray variations at a high latitude sea level site 1937-1994. J. Geophys. Res., 102: 24229-24236. Beck EG (2007). 180 years of atmospheric CO2 gas analysis by chemical methods. Energy. Environ., 18: 259-282.
Berkova M, Belov A, Eroshenko E, Smirnov D, Yanke V (2008). Temperature effect of muon component and practical questions of its st account. 21 European Cosmic Ray Symposium in Kosice, Slovakia. Bleeker JAM, Geiss J, Huber MCE (2001). The Century of Space Science. Kluwer Academic Publishers, Dordrecht, The Netherlands, pp. 1529-1557. Cliver EW, Boriakoff V, Feynman J (1998). Solar variability and climate change: Geomagnetic aa index and global surface temperature. Geophys. Res. Lett., 25: 1035-1038. El-Borie MA, Al-Thoyaib SS (2006). Can we use the aa geomagnetic activity index to predict partially the variability in global mean temperature? Int. J. Phys. Sci., 1: 67-74. Friis-Christensen E, Lassen K (1991). Length of the solar cycle; an indicator of solar activity closely associated with climate. Science, 254: 698-254. IPPC (2007). Summary for policymakers in Climate Change 2007: The Physical Science Basis. Cambridge University Press, Cambridgre. Jones PD, Osborn TJ, Briffa KR, Parker DE (2011). Global temperature trends. http://cdiac.esd.ornl.gov/ftp/trends/temp/jonescru/global.txt. Jørgensen TS, Hansen AW (2000). Comment on “Variation of cosmic ray flux and global coverage - a missing link in solar-climate relationships”. J. Atmos. Solar Terr. Phys., 62: 73-77. Kernthaler C, Toumi R, Haigh JD (1999). Some doubts concerning a link between cosmic ray fluxes and global cloudiness. Geophys. Res. Lett., 26: 863-865. Marsh ND, Svensmark H (2000). Low cloud properties influenced by cosmic rays. Phys. Rev. Lett., 85: 5004-5007. Nasa (2009). Unexpectedly, cosmic ray intensity in space reaches highest level in 50 years. http://www.popsci.com/military-aviationamp-space/article/2009-09/cosmic-rays-reach-record-levels-nasawarns. NOOA (2011a). Geomagnetic aa index. ftp://ftp.ngdc.noaa.gov/STP/SOLAR_DATA/ RELATED_INDICES/AA_INDEX/AA_YEAR. NOOA (2011b). Moscow, Neutron data. ftp://ftp.ngdc.noaa.gov/STP/ SOLAR_DATA/COSMIC_RAYS/STATION_DATA/Moscow/Monthly/ moscow.tab. NOOA (2011c). Climax, Neutron data. ftp://ftp.ngdc.noaa.gov/STP/SOLAR_DATA/ COSMIC_RAYS/STATION_DATA/Climax/. Palle E, Butler CJ, O’Brien KO (2004). The possible connection between ionization in the atmosphere by cosmic rays and low level clouds: J. Atmos. Solar Terr. Phys., 66: 1779-170. Svensmark H (1998). Influence of cosmic rays on earth’s climate. Ph. Rev. Lett. 81: 5027-5030. Svensmark H, Friis-Christensen E (1997). Variation of cosmic ray flux and global cloud coverage - a missing link in solar-climate relationships. J. Atmos. Solar Terr. Phys., 59: 1225-1232. Svensmark H, Friis-Christensen E (1999). Reply to the comments on “Variations of cosmic ray flux and global cloud coverage – a missing link in solar-climate relationship”. J. Atmos. Solar Terr. Phys., 62: 7980. Svensmark H (2007). Cosmoclimatology: A new theory emerges. A&G, 48: 1.18-1.24. Usoskin IG, Schussler M, Solanki SK, Mursula K (2005). Solar activity, cosmic rays, and earth’s temperature: A millennium-scale comparison. J. Geophys. Res., 110: A10102. doi: 10.1029/2004JA010946. WRI (2011). World Resources Institute, CO 2 trends. http://earthtrends.wri.org/text/climate-atmosphere/variable-82.html.