RESEARCH ARTICLE
Changes in Drivers’ Visual Performance during the Collision Avoidance Process as a Function of Different Field of Views at Intersections Xuedong Yan1*, Xinran Zhang1, Yuting Zhang1, Xiaomeng Li1, Zhuo Yang2
a11111
1 MOE Key Laboratory for Urban Transportation Complex System Theory and Technology, School of Traffic and Transportation, Beijing Jiaotong University, Beijing 100044, PR China, 2 Department of Civil, Environmental, and Infrastructure Engineering, George Mason University, Fairfax, Virginia, United States of America *
[email protected]
Abstract OPEN ACCESS Citation: Yan X, Zhang X, Zhang Y, Li X, Yang Z (2016) Changes in Drivers’ Visual Performance during the Collision Avoidance Process as a Function of Different Field of Views at Intersections. PLoS ONE 11(10): e0164101. doi:10.1371/journal. pone.0164101 Editor: Tieqiao Tang, Beihang University, CHINA Received: May 3, 2016 Accepted: August 31, 2016 Published: October 7, 2016 Copyright: © 2016 Yan et al. This is an open access article distributed under the terms of the Creative Commons Attribution License, which permits unrestricted use, distribution, and reproduction in any medium, provided the original author and source are credited. Data Availability Statement: The minimal data set cannot be made publicly available in order to protect the participants’ privacy. However, readers may contact the author, Ms. Xinran Zhang to request the data. Authors confirm that data will be available upon request to all interested researchers. Funding: The work described in this paper was supported by the National Natural Science Foundation of China (http://www.nsfc.gov.cn/) (71210001) and the BJTU Basic Scientific Research (2016YJS084, 2015YJS092). The funders had no role in study design, data collection
The intersection field of view (IFOV) indicates an extent that the visual information can be observed by drivers. It has been found that further enhancing IFOV can significantly improve emergent collision avoidance performance at intersections, such as faster brake reaction time, smaller deceleration rate, and lower traffic crash involvement risk. However, it is not known how IFOV affects drivers’ eye movements, visual attention and the relationship between visual searching and traffic safety. In this study, a driving simulation experiment was conducted to uncover the changes in drivers’ visual performance during the collision avoidance process as a function of different field of views at an intersection by using an eye tracking system. The experimental results showed that drivers’ ability in identifying the potential hazard in terms of visual searching was significantly affected by different IFOV conditions. As the IFOVs increased, drivers had longer gaze duration (GD) and more number of gazes (NG) in the intersection surrounding areas and paid more visual attention to capture critical visual information on the emerging conflict vehicle, thus leading to a better collision avoidance performance and a lower crash risk. It was also found that female drivers had a better visual performance and a lower crash rate than male drivers. From the perspective of drivers’ visual performance, the results strengthened the evidence that further increasing intersection sight distance standards should be encouraged for enhancing traffic safety.
Introduction Road traffic crashes are consistently one of the top ten causes of death worldwide, among which intersection crashes lead to substantial severe injuries or fatalities [1]. The intersection crash rate can be effectively reduced through improving intersection sight distance (ISD) [2–
PLOS ONE | DOI:10.1371/journal.pone.0164101 October 7, 2016
1 / 22
Drivers’ Visual Performance during the Collision Avoidance Process
and analysis, decision to publish, or preparation of the manuscript. Competing Interests: The authors have declared that no competing interests exist.
4]. Sight distance is the length of the roadway ahead that should be visible to the driver [5]. In order to timely detect potential conflict vehicles and permit the drivers to anticipate and avoid potential collisions at an intersection, each quadrant of an intersection should contain a triangular area formed by sufficient ISD free of sight obstructions [5]. Essentially, the triangular areas free of obstructions at intersections are equivalent to drivers’ intersection field of view (IFOV), which represents drivers’ horizontal visibility at intersections. To reduce the ISD-related crash risk, it is critical to understand the effect of drivers’ IFOV on the collision avoidance performance, which depends on each individual driver’s judgment, capabilities, and response to conflict vehicles in the emergent situation. Yan et al. indicated that even under an assumption of valid ISD design compliant with the AASHTO design standards, further enhancing IFOV can significantly improve emergent collision avoidance performance at intersections, such as faster brake reaction time, smaller deceleration rate, and lower traffic crash involvement risk [6]. However, it is not clear how different IFOVs influence the drivers’ eye movement patterns and how the changes in drivers’ eye movements further impact the collision avoidance performance. It was reported that about 90% of driving information is captured through the eyes [7]. Eye movements are considered as the behavioral interface between visual attention and information acquisition from the driving environments [8]. Visual attention while driving is used to direct information processing resources to potentially important visual event [9]. Evidence from previous research has been established that driving performance depends on visual attention [10, 11]. Persistent and accurate visual scanning of the intersection traffic environment is of great importance in understanding and determining drivers’ performance. On the contrary, the lack of visual attention to relevant driving events is one of the main factors in traffic crashes [12, 13]. Through investigating 2,258 traffic crashes, Treat et al. concluded that inadequate lookout and inattention were the two leading causes of the crashes [14]. A study of 723 crashes found that 37.8% of the accidents were due to drivers’ inattention or perceptual errors [15]. At intersections, a large number of crashes were due to failures to manage speed and maintain attention [16, 17], which may lead to failures to observe and appropriately judge the distance or speed of oncoming vehicles [18] and to see relevant traffic signs or signals [19] and cross traffic [20]. Numerous studies indicated that a driver’s useful FOV (UFOV) plays a significant role in driving. UFOV is defined as the visual area in which useful information can be acquired without eye and head movements (within one eye fixation) [21]. It is directly associated with driver’s ability of visual information acquisition [7, 22–24]. A consequence of reduced UFOV is the larger number of eye movements required to identify the location of a target [25]. With a constrained range of focus, drivers are less likely to perceive the objects around them and thus more likely to brake too late for collision avoidance [26]. Thus, better IFOV can help driver enlarge visibility at intersections in order to earlier and effectively search for the critical information, such as conflicting traffic. A recent simulator study has shown that further increasing IFOVs at unsignalized intersections can improve drivers’ emergent collision avoidance performance under an assumption of valid ISD design [6]. However, little research has been conducted to explore how IFOV affects drivers’ eye movements, visual attention and the relationship between visual searching and traffic safety, especially at non-signalized intersection. The purpose of the study is to examine whether better IFOV conditions at non-signalized intersections can further improve drivers’ visual performance during the collision avoidance process and analyze the relationship between drivers’ eye movements and traffic safety. A simulator-based experiment with three different IFOV conditions was conducted to test drivers’ collision avoidance performance and identify the patterns in drivers’ scanning activities such as
PLOS ONE | DOI:10.1371/journal.pone.0164101 October 7, 2016
2 / 22
Drivers’ Visual Performance during the Collision Avoidance Process
gaze duration, number of gazes and average gaze duration by the eye tracking system. The experimental results of this study would lead to a better understanding of the relationships among driving performance, eye moments and traffic safety under different IFOV conditions and provide a reference for sight distance design at non-signalized intersections.
Method Ethics statement The research involving human participants in this study has been approved by the Beijing Jiaotong University's research committee (per IRB). The written informed consent form for the experiment was also signed by each participant in this study.
Participants The experiment was a 3 (IFOV conditions) × 2 (gender) mixed design with repeated measures on the factor of IFOV. Twenty-three participants (11 men and 12 women) were recruited from the local community. All of the participants held a valid driver’s license and had at least three years of driving experience. Those with simulator sickness problems that could affect their driving performance were excluded. Their ages ranged from 30 to 40, with an average age of 35 years and a standard deviation (S.D.) of 2.99 years. It should be noted that examining the age effect on drivers’ eye movements was beyond the scope of this study. To be eligible for inclusion, participants had to hold a valid driver’s license, have at least three years of driving experience and drive more than 20,000 kilometers per year. Those with health problems that could affect driving behavior were excluded. The experiment lasted for about 30 minutes for each participant, who was compensated with RMB500 (approximately US$80).
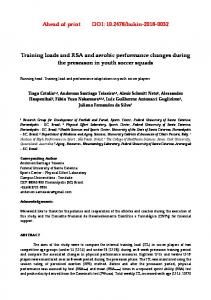
Equipment The Beijing Jiaotong University (BJTU) driving simulator equipped with eye tracking glasses (ETG) was used to conduct the experiment and collect the datasets, as shown in Fig 1. The individual in this manuscript has given written informed consent to publish these case details. The BJTU simulator is a high-performance, high-fidelity driving simulator with a linear motion base capable of operating with one degree of freedom. It comprises a full-size vehicle cabin (Ford Focus) with a real operational interface, environmental noise and shaking simulation system, digital video replay system and vehicle dynamic simulation system. The simulated environment is projected at 300 degrees of a frontal/peripheral field of view at a resolution of 1400 × 1050 pixels and left, middle and right rear view mirrors. The software in the simulator lab allows for driving scenario design, virtual traffic environment simulation, and virtual road modeling. Tracking eye movement has been considered as an appropriate way to measure drivers’ visual activities [13, 27–29]. In this experiment, ETG was designed as highly integrated glasses with a natural appearance to wear comfortably and used to collect participants’ binocular eye movements without restrictions of cab environment and the range of head motion. The ETG contains three video cameras: one is used to record the frontal views of participants and the other two are used to capture participants’ eye movements. The positions of participants’ fixation points and the tracks of their scanning activities distributed in the driving scenes are recorded in the video files. The specific information on the eye-movements variables (e.g., fixation, saccade and blink) such as time, duration and counts are all recorded in the eye tracker system.
PLOS ONE | DOI:10.1371/journal.pone.0164101 October 7, 2016
3 / 22
Drivers’ Visual Performance during the Collision Avoidance Process
Fig 1. The BJTU driving simulator with eye tracking system. (a) BJTU driving simulator. (b) Eye tracking data analysis system. doi:10.1371/journal.pone.0164101.g001
Scenario design The scenarios of non-control intersections were selected to test the influence of IFOV on drivers’ crash avoidance performance and eye movements. From MUTCD (2009), the non-control intersections may exist when the average traffic volume from all approaches is lower than 2,000 units per day, where the approaching drivers should be able to see potentially conflicting vehicles in sufficient time to stop before reaching the intersection. According to AASHTO’s (2011), from the field observations at non-control intersections, drivers typically reduce their speed to 50% of their mid-block operation speed when approaching a non-control intersection. However, the traffic behavior patterns at non-signalized intersections in developing countries are different from the developed countries, where the common rules of “giving way” and “priorities” are not fully respected in most cases. Traffic conflicts at the intersections often occur because of drivers trying to “cut the corners” on the minor road. Additionally, the drivers on the minor are more likely to overspeed while approaching the intersections [30]. In China, the non-control intersections are typically seen in rural areas owing to lower traffic volume, where serious traffic collisions frequently happen especially when the intersection sight distance is restricted or drivers are speeding at the intersections. The driving scenario designed in this study was the same as the study by Yan et al [6]. In this experiment, typical two-way two-lane non-control intersections with a 3.5 m lane width were created, and the speed limit was set at 80 km/h on the intersection’s major road and 60 km/h on the intersecting minor road. According to AASHTO’s ISD recommendations for non-control intersections [5], the lengths of clear sight triangle legs should be 75 m for a design speed of 80 km/h and 55 m for a design speed of 60 km/h. For the non-control intersections in this study, three IFOV conditions were designed based on the AASHTO’s standards. For the IFOV1 condition, the lengths of clear sight triangle legs are 80 m on the major road and 70 m on the minor road, which marginally satisfies the basic ISD requirement for non-control intersection. Based on the IFOV1 condition, the intersection angles of IFOV2 and IFOV3
PLOS ONE | DOI:10.1371/journal.pone.0164101 October 7, 2016
4 / 22
Drivers’ Visual Performance during the Collision Avoidance Process
conditions are increased by 5° successively. These different IFOV conditions are realized by moving the location of a building (sight obstruction) further from the corner of the intersection along the major road. Thus, the drivers when approaching the intersection from the major road can gradually have a wider horizontal view as the increase of the IFOVs. The design purpose of these three IFOV conditions is to explore whether better IFOV condition could further improve drivers’ visual performance during the crash avoidance process at non-signalized intersections, even though the sight distance has met the current intersection design standards. A time-to-collision (TTC) sensor was used to realize the emergent scenario of pre-crash between the simulator vehicle on the major road and a conflict vehicle (from the right side of the major road) on the minor road that are simultaneously approaching the intersection, and the TTC threshold (the approaching time of the conflict vehicle to the conflict point at the intersection) was designed as 5 s in this experiment. When the TTC sensor was triggered by the simulator vehicle, the conflict vehicle would start to approach the conflict point at a constant speed of 72 km/h. The distance from the conflict vehicle’s initial position to the conflict point was set at 100 m upstream of the minor road. In such a situation, if drivers did not take any collision avoidance maneuvers, they would collide with the conflict vehicle.
Experimental procedure Upon arrival at BJTU, the features of driving simulator and ETG system were introduced to the participants, who were also indicated that the purpose of the experiment is to test the simulation fidelity of the BJTU driving simulator and they should adhere to traffic laws and drive as normal as what they do in reality. Before actual recording of drivers’ eye movements, the ETG system had to be calibrated for each driver to ensure an accurate collection of the fixation points. Then, a practice drive for at least 10 min was conducted for each participant to familiarize with the operation of the driving simulator. During the practice test, participants were advised to adhere to traffic laws and try different basic driving maneuvers such as acceleration, deceleration, braking and right/left turns. They were also notified that if they felt motion sickness or any other kind of discomfort, they were free to quit the experiment at any time. After a five-minute break, participants needed to perform three sets of formal experiments under different IFOV conditions in a random sequence to eliminate the experiment order effect. Each experiment included the same rural road network that composed of a series of typical two-way two-lane intersections. Among these typical intersections, only one intersection was randomly assigned to test drivers’ eye movements and driving performance. An emergent pre-crash scenario is a small probability event in real life, and drivers are unlikely to encounter one emergent conflict after another in short time. Hence, at least 10 minutes of normal driving in a typical rural road were inserted between each two sets of experiments to prevent from speculating about the experiment’s purpose and to minimize speculation to the repeated collision avoidance tests.
Experimental data manipulation and dependent variables During the experiments, raw data on driving behavior were sampled at 60 Hz while the datasets of eye movements were sampled at 30 Hz. Thus, it was necessary to synchronize the two types of datasets according to the time when the simulator arriving at the same location coordinates both in the SMI BeGaze video and in the driving behavior datasets, and then we recorded two time points and made a subtraction of two time points to match two datasets at the same time point when the simulator arrived at the same location coordinates in SMI BeGaze video and driving scenes. Based on the performance of 23 participants, 69 records were obtained from the three rounds of experiments under three IFOV conditions. Drivers’ scan paths (spatial sequence of
PLOS ONE | DOI:10.1371/journal.pone.0164101 October 7, 2016
5 / 22
Drivers’ Visual Performance during the Collision Avoidance Process
Fig 2. Classification of AOIs. a) Right AOI. (b) Left AOI. (c) Forward roadway AOI. (d) Collision vehicle AOI. doi:10.1371/journal.pone.0164101.g002
fixations) and vehicle-operation performance variables were both recorded during the 5 s time period during which the conflict vehicle was triggered and traveled to the conflict point. The visual performance variables indicating eye movements include gaze duration (GD), number of gazes (NG), and average gaze duration (AGD) on the particular area of interest (AOI). The AOIs were divided into right area, left area, forward roadway and the conflict vehicle in this paper, as shown in Fig 2. Besides, vehicle-operation performance was indicated by brake time to conflict point (BTC) and collision or not (CON). Because three problem data were removed (the three eye movement data were failed to be correctly collected owing to drivers improperly adjusted the eye tracking glasses during the process of experiment), finally sixty-six records
PLOS ONE | DOI:10.1371/journal.pone.0164101 October 7, 2016
6 / 22
Drivers’ Visual Performance during the Collision Avoidance Process
were used for statistical analyses. The hypothesis testing in this study was based on a 0.05 significance level. Specifically, the dependent variables are defined and explained as follows: • Gaze duration (GD): Gaze duration was a cumulative duration in which a series of consecutive fixations fell within a particular AOI, and typically include several fixations and the relatively small amount of saccades between these fixations. The end time of the gaze was recorded when a fixation occurring outside of the AOI. GD was used to compare visual attention distributed among different AOIs. Especially, the gaze duration on the conflict vehicle (GDCV) was collected to analyze the effects of IFOV on drivers’ attention on the critical visual information. • Number of gazes (NG): It was the number of gazes on the particular AOI, which can reflect drivers’ scanning activities and frequencies of visual search. Particularly, NGCV means the number of gazes on the conflict vehicle. • Average gaze duration (AGD): It was calculated by dividing gaze duration by the number of gazes and reflects drivers’ visual search speed. A longer average gaze duration indicates slower visual search speed. Specifically, AGDCV was used to represent the average gaze duration on the conflict vehicle. • Brake time to conflict point (BTC): BTC was measured from the time that the driver started a brake action to the time that he or she would arrive at the conflict point at the speed when braking. It was used to reflect drivers’ reaction and ability to decelerate in time to avoid a collision. • Collision or not (CON): CON represented whether the driver collided with the conflict vehicle or not. It was an index for traffic safety evaluation.
Statistical analysis method Beyond the descriptive statistical analyses of the dependent variables, the logistic regression analysis was applied to test the effects of IFOV and gender on CON since it is a binary variable (collision or not), which can directly indicate the relationship between intersection field of view and driver’s collision risk under emergent situation. Additionally, the ANOVA method was used to investigate differences in the other continuous variables, such as GD, NG, AGD, and BTC, between the factors. The hypothesis testing in the following analyses was based on a 0.05 significance level.
Experimental Results Collision rates (COR) Table 1 shows the COR results of drivers’ collision avoidance and the logistic regression results for COR. The results showed that the COR results was significantly affected by different IFOV conditions (p = 0.044). There was a clear decreasing trend of COR as the IFOV condition increased. Respectively, the COR was 56.52% for IFOV1, 30.00% for IFOV2 and 21.74% for IFOV3. Compared with the condition of IFOV1, the COR under conditions of IFOV2 and IFOV3 was decreased by 67.7% and 79.8% respectively. Although the COR was not significantly affected by gender (p = 0.150), it was found that male drivers had a higher COR than female drivers (45.16% vs. 28.57%).
Brake time to conflict point (BTC) Different collision avoidance maneuvers (deceleration, acceleration or no avoidance maneuvers) were taken by the drivers to avoid colliding with a conflict vehicle when approaching a
PLOS ONE | DOI:10.1371/journal.pone.0164101 October 7, 2016
7 / 22
Drivers’ Visual Performance during the Collision Avoidance Process
Table 1. Descriptive statistical results and logistic regression results for COR. Factor
COR
Total
Collision Count IFOV
Gender
Non-collision
Percentage
Count
Percentage
IFOV1
13
56.52%
10
43.48%
23
IFOV2
6
30.00%
14
70.00%
20
IFOV3
5
21.74%
18
78.26%
23
Female
10
28.57%
25
71.43%
35
Male
14
45.16%
17
54.84%
31
24
36.36%
42
63.64%
66
Total
Logistic regression results for COR Factor
B
S.E.
Wald
df
Sig.
Exp(B)
IFOV
---
---
6.269
2
0.044
---
IFOV2Vs. IFOV1
-1.129
0.657
2.952
1
0.086
0.323
IFOV3Vs. IFOV1
-1.599
0.672
5.652
1
0.017
0.202
Male Vs. Female
0.795
0.552
2.074
1
0.150
2.215
Constant
-1.016
.400
6.447
1
0.011
0.362
doi:10.1371/journal.pone.0164101.t001
non-signalized intersection. The results suggested that the majority of drivers considered deceleration avoidance maneuver to the safest option for avoiding a collision with a conflict vehicle when crossing an intersection (77.27% of the participants), whereas only 12.12% of them chose acceleration collision avoidance and 10.61% of them took no collision avoidance. Thus, the influences of IFOV conditions and genders on the deceleration avoidance maneuver indicated by BTC were analyzed in this study. Table 2 shows the descriptive statistics and ANOVA results for the BTC during the process of collision avoidance with the conflict vehicle. It was found that the IFOV conditions (F = 17.33, p < 0.001) significantly influenced the BTC, while gender had a marginally significant effect on the BTC (F = 3.044, p = 0.088). The BTC was lowest under IFOV1 condition (M = 1.280 s, S.D. = 1.148 s), followed by the conditions of IFOV2 (M = 2.450 s, S.D. = 1.182 s) and IFOV3 (M = 3.551 s, S.D. = 1.194 s). Fig 3-a clearly showed that the mean BTC increased as drivers’ IFOV conditions improved, which implied that the drivers took collision avoidance maneuvers earlier with increasing IFOV. Fig 3-b showed the mean BTC for males and females. Male drivers had longer mean BTC than female drivers (M = 2.840 s, S.D. = 1.607 s vs. M = 2.287 s, S.D. = 1.401 s), which implied male drivers braked earlier than female drivers. In Table 2. Descriptive statistics and ANOVA results for BTC. Variable
BTC (s) Count
IFOV
Gender
S.D. a
Min
F-ratio
P-value
17.33
0.000
Max
IFOV1
16
1.280
1.148
0.050
4.350
IFOV2
15
2.450
1.182
0.417
4.233
IFOV3
20
3.551
1.194
0.845
5.183
Male
21
2.840
1.607
0.050
5.183
Female
30
2.287
1.401
0.183
4.712
51
2.515
1.499
0.050
5.183
Total a
Mean
3.044
0.088
S.D. = standard deviation.
doi:10.1371/journal.pone.0164101.t002
PLOS ONE | DOI:10.1371/journal.pone.0164101 October 7, 2016
8 / 22
Drivers’ Visual Performance during the Collision Avoidance Process
Fig 3. Mean BTC for different factors and CON results. (a) Mean BTC under three different IFOV conditions. (b) Mean BTC for different genders. (c) Mean BTC for different CON results. doi:10.1371/journal.pone.0164101.g003
addition, the BTC significantly influenced the CON results (F = 26.649, p 0.1), total AOIs (F = 1.772, p = 0.179) and conflict vehicle AOI (F = 1.236, p > 0.1). The gaze duration in the forward roadway AOI was highest under IFOV1 condition (M = 2.987 s, S.D. = 1.161 s), followed by the conditions of IFOV2 (M = 2.445 s, S.D. = 0.792 s) and IFOV3 (M = 2.156 s, S.D. = 1.039 s) as shown in Fig 4-a. Compared with the IFOV2 and IFOV3 conditions, drivers spent more time to gaze at the forward roadway under IFOV1 condition and consequently they spent less time in observing the right AOI, which might lead to a lower likelihood in detecting the conflict vehicle.
PLOS ONE | DOI:10.1371/journal.pone.0164101 October 7, 2016
10 / 22
Drivers’ Visual Performance during the Collision Avoidance Process
Fig 4. Mean GD in different AOIs for different factors and CON results. (a) Mean GD in different AOIs under three different IFOV conditions. (b) Mean GD in different AOIs for different genders. (c) Mean GD in different AOIs for different CON results. doi:10.1371/journal.pone.0164101.g004
PLOS ONE | DOI:10.1371/journal.pone.0164101 October 7, 2016
11 / 22
Drivers’ Visual Performance during the Collision Avoidance Process
Gender significantly influenced gaze duration in the right AOI (F = 8.437, p = 0.005), forward roadway AOI (F = 6.144, p = 0.016) and conflict vehicle AOI (F = 9.204, p = 0.004), while there was no significant effect on the left AOI (F = 0.271, p > 0.1) and total AOIs (F = 2.516, p = 0.118). Fig 4-b showed that male drivers spent more time in gazing at the forward roadway than female drivers (M = 2.856 s, S.D. = 0.872 s vs. M = 2.247 s, S.D. = 1.145 s), and male drivers had less time to observe the right AOI than female drivers (M = 1.553 s, S.D. = 0.745 s vs. M = 2.184 s, S.D. = 0.985 s). Fig 4-b also showed that female drivers spent longer gaze duration (M = 1.691 s, S.D. = 0.862 s vs. M = 1.127 s, S.D. = 0.578 s) in the conflict vehicle AOI than male drivers during the process of collision avoidance. The longer gaze duration of female drivers in the conflict vehicle AOI and the right AOI implied that female drivers paid more attention to the conflict vehicle or the potential hazardous area than male drivers in terms of longer gaze duration. The gaze duration was also significantly different between collision group and non-collision group in the right AOI (F = 23.863, p < 0.001), forward roadway AOI (F = 38.099, p < 0.001), total AOIs (F = 7.315, p = 0.009) and conflict vehicle AOI (F = 9.764, p = 0.003). Compared with the collision group, drivers in non-collision group had a longer gaze duration in the right AOI (M = 2.251 s, S.D. = 0.858 s vs. M = 1.252 s, S.D. = 0.683 s), shorter gaze duration in the forward roadway AOI (M = 2.046 s, S.D. = 0.890 s vs. M = 3.386 s, S.D. = 0.768 s), shorter gaze duration in total AOIs (M = 4.638 s, S.D. = 0.196 s vs. M = 4.767 s, S.D. = 0.170 s) and longer gaze duration in the conflict vehicle AOI (M = 1.642 s, S.D. = 0.852 s vs. M = 1.049 s, S.D. = 0.484 s) as shown in Fig 4-c. It shows that drivers would be in a safer situation if they had shorter gaze duration in the forward roadway AOIs but more gaze duration in the right AOI especially on the conflict vehicle during the process of collision avoidance.
Number of gazes (NG) Table 4 shows the descriptive statistics and ANOVA results for the number of gazes in different AOIs during the process of collision avoidance. The IFOV conditions were found to significantly influence the number of gazes in the right AOI (F = 3.373, p = 0.041) and forward roadway AOI (F = 4.033, p = 0.023), while there was no significant effect on the left AOI (F = 1.129, p > 0.1), total AOIs (F = 2.924, p = 0.061) and conflict vehicle AOI (F = 2.226, p > 0.1). The number of gazes in the right AOI (M = 3.05, S.D. = 2.24), forward roadway (M = 3.85, S.D. = 3.05) AOI were highest under the IFOV2 condition, followed by the conditions of IFOV3 (right AOI: M = 2.30, S.D. = 0.93; forward roadway AOI: M = 2.70, S.D. = 1.18) and IFOV1 (right AOI:M = 1.87, S.D. = 0.87; forward roadway AOI: M = 2.13, S.D. = 1.14) as shown in Fig 5-a. A possible explanation is that compared with the IFOV3 condition, the more restricted field of view in IFOV2 condition caused drivers to scan more times in the right AOI to identify the potential hazardous vehicle; however, the most serious field of view restriction in the IFOV1 condition might prevent the drivers from detecting the conflict vehicle. Therefore, the number of gazes in the right AOI was highest in IFOV2 condition but lowest in IFOV1 condition. Gender had no significant influence on the number of gazes in different AOIs including the right AOI (F = 3.562, p = 0.064), the forward roadway AOI (F = 3.590, p = 0.063), the left AOI (F = 0.806, p > 0.1), and total AOIs (F = 2.631, p > 0.1), but it significantly influenced the number of gazes in the conflict vehicle AOI (F = 8.243, p = 0.006). Fig 5-b showed that female drivers had more numbers of gazes (M = 2.14, S.D. = 0.91 vs. M = 1.58, S.D. = 0.76) in the conflict vehicle AOI than male drivers during the process of collision avoidance, implying that female drivers paid more attention to the conflict vehicle than male drivers in terms of the number of gazes.
PLOS ONE | DOI:10.1371/journal.pone.0164101 October 7, 2016
12 / 22
Drivers’ Visual Performance during the Collision Avoidance Process
Table 4. Descriptive statistical results and ANOVA analysis results for NG in different AOIs. AOI Right (s)
Count
Mean
S.D. a
Min
Max
F-ratio
P-value
IFOV1
23
1.87
0.87
1
3
3.373
0.041
IFOV2
20
3.05
2.24
1
12
IFOV3
23
2.30
0.93
1
5
Male
31
2.03
0.84
1
3
3.562
0.064
Female
35
2.69
1.86
1
12
66
2.38
1.5
1
12
IFOV1
23
2.13
1.14
1
6
4.033
0.023
IFOV2
20
3.85
3.05
1
16
IFOV3
23
2.7
1.18
1
6
Male
31
2.39
0.95
1
4
3.590
0.063
1.129
0.330
0.806
0.373
2.924
0.061
2.631
0.11
2.226
0.117
8.243
0.006
Factors IFOV
Gender Total Forward roadway (s)
IFOV
Gender
Female
35
3.26
2.59
1
16
66
2.85
2.03
1
16
IFOV1
23
0.39
0.66
0
2
IFOV2
20
1.3
3.28
0
15
IFOV3
23
0.57
0.79
0
3
Male
31
0.52
0.63
0
2
Female
35
0.91
2.56
0
15
66
0.73
1.91
0
15
Total Left (s)
IFOV
Gender Total Total (s)
IFOV
Gender
IFOV1
23
4.39
2.33
2
11
IFOV2
20
8.2
8.41
3
43 11
IFOV3
23
5.57
2.13
2
Male
31
4.94
1.95
2
8
Female
35
6.86
6.75
2
43
66
5.95
5.15
2
43
IFOV1
23
1.61
0.72
1
3
IFOV2
20
1.90
0.72
1
3
IFOV3
23
2.13
1.10
1
5
Male
31
1.58
0.76
1
4
Female
35
2.14
0.91
1
5
66
1.88
0.89
1
5
Total Conflict vehicle (s)
IFOV
Gender Total a
S.D. = standard deviation.
doi:10.1371/journal.pone.0164101.t004
The number of gazes was significantly different between collision group and non-collision group in the right AOI (F = 8.438, p = 0.005), the forward roadway AOI (F = 4.471, p = 0.038), total AOIs (F = 4.815, p = 0.032) and conflict vehicle AOI (F = 14.776, p < 0.001). Compared to the collision group, drivers in the non-collision group had a higher number of gazes in the right AOI (M = 2.76, S.D. = 1.64 vs. M = 1.71, S.D. = 0.91), forward roadway AOI (M = 3.24, S. D. = 2.34 vs. M = 2.17 times, S.D. = 1.09), total AOIs (M = 6.98, S.D. = 6.06 vs. M = 4.17, S.D. = 2.04) and conflict vehicle AOI (M = 2.17, S.D. = 0.88 vs. M = 1.38, S.D. = 0.65), as shown in Fig 5-c. It implied that the drivers who scanned more times when approaching the intersection were less likely to have a collision.
Average gaze duration (AGD) Table 5 shows the descriptive statistics and ANOVA results for the average gaze duration in different AOIs during the process of collision avoidance. The IFOV conditions significantly
PLOS ONE | DOI:10.1371/journal.pone.0164101 October 7, 2016
13 / 22
Drivers’ Visual Performance during the Collision Avoidance Process
Fig 5. Mean NG in different AOIs for different factors and CON results. (a) Mean NG in different AOIs under three different IFOV conditions. (b) Mean NG in different AOIs for different genders. (c) Mean NG in different AOIs for different CON results. doi:10.1371/journal.pone.0164101.g005
PLOS ONE | DOI:10.1371/journal.pone.0164101 October 7, 2016
14 / 22
Drivers’ Visual Performance during the Collision Avoidance Process
influenced the average gaze duration in the forward roadway AOI (F = 7.615, p = 0.001) and total AOIs (F = 6.836, p = 0.002), while there was no significant effect on the right AOI (F = 1.550, p > 0.1), left AOI (F = 0.391, p > 0.1) and conflict vehicle AOI (F = 0.130, p > 0.1). The average gaze duration in the forward roadway AOI (M = 1.956 s, S.D. = 1.450 s) and total AOIs (M = 1.418 s, S.D. = 0.750 s) were highest under the IFOV1 condition, followed by the conditions of IFOV3 (forward roadway: M = 0.977 s, S.D. = 0.840 s; total AOIs: M = 0.996 s, S. D. = 0.528 s) and IFOV2 (forward roadway: M = 0.890 s, S.D. = 0.684 s; total AOIs: M = 0.787 s, S.D. = 0.363 s) as shown in Fig 6-a. It implied that drivers with longer average gaze durations in the IFOV1 condition would have a slower visual search speed in total AOIs; and the drivers would especially have a slower visual search speed in the forward roadway AOI. Gender significantly influenced the average gaze duration in the forward roadway AOI (F = 5.384, p = 0.024), while the effects on the right AOI (F = 2.156, p > 0.1), left AOI (F = 0.135, p > 0.1), total AOIs (F = 1.264, p > 0.1) and conflict vehicle AOI (F = 0.969, p > 0.1) were not significant. Fig 6-b showed that female drivers spent a shorter average gaze duration per observation time in the forward roadway AOI than male drivers (M = 1.014 s, S. D. = 0.975 s vs. M = 1.606 s, S.D. = 1.268 s), which implied that female drivers would have a faster visual search speed on the forward roadway than male drivers. The average gaze duration was also significantly different between collision group and noncollision group in the forward AOI (F = 26.722, p < 0.001) and total AOIs (F = 15.283, p < 0.001). Compared with the collision group, drivers in non-collision group had a shorter average gaze duration in the forward roadway AOI (M = 0.822 s, S.D. = 0.663 s vs. M = 2.113 s, S.D. = 1.366 s) and in total AOIs (M = 0.873 s, S.D. = 0.469 s vs. M = 1.441 s, S.D. = 0.710 s), as shown in Fig 6-c. It indicated that the collision risk of drivers would be reduced if they had faster visual search speed in terms of shorter average gaze duration in the total AOIs, especially in the forward roadway AOI during the process of collision avoidance.
Discussion Relationship between eye movements and traffic safety Drivers’ visual information acquisition and attention was realized by drivers’ scanning performance. A failure to scan the information of the roadway has been identified as a major causation of traffic crashes [31, 32]. Inefficient perceptual processing in the driving situation may be partly due to the lack of abilities of detecting objects in the traffic environment and general information acquisition and attention [33]. In this study, the experiment results showed that the drivers who scanned more times at the intersections attempted to collect more critical visual information about the presence of traffic in crossing lanes, and thus had a lower collision rate. It implies that the better scanning performance of drivers would enhance their crash avoidance abilities. The finding strengthens the previous evidence that drivers who had more scan times were more likely to detect and monitor potential hazard location [34]. In fact, a variety of sources have established a link between drivers’ scan patterns and attention. Underwood reported that drivers’ attention which was focused on the road straight ahead was detrimental for scanning and judging the neighboring traffic situation [34], which may increase the possibility of a driver being involved in a collision when encountering an abruptly appearing hazard. In this study, the experimental results indicated that when approaching the intersections, the drivers who focused more on the forward roadway and paid less attention to the conflict vehicle emerging area were more likely to have collisions. The finding is consistent with the previous conclusion that less allocations of visual attention to the potential hazardous areas impaired drivers’ observation of critical visual information and caused higher collision rates [35, 36]. It was reported that 78% of crashes contained at least one type of inattention
PLOS ONE | DOI:10.1371/journal.pone.0164101 October 7, 2016
15 / 22
Drivers’ Visual Performance during the Collision Avoidance Process
Table 5. Descriptive statistical results and ANOVA analysis results for AGD in different AOIs. AOI Right (s)
Count
Mean
S.D. a
Min
Max
F-ratio
P-value
IFOV1
23
0.855
0.366
0.378
1.761
1.550
0.221
IFOV2
20
0.776
0.412
0.136
1.622 2.156
0.147
7.615
0.001
5.384
0.024
0.391
0.681
0.135
0.717
6.836
0.002
1.264
0.265
0.130
0.878
0.969
0.329
Factors IFOV
Gender
IFOV3
23
1.077
0.819
0.520
4.291
Male
31
0.795
0.341
0.325
1.615
Female
35
1.008
0.723
0.136
4.291
66
0.908
0.582
0.136
4.291
IFOV1
23
1.956
1.450
0.217
4.431
IFOV2
20
0.890
0.684
0.112
3.134
Total Forward roadway (s)
IFOV
Gender
IFOV3
23
0.977
0.840
0.186
4.089
Male
31
1.606
1.268
0.490
4.431
Female
35
1.014
0.975
0.112
4.089
66
1.292
1.153
0.112
4.431
IFOV1
7
0.433
0.212
0.162
0.727
IFOV2
11
0.410
0.247
0.111
0.929
Total Left (s)
IFOV
Gender
IFOV3
10
0.517
0.260
0.162
0.905
Male
14
0.483
0.210
0.143
0.905
Female
14
0.425
0.271
0.111
0.929
28
0.454
0.240
0.111
0.929
IFOV1
23
1.418
0.750
0.415
2.492
IFOV2
20
0.787
0.363
0.116
1.650
Total Total (s)
IFOV
Gender
IFOV3
23
0.996
0.528
0.417
2.492
Male
31
1.165
0.636
0.551
2.492
Female
35
1.004
0.618
0.116
2.492
66
1.080
0.627
0.116
2.492
IFOV1
23
0.873
0.517
0.378
2.530
IFOV2
20
0.794
0.549
0.081
2.005
Total Conflict vehicle (s)
IFOV
Gender Total a
IFOV3
23
0.911
0.880
0.404
4.291
Male
31
0.772
0.436
0.259
2.005
Female
35
0.942
0.766
0.081
4.291
66
0.862
0.634
0.081
4.291
S.D. = standard deviation.
doi:10.1371/journal.pone.0164101.t005
[37], and inattention was also considered as one of the most fatal causes of road traffic accidents [15]. Additionally, this simulation study showed that drivers who had a faster visual search speed in terms of a shorter average gaze duration in the total AOIs (especially the forward roadway) were more likely to successfully avoid collisions. This finding is consistent with the results of visual search efficiency for driving safety in previous studies [38, 39]. Effect of IFOV conditions on eye movements Previous studies have confirmed that drivers tend to perform safety-related adaptations to deal with limited visual field, such as reducing speed to compensate [40, 41]. This study further explored the effects of IFOV conditions on drivers’ eye movements and visual attention on the particular AOI and the relationship between traffic safety and drivers’ eye movement. The limited IFOV would impede the drivers’ abilities to obtain visual information correctly and on time. It was found that as IFOV increased, the drivers paid less attention to gaze at the forward roadway, indicating that the drivers made more efforts to observe the critical potential risk information around the intersections. A longer gaze duration meant that drivers could
PLOS ONE | DOI:10.1371/journal.pone.0164101 October 7, 2016
16 / 22
Drivers’ Visual Performance during the Collision Avoidance Process
Fig 6. Mean AGD in different AOIs for different factors and CON results. (a) Mean AGD in different AOIs under different IFOV conditions. (b) Mean AGD in different AOIs for different genders. (c) Mean AGD in different AOIs for different CON results. doi:10.1371/journal.pone.0164101.g006
PLOS ONE | DOI:10.1371/journal.pone.0164101 October 7, 2016
17 / 22
Drivers’ Visual Performance during the Collision Avoidance Process
gain the most important visual information about target AOIs [42]. The results in this study prove that more critical visual information could be obtained at intersections through improving IFOV. Similar to the findings in UFOV research, the larger UFOV was effective in improving visual attention skills [43] and driver’s ability of visual information acquisition [44]. Moreover, there was an interesting finding that drivers scanned more frequently on the right side of intersection under the IFOV2 condition than the other two IFOV conditions. One reason might be that the drivers under the IFOV2 condition could not observe the conflict vehicle as clearly as the IFOV3 condition, but they could still observe the conflict vehicle earlier than the IFOV1 condition. Previous studies had shown that more scan times for a search task occurred when the area of interest was difficult to understand and the visual environment was more complex [45, 46]. Because the horizontal visibility in the IFOV2 condition was lower than IFOV3, drivers need to more frequently scan around the intersection for the critical visual information in the IFOV2 condition. Furthermore, although the most restrictive IFOV1 condition satisfied the current intersection design standards in AASHTO [5], it had the least number of gazes and the longest gaze duration, in which drivers had the slowest visual search speed in capturing intersection information and thus led to the highest collision rate. From the perspective of drivers’ visual performance during the crash avoidance, the findings support the conclusion that the larger IFOV should be encouraged in practical applications by removing any sight obstructions or broadening the non-signalized intersections to increase drivers’ horizontal visibility and reduce collision [6].
Effect of gender on eye movements As one of typical driver characteristics, gender is associated with driving performance and crash involvement [47–49]. A previous driving simulator study showed that gender is a significant factor influencing gap acceptance behavior at the intersection and male drivers tend to aggressively accept smaller gaps to merge into traffic than female drivers [50]. In this study, it was found that male drivers had a higher COR than female drivers, which was consistent with previous studies [33, 51]. The possible reason is that female drivers had less risky driving behaviors than male drivers [52, 53] and male drivers tend to be excessively optimistic on their driving skills and usually behave less cautiously than female drivers [54]. In this experiment, the visual search performance during the process of collision avoidance demonstrated that compared with male drivers, female drivers had better abilities to obtain visual information correctly and timely, as indicated by more visual attention and higher visual search frequency at intersections. Specifically, female drivers had more numbers of gazes and longer gaze duration on the conflict vehicle and the right side of intersection than male drivers, indicating that female drivers had a higher visual search frequency for the critical visual information than males in the emergent situation. Thus, it can be inferred from the differences in visual search patterns that female drivers are more careful about potential risk than male drivers.
Limitation of this study In this paper, the simulation results reflect drivers’ eye scanning activities and driving performance during emergent collision avoidance. However, it should be mentioned that for a simulator experiment, there are still some general limitations and validation considerations. After all, a simulator test is not driving in the real world and the participants knew that their driving errors would not affect their safety. However, from an ethical point, researchers could not put the participants in a real dangerous driving environment to examine their collision avoidance performance. Even though there might be differences between results observed in a field test
PLOS ONE | DOI:10.1371/journal.pone.0164101 October 7, 2016
18 / 22
Drivers’ Visual Performance during the Collision Avoidance Process
and simulated driving, numerous studies have proved that driving simulators provide an adequate representation of the real world and it is a proper tool to be used in driving performance studies [55–57]. In addition, since eye movements are assumed to represent a shift in visual attention, a further study is suggested to develop matrix models for interpreting and evaluating eye-movements to predict drivers’ intent and actions interactively. Thus, future vehicles technology development could consider equipping the vehicle with eye tracking devices for detecting drivers’ unsafe distractions through monitoring drivers’ fixation patterns.
Conclusions In summary, the experiment illustrated the effects of IFOV and gender on drivers’ eye movements during a collision avoidance process when approaching a non-signalized intersection. The findings identified the relationships between drivers’ eye movements, IFOV and crash risk at non-signalized intersection. In this study, better scanning performance was found to have positive effect on driving safety. During the process of emergent collision avoidance, drivers who scanned the intersection surroundings more frequently, paid more visual attention to the potential conflict and had a faster visual search speed were less likely to collide with the conflict vehicle. As the IFOV conditions improved, more critical visual information could be effectively captured by drivers, and thus they could brake earlier to avoid collision with the conflict vehicle, which resulted in a lower crash risk at intersections. Moreover, female drivers had a higher visual search frequency and paid more visual attention to the potential hazard, and also had a faster visual search speed in scanning the critical visual information than male drivers, which explained the finding that female drivers had a lower crash rate than male drivers. Additionally, compared with non-control intersections, the requirements of sight distance design, traffic rules, drivers’ visual search patterns, and intersection environments are different in yield/stop controlled and signalized intersections. The findings of this study may not be able to directly transfer into the other types of intersections. However, the research method can be applied in more scenarios to comprehensively establish the relationship between IFOV, drivers’ eye movement performance, driving behavior, and crash risk at intersections. Finally, the study results highlight that it is important to investigate how drivers’ eye movements vary as a function of IFOV conditions and suggest that it should be necessary to reconsider the adequacy of the current minimum intersection sight distance design standards.
Author Contributions Conceptualization: XDY XRZ. Data curation: XRZ YTZ XML. Formal analysis: XRZ XDY. Funding acquisition: XDY YTZ XML. Investigation: XRZ XDY YTZ XML. Methodology: XDY XRZ YTZ XML. Project administration: XDY. Resources: XDY. Software: XRZ ZY YTZ XML. Supervision: XDY YTZ XML.
PLOS ONE | DOI:10.1371/journal.pone.0164101 October 7, 2016
19 / 22
Drivers’ Visual Performance during the Collision Avoidance Process
Validation: XDY. Visualization: XRZ XDY YTZ XML. Writing – original draft: XDY XRZ. Writing – review & editing: XDY XRZ YTZ XML.
References 1.
Habibovic A, Davidsson J. Causation Mechanisms in Car-to-Vulnerable Road User Crashes: Implications for Active Safety Systems. Accident Analysis and Prevention. 2012; 49(6): 493–500. doi: 10. 1016/j.aap.2012.03.022 PMID: 23036427
2.
Staplin L, Harkey DL, Lococo KH, Tarawneh MS. Intersection Geometric Design and Operational Guidelines for Older Drivers and Pedestrians. Executive Summary. 1997;1.
3.
Harwood D, Mason J, Brydia R. Sight Distance for Stop-Controlled Intersections Based on Gap Acceptance. Transportation Research Part A. 2000; 7(1): 32–41. doi: 10.3141/1701-05
4.
Easa SM. Model for Sight-distance Analysis of Uncontrolled Intersections. Journal of Transportation Engineering. 1998; 124(2): 156–162. doi: 10.1061/(ASCE)0733-947X(1998)124:2(156)
5.
American Association of State Highway and Transportation Officials (AASHTO). A Policy on Geometric Design of Highways and Streets. Washington, DC. 2011.
6.
Yan X, Li X, He S, Weng JX, Wong SC, Hongtao Pang. Effects of intersection field of view on emergent collision avoidance performance at unsignalized intersections: analysis based on driving simulator experiments. Journal of Advanced Transportation. 2016. doi: 10.1002/atr.1369
7.
Robinson GH, Erickson DJ, Thurston GL, Clark RL. Visual Search by Automobile Drivers. Human Factors. 1972; 14(4): 315–323. PMID: 5054828
8.
Recarte MA, Nunes LM. Effects of verbal and spatial-imagery tasks on eye fixations while driving. Journal of Experimental Psychology. 2000; 6(1): 31. doi: 10.1037/1076-898X.6.1.31 PMID: 10937310
9.
Ball K, Owsley C, Sloane ME, Roenker DL, Bruni JR. Visual Attention Problems as a Predictor of Vehicle Crashes in Older Drivers. Investigative Ophthalmology and Visual Science. 1993; 34(11): 3110– 3123. PMID: 8407219
10.
Miura T. Visual Search in Intersections—an Underlying Mechanism. IATSS Research. 1992; 16(1): 42–50.
11.
Owsley C, Ball K, McGwin JrG, Sloane ME, Roenker DL, White MF, et al. Visual Processing Impairment and Risk of Motor Vehicle Crash among Older Adults. Jama. 1998; 279(14): 1083–1088. doi: 10.1001/jama.279.14.1083 PMID: 9546567
12.
Rumar K. The Basic Driver Error: Late Detection. Ergonomics. 1990; 33(10–11): 1281–1290. doi: 10. 1080/00140139008925332 PMID: 2286189
13.
Crundall D, Underwood G. Visual Attention while Driving. Handbook of Traffic Psychology. 2011;137.
14.
Treat JR, Tumbas NS, McDonald ST, Shinar D, Hume RD. Tri-level study of the causes of traffic accidents. Final report. Executive Summary; 1979 May. Report No.: DOT HS 805 099. Contract No.: DOTHS-034-3-535.
15.
Fell JC, Freedman M. The Relative Frequency of Unsafe Driving Acts in Serious Traffic Crashes. Proceedings of the 44th Annual Conference of the Association for the Advancement of Automotive Medicine; Illinois, USA. Chicago: 2000 October 2–4.
16.
Braitman KA, Kirley BB, Mccartt AT, Chaudhary NK. Crashes of Novice Teenage Drivers: Characteristics and Contributing Factors. Journal of Safety Research. 2008; 39(1): 47–54. doi: 10.1016/j.jsr.2007. 12.002 PMID: 18325416
17.
LandTransport. Road Safety issues: Transit New Zealand Wellington Region. 2005. Available: http:// www.ltsa.govt.nz/regions/2005/wellington/tnz-wellington-region.html.
18.
Guerrier JH., Manivannan P, Nair SN. The Role of Working Memory, Field Dependence, Visual Search, and Reaction Time in the Left Turn Performance of Older Female Drivers. Applied Ergonomics. 1999; 30(2): 109–119. doi: 10.1016/S0003-6870(98)00017-9 PMID: 10098804
19.
McGwin JrG, Brown DB. Characteristics of traffic crashes among young, middle-aged, and older drivers. Accident Analysis and Prevention. 1999; 31(3): 181–198. doi: 10.1016/S0001-4575(98)00061-X PMID: 10196595
20.
Caird JK, Edwards CJ, Creaser JI. Older Driver Failures of Attention at Intersections: Using Change Blindness Methods to Assess Turn Decision Accuracy. Human Factors: the Journal of the Human
PLOS ONE | DOI:10.1371/journal.pone.0164101 October 7, 2016
20 / 22
Drivers’ Visual Performance during the Collision Avoidance Process
Factors and Ergonomics Society. 2005; 47(2): 235–249. doi: 10.1518/0018720054679542 PMID: 16170936 21.
Novack TA, Baños JH, Alderson AL, Schneider JJ, Weed W, Blankenship J, et al. UFOV performance and driving ability following traumatic brain injury. Brain Injury. 2006; 20(5): 455–461. doi: 10.1080/ 02699050600664541 PMID: 16716991
22.
Green P. Where do Drivers Look While Driving (and for How Long). Human Factors in Traffic Safety. 2002.p. 77–110.
23.
Sivak M. The Information That Drivers Use: Is It Indeed 90% Visual. Perception. 1996; 25(9): 1081– 1089. doi: 10.1068/p251081 PMID: 8983048
24.
Houten RV, Retting RA. Increasing Motorist Compliance and Caution at Stop Signs. Applied Behavior Analysis. 2001; 34(2): 185–193. doi: 10.1901/jaba.2001.34-185 PMID: 11421311
25.
Scialfa CT, Thomas DM, Joffe KM. Age Differences in the Useful Field of View: an Eye Movement Analysis. Optometry and Vision Science. 1994; 71(12): 736–742. doi: 10.1097/00006324-19941200000003 PMID: 7898880
26.
Rogers SD, Kadar EE, Costall A. Gaze Patterns in the Visual Control of Straight-road Driving and Braking as a Function of Speed and Expertise. Ecological Psychology. 2005; 19: 19–38. doi: 10.1207/ s15326969eco1701_2
27.
Velichkovsky BM, Rothert A, Miniotas D, Dornhofer SM, Joos M, Pannasch S. Visual fixations as a rapid indicator of hazard perception. NATO SCIENCE SERIES SUB SERIES I LIFE AND BEHAVIOURAL SCIENCES. 2003; 355: 313–322.
28.
Crundall D, Underwood G. Effects of experience and processing demands on visual information acquisition in drivers. Ergonomics. 1998; 41(4): 448–458. doi: 10.1080/001401398186937
29.
Konstantopoulos P, Chapman P, Crundall D. Driver’s Visual Attention as a Function of Driving Experience and Visibility. Using a Driving Simulator to Explore Drivers’ Eye Movements in Day, Night and Rain driving. Accident Analysis and Prevention. 2010; 42(3): 827–834. doi: 10.1016/j.aap.2009.09.022 PMID: 20380909
30.
Prasetijo J. Capacity and traffic performance of unsignalized intersection under mixed traffic condition. Ph. D Thesis, Ruhr-University Bochum, 2007.
31.
Hills BL. Vision, Visibility, and Perception in Driving. Perception. 1980; 9(2):183–216. doi: 10.1068/ p090183 PMID: 7375327
32.
McKnight AJ, McKnight AS. Young Novice Drivers: Careless or Clueless. Accident Analysis and Prevention. 2003; 35(6): 921–925. doi: 10.1016/S0001-4575(02)00100-8 PMID: 12971927
33.
Elander J, West R, French D. Behavioral Correlates of Individual Differences in Road-Traffic Crash Risk: an Examination Method and Findings. Psychological Bulletin. 1993; 113(2): 279–294. doi: 10. 1037/0033-2909.113.2.279 PMID: 8451335
34.
Underwood G. Visual Attention and the Transition from Novice to Advanced Driver. Ergonomics. 2007; 50(8): 1235–1249. doi: 10.1080/00140130701318707 PMID: 17558667
35.
Strayer DL, Drews FA, Johnston WA. Cell Phone-induced Failures of Visual Attention during Simulated Driving. Journal of Experimental Psychology Applied. 2003; 9(1): 23–32. doi: 10.1037/1076-898X.9.1. 23 PMID: 12710835
36.
Pradhan AK, Pollatsek A, Fisher MKDL. Can younger drivers be trained to scan for information that will reduce their risk in roadway traffic scenarios that are hard to identify as hazardous. Ergonomics. 2009; 52(6): 657–673. doi: 10.1080/00140130802550232 PMID: 19296315
37.
Klauer SG, Dingus TA, Neale VL, Sudweeks JD, Ramsey DJ. The Impact of Driver Inattention on Near-Crash/Crash Risk: An Analysis Using the 100-Car Naturalistic Driving Study Data. U.s.department of Transportation Washington D.C. 2006.
38.
Shinar D, McDowell ED, Rackoff NJ, Rockwell TH. Field dependence and driver visual search behavior. Human Factors: the Journal of the Human Factors and Ergonomics Society. 1978; 20(5): 553–559. doi: 10.1177/001872087802000505 PMID: 721096
39.
Shinar D, Schieber F. Visual Requirements for Safety and Mobility of Older Drivers. Human Factors: the Journal of the Human Factors and Ergonomics Society. 1991; 33(5): 507–519. PMID: 1769671
40.
Ni R, Kang JJ, Andersen GJ. Age-related Declines in Car Following Performance under Simulated Fog Conditions. Accident Analysis and Prevention. 2010; 42: 818–826. doi: 10.1016/j.aap.2009.04.023 PMID: 20380908
41.
Broughton KLM, Switzer F, Scott D. Car Following Decisions under Three Visibility Conditions and Two Speeds Tested with a Driving Simulator. Accident Analysis and Prevention. 2007; 39: 106–116. doi: 10.1016/j.aap.2006.06.009 PMID: 16962059
PLOS ONE | DOI:10.1371/journal.pone.0164101 October 7, 2016
21 / 22
Drivers’ Visual Performance during the Collision Avoidance Process
42.
Najemnik J, Geisler WS. Optimal eye movement strategies in visual search. American Journal of Ophthalmology. 2005; 434 (7031): 387–391. doi: 10.1038/nature03390 PMID: 15772663
43.
Mazer BL, Sofer S, Kornerbitensky N, Gelinas I. Use of the UFOV to Evaluate and Retrain Visual Attention Skills in Clients with Stroke: a Pilot Study. American Journal of Occupational Therapy. 2001; 55(5): 552–557. doi: 10.5014/ajot.55.5.552 PMID: 14601816
44.
Pe´ruch P, May M, Wartenberg F. Homing in Virtual Environments: Effects of Field of View and Path Layout. Perception. 1997; 26 (3): 301–311. doi: 10.1068/p260301 PMID: 9282227
45.
Berlyne DE. Curiosity and exploration. Science. 1966; 153(3731): 25–33. doi: 10.1126/science.153. 3731.25 PMID: 5328120
46.
Olmsted-Hawala E, Beck J, Murphy E, Ashenfelter K. Usability Evaluation of the Business and Industry Web Site. Survey Methodology. 2009;15.
47.
Turner C, McClure R. Age and gender differences in risk-taking behavior as an explanation for high incidence of motor vehicle crashes as a driver in young males. Injury Control and Safety Promotion. 2003; 10(3): 123–130. doi: 10.1076/icsp.10.3.123.14560 PMID: 12861910
48.
Bener A. 650 –The psychological distress and aggressive driving: age and gender differences in voluntary risk-taking behavior in road traffic crashes. European Psychiatry. 2013; 28: 1. doi: 10.1016/ S0924-9338(13)75901-7
49.
Obst P, Armstrong K, Smith S, Banks T. Age and gender comparisons of driving while sleepy: Behaviors and risk perceptions. Transportation Research Part F. 2011; 14(6): 539–542. doi: 10.1016/j.trf. 2011.06.005
50.
Yan X, Radwan E, Guo D. Effects of major-road vehicle speed and driver age and gender on left-turn gap acceptance. Accident Analysis and Prevention. 2007; 39(4): 843–852. doi: 10.1016/j.aap.2006. 12.006 PMID: 17239808
51.
Li G, Baker SP, Langlois JA, Kelen GD. Are Female Drivers Safer? An Application of the Decomposition Method. Epidemiology. 1998; 9(4): 379–384. doi: 10.1097/00001648-199807000-00006 PMID: 9647900 ¨ zkan T, Lajunen T. What causes the differences in driving between young men and women? The O effects of gender roles and sex on young drivers’ driving behaviour and self-assessment of skills. Transportation Research Part F. 2006; 9(4): 269–277.
52.
53.
Holland C, Geraghty J, Shah K. Differential moderating effect of locus of control on effect of driving experience in young male and female drivers. Personality and Individual Differences. 2010; 48(7): 821–826. doi: 10.1016/j.paid.2010.02.003
54.
DeJoy DM. An examination of gender differences in traffic accident risk perception. Accident Analysis and Prevention. 1992; 24(3): 237–246. doi: 10.1016/0001-4575(92)90003-2 PMID: 1605809
55.
Pradhan AK, Hammel KR, DeRamus R, Pollatsek A, Noyce DA, Fisher DL. Using eye movements to evaluate effects of driver age on risk perception in a driving simulator. Human Factors: the Journal of the Human Factors and Ergonomics Society. 2005; 47(4): 840–852. doi: 10.1518/ 001872005775570961 PMID: 16553070
56.
Lee HC, Cameron D, Lee AH. Assessing the driving performance of older adults drivers: on-road versus simulated driving. Accident Analysis and Prevention. 2003; 35(5): 797–803. doi: 10.1016/S00014575(02)00083-0 PMID: 12850081
57.
Coeckelbergh TR, Brouwer WH, Cornelissen FW, Van WP, Kooijman AC. The effect of visual field defects on driving performance: a driving simulator study. Journal of Economic History. 2002; 120(11): 1509–1516. doi: 10.1001/archopht.120.11.1509 PMID: 12427065
PLOS ONE | DOI:10.1371/journal.pone.0164101 October 7, 2016
22 / 22