RADIATION RESEARCH
161, 495–503 (2004)
0033-7587/04 $15.00 q 2004 by Radiation Research Society. All rights of reproduction in any form reserved.
Changes in Gene Expression Associated with Stable Drug and Radiation Resistance in Small Cell Lung Cancer Cells are Similar to those Caused by a Single X-Ray Dose Sheridan Henness,a Mary W. Davey,b Rozelle M. Harvie,a Joanne Banyer,c Valerie Wasinger,d Garry Corthalsd and Ross A. Daveya,1 a
Bill Walsh Cancer Research Laboratories, Royal North Shore Hospital, St Leonards 2065, Australia; b Cell and Molecular Biology Department, University of Technology, Sydney, Gore Hill 2065, Australia; c John Curtin School of Medical Research, Australian National University, Canberra 2601, Australia; and d Garvan Institute for Medical Research, Darlinghurst 2010, Australia
90% of patients show a good response to treatment, this response is rarely sustained, with more than 90% dying within 5 years with SCLC that is resistant to both chemotherapy and radiotherapy (1). An understanding of how SCLC cells initially respond to chemotherapy and radiotherapy and how this response leads to stable resistance is necessary for the development of new treatment strategies to combat this resistance. Cellular models have been used to elucidate the resistance mechanisms involved in SCLC; however, these have mainly been studies of chemotherapy and the development of drug resistance, and less is known about the response to radiotherapy. SCLC cells treated with cisplatin often become resistant by altering their glutathione metabolism and by reducing cisplatin accumulation (2–4), while anthracycline treatment usually causes increased expression of multidrug resistance-associated protein (MRP1) (3, 5, 6) and/ or decreased expression of topoisomerase II (3, 7) and etoposide usually causes resistance through decreased expression of topoisomerase II (2, 8). The development of resistance in SCLC cells in response to drug treatment has also been associated with changes in expression of BCL2 (9, 10) and TP53 (11). There have been few reports on the radiation response of SCLC cells. We have reported that fractionated X-ray treatment alone can produce increased radiation and drug resistance in SCLC cells (12). In this example the H69/R38 subline was obtained by treating cells of the H69 human SCLC cell line with 37.5 Gy of fractionated X rays over an 8-month period. The H69/R38 cells had a growth rate similar to that of the H69 cells and were resistant to X rays as well as to the chemotherapeutic drugs cisplatin, daunorubicin, etoposide, gemcitabine and Navelbine. This resistance phenotype was stable in the absence of any further treatment and was associated with decreased expression of BCL2 and glutathione-S-transferase-p and increased expression of MRP1, multidrug resistance-associated protein 2 (MRP2), N-myc and topoisomerase-IIa (12).
Henness, S., Davey, M. W., Harvie, R. M., Banyer, J., Wasinger, V., Corthals, G. and Davey, R. A. Changes in Gene Expression Associated with Stable Drug and Radiation Resistance in Small Cell Lung Cancer Cells are Similar to those Caused by a Single X-Ray Dose. Radiat. Res. 161, 495–503 (2004). Small cell lung cancer (SCLC) initially responds well to chemotherapy and fractionated radiotherapy, but resistance to these treatments eventually develops in the vast majority of cases. To understand how resistance develops in the H69 SCLC cell line, we compared the changes in gene expression associated with 37.5 Gy fractionated X-ray treatment that produced the stable radiation- and drug-resistant H69/R38 cell subline to the changes associated with a single 4- or 8-Gy X-ray treatment. Gene expression was determined by suppression subtractive hybridization combined with Northern blot analysis and two-dimensional (2D) protein electrophoresis. Stable radiation and drug resistance was associated with coordinate changes in the expression of genes of the cytoskeleton, protein synthesis, cell cycle, redox/stress and metabolic pathways. The pattern of these changes was remarkably similar to the changes seen 24 h after a single X-ray treatment of the H69 cells but differed from the changes in expression associated with a single X-ray treatment of the resistant H69/ R38 cells. Stable radiation and drug resistance may be caused by the constitutive expression of those genes transiently expressed by sensitive cells in response to a single X-ray dose. The repeated treatments received during fractionated irradiation may promote the change from a transient to a constitutive pattern of gene expression. q 2004 by Radiation Research Society
INTRODUCTION
Small cell lung cancer (SCLC) is commonly treated with chemotherapy containing cisplatin, etoposide and often an anthracycline, in combination with radiotherapy. Although 1 Address for correspondence: Bill Walsh Cancer Research Laboratories, Royal North Shore Hospital, St Leonards 2065, Australia; e-mail:
[email protected].
495
496
HENNESS ET AL.
TABLE 1 Genes with Altered Expression in the H69/R38 Cells Relative to the H69 Cells Accession number
Clone/spot numbera
Change in H69/R38b
Cytoskeleton a-actin b-actin g-actin actin actin b-tropomycin thymosin b4 thymosin b4 cofilin laminin receptor
J00068 X003551 X04098 P02570 P04829 M12126 M17733 M17733 P23528 M14199
m1 m2 m3 P1 P2 m4 m5 m6 P3 m7
No changec Decrease Increase Decrease Decrease Decrease Increase Increase Decrease Decrease
Protein synthesis ribosomal protein L17/L23 ribosomal protein L39 ribosomal protein L18 ribosomal protein S15 ribosomal protein S16 ribosomal protein S16 12S ribosomal RNA translational elongation factor 1a proteosome component poly-A binding protein histone 2A histone 2A spermine synthase snRNP polypeptide F hnRNP E2 calreticulin
X52839 D79205 L11566 BC000085 BC007977 BC007977 AY012136 BC002845 BC005265 Y00345 P02261 P27891 Z49099 BC002505 BC001155 P27797
m8 m9 m10 m11 m12 m13 m14 m15 m16 m17 P4 P5 m18 m19 m20 P6
No change Decrease Decrease Decrease Increase Decrease Decrease Increase Decrease Decrease Increase Increase Decrease Decrease Increase No change
Cell cycle Ki67 CDC-like kinase 2 CDC-like kinase 2
X65551 BC006274 BC006274
m21 m22 m23
Decrease Decrease Decrease
Redox/stress thioredoxin peroxidase 2 thioredoxin peroxidase 1 heat-shock protein 27 heat-shock protein 70 heat-shock protein 70 glutathione-S-transferase
Q06830 L19185 P04792 P38646 P38646 P09211
P7 m24 P8 P9 P10 P11
Increase Increase No change Decrease Increase Decrease
Cellular metabolism enolase enolase enolase triose phosphate isomerase triose phosphate isomerase amino acid transporter creatine kinase creatine kinase
P06733 P06733 P06733 P00938 P00938 AF271070 M14780 M14780
P12 P13 P14 P15 P16 m25 m26 m27
Increase Decrease No change No change Increase Increase No change No change
Energy metabolism ATP synthase 8 ATP synthase 8 cytochrome oxidase subunit cytochrome oxidase subunit cytochrome oxidase subunit cytochrome oxidase subunit cytochrome reductase
X62996 X62996 AF035429 ACU12691 ACU12691 ACU12691 L16842
m28 m29 m30 m31 m32 m33 m34
Increase Increase Increase Increase Increase Increase Increase
Identity
1 2 2 2
(Continued on page 497)
497
RADIATION RESISTANCE IN SCLC CELLS
TABLE 1 Continued Identity
Accession number
Clone/spot numbera
Change in H69/R38b
Miscellaneous guanine nucleotide-binding protein b aspartylglucosylaminidase 14-3-3« H19 Rig PEG1/MEST DC24 migration inhibitory factor
P04901 S77771 U54778 M32053 J02984 Y11534 AF253979 P14174
P17 m35 m36 m37 m38 m39 m40 P18
Increase No change Increase Decrease Decrease No change Decrease Increase
m assigned clone number, P assigned protein spot number. Change in expression detected by dot blot or Northern blot assays or by PDQuest as described in the Materials and Methods. c No change refers to genes whose changes were not confirmed by Northern blot assay or proteins that were identified to have changed after radiation treatment but were not changed in the H69/R38 cells relative to the H69 cells. a b
The H69/R38 cell line therefore provides one of the few cell models of drug- and radiation-resistant SCLC. We have used this model to further investigate the relationship between the stable radiation and drug resistance of the H69/ R38 cells and the acute cellular response to radiation treatment. We report here the use of suppression subtractive hybridization (13) to identify genes differentially expressed in the resistant H69/R38 cells compared to the H69 cells, and the use of Northern blotting to analyze the mRNA expression levels of these genes. Two-dimensional protein electrophoresis was also used to identify changes in protein expression. Both Northern blotting and 2D protein electrophoresis were used to identify changes associated with a single X-ray treatment, and these changes were compared to those associated with stable resistance. MATERIALS AND METHODS Cell Culture The H69 SCLC cells were obtained from the ATCC (Rockville, MD), and the H69/R38 cell line was developed by treating H69 cells with a total dose of 37.5 Gy of fractionated X rays over an 8-month period as described previously (12). All cells were grown as suspension cultures at 378C in a humidified 95% air 5% CO2 atmosphere in RPMI 1640 medium (Invitrogen, Sydney, Australia) that contained 10% fetal bovine serum, 20 mM Hepes and 10 mM NaHCO3. All cultures were free of Mycoplasma. Exponentially growing cells were used for all experiments. X Irradiation of Cells Flasks of H69 and H69/R38 cells at a density of 5 3 105 cells per ml were incubated in a 378C Perspex water bath and irradiated with 4 or 8 Gy of X rays delivered as two half doses from each side of the flask using a 6 MV X-ray linear accelerator treatment machine. Cells were then cultured for a further 24 h before RNA or protein extraction. Subtractive Hybridization and Northern Analysis Total RNA was extracted from the H69 and H69/R38 cells by a guanidine thiocyanate (GTC)/phenol/chloroform method (14) and mRNA
was isolated using the QuickPrep micro mRNA purification kit (Amersham Biosciences, Sydney, Australia) according to the manufacturer’s instructions. Subtractive hybridization was performed in both directions to detect increased and decreased expression in the H69/R38 cells relative to the H69 cells using the PCR-Select cDNA subtraction kit and PCRSelect differential screening kit (Clontech, Palo Alto, CA) according to the manufacturer’s instructions. Libraries were made by ligation into pAmp10 vector using the cloneAmp pAmp10 system (Invitrogen, Melbourne, Australia). The subtracted libraries were dot blotted and analyzed using the forward and reverse reaction products as probes, and 40 clones (designated m1 to m40) that were differentially expressed were purified for identification (Concert Plasmid Purification Kit, Invitrogen). These were sequenced commercially (SUPAMAC, Sydney, Australia) and identified by Blast searching the GenBank non-redundant vertebrate database and/or EST database. Probes were made from EcoRI/XbaI digests of plasmids containing inserts which were purified from the agarose using a gel extraction kit (Qiagen, Sydney, Australia). Each insert was labeled using a 32P-dCTP random primed DNA labeling kit (Roche, Sydney, Australia) and used in the Northern blot analysis of expression (15) using total RNA isolated separately from that used for the subtraction. The expression was normalized to 28S RNA. Protein Extraction and 2D Protein Electrophoresis/Mass Spectrometry Cells (5 3 106) were pelleted and washed in 3 mM KCl, 1.5 mM KH2PO4, 68 mM NaCl, and 9 mM NaH2PO4 by centrifugation and a total protein extract was prepared from the pelleted cells using 0.3% sodium dodecyl sulfate (SDS), 0.05 M Tris, pH 8.0, 1% mercaptoethanol as described previously (16). The resulting protein pellet was dissolved in 300 ml 8 M urea, 2% 3-[(3-cholamidopropyl)dimethylammonio]-1-propanesulfate (CHAPS), and 10 mM dithiothreitol (DTT) and the protein content determined by the Coomassiet Plus protein assay reagent kit (Pierce, Rockford IL). Isoelectric focusing (40–50 KVh) of samples containing 130 mg protein was performed using the IPG 18-cm pH 3–10 strips (Amersham Biosciences, Sydney Australia) according to the manufacturer’s instructions. The focused strips were incubated in 2% DTT, 50 mM Tris-HCl, 6 M urea, 30% glycerol and 2% SDS for 10 min, then in 2.5% iodoacetamide, 50 mM Tris-HCl, 6 M urea, 30% glycerol and 2% SDS for 10 min before the 2D electrophoresis was performed on a 12.5% acrylamide gel at 150 V for 12.5 h. Proteins were detected by silver staining, the gels were scanned using a Microtek Scanmaker III and analyzed manually or using PDQuest software (BioRad), and spots of interest were assigned a number, P1–P43. Protein extracts from three independent experiments were analyzed for differences between the H69
498
HENNESS ET AL.
and H69/R38 cells while protein extracts from two independent experiments were analyzed for the differences associated with a single radiation dose. The stained spots of differentially expressed proteins selected for sequence identification were excised from the gel and digested with trypsin (Promega, Sydney, Australia) for 15 h at 378C, and the peptides were extracted (17) and concentrated. The amino acid sequences were deter˚, mined as described previously (18) using a microcapillary C18 200-A 8-cm (Michrom BioResources) reverse-phase column coupled to a TSQ7000 Tandem mass spectrometer (Thermofinnigan).
RESULTS
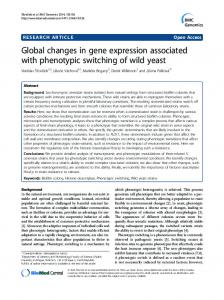
Identification by Subtractive Hybridization of Genes Differentially Expressed in the H69 and H69/R38 Cells A total of 33 genes were identified (Table 1). Of these, thymosin b4, ribosomal protein S16, CDC-like kinase 2, creatine kinase, ATP synthase 8, and cytochrome C oxidase subunit 1 were represented by two or more clones. The majority of genes were associated with protein synthesis, metabolic pathways and components of the cytoskeleton and redox/stress. Analysis of Expression by Northern Blotting The H69 and H69/R38 cells were treated with a single dose of 4 or 8 Gy of X rays and cultured for 24 h along with the nonirradiated cells before the expression levels of the genes in Table 1 were determined by Northern blotting (Fig. 1). This time was chosen because there was little or no cell death determined microscopically, it was approximately the time of a cell cycle, and it allowed for sufficient protein turnover. The majority of genes gave a single major band on the Northern blot of approximately the expected size except for RIG (m38), which gave two bands (1.1 and 0.6 kb), and a-actin (m1), which gave two bands (2.5 and 1.4 kb). For these genes, only the band closest to the expected size was quantified. Six of the 33 genes identified by subtractive cloning were shown to have similar levels of expression in the H69 and H69/R38 cells by Northern blot analysis and these are listed in Table 1 with ‘‘No change’’. The quantification of expression levels is presented in Fig. 2 with the genes arranged in order from greatest increase to greatest decrease in the H69/R38 cells relative to the H69 cells (Fig. 2a). The pattern of change in expression associated with stable resistance in the H69/ R38 cells was clearly similar to the change induced in the H69 cells by 4 Gy (Fig. 2b) and 8 Gy X rays (Fig. 2c). This was particularly true for the genes with decreased expression. In contrast, treatment of the H69/R38 cells with either 4 or 8 Gy X rays produced changes in expression very different from those for the H69 cells (Fig. 2d, e). Two examples of this difference are the poly A binding protein (m17) and the CDC-like kinase 2 (m23), which, in response to radiation treatment, showed the greatest decrease in the H69 cells and the greatest increase in the H69/ R38 cells.
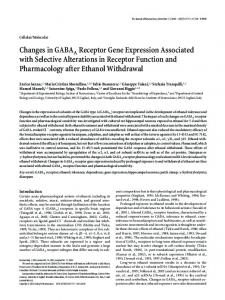
Analysis of Expression by 2D Protein Electrophoresis Whole cell protein extracts were prepared from the H69 and H69/R38 cells 24 h after 4 Gy X rays and from untreated cells, and these were separated by 2D protein electrophoresis (Fig. 3). The spots for sequencing were selected either visually or by PDQuest analysis as changed between the H69 and H69/R38 cells or changed in response to a single treatment with X rays. These are labeled with their designated spot numbers in Fig. 3; the spot numbers and identities are listed in Table 1. Four spots selected manually for sequencing because of altered expression in either the H69 or H69/R38 cells after X-ray treatment showed similar levels of expression in the H69 and H69/R38 cells and are listed in Table 1 with ‘‘No change’’. The PDQuest analysis identified 29 spots, the intensity of which was altered twofold or greater between the H69 and the H69/R38 cells. As in Fig. 2, these changes were arranged in order from greatest increase to greatest decrease in expression in the H69/R38 cells relative to the H69 cells (Fig. 4a). The changes in expression in the H69 cells after treatment with 4 Gy X rays (Fig. 4b) were similar to those associated with stable resistance in the H69/R38 cells (Fig. 4a). Those proteins with increased expression in the H69/ R38 cells were also increased in the H69 cells after X-ray treatment with the exception of spots P34 (unidentified) and P16 (triose phosphate isomerase) while all proteins with decreased expression in the H69/R38 cells were also decreased in the irradiated H69 cells. However, the response to X-ray treatment was very different for the H69/R38 cells (Fig. 4c), which showed not only less of an overall change in expression but also a trend to change in the opposite direction to that of the irradiated H69 cells (Fig. 4b). Spot P9 was decreased in the H69/R38 cells relative to the H69 cells while spot P10 was increased (Table 1). Both these spots were identified by mass spectrometry sequencing as heat-shock protein 70 (HSP70). This is consistent with altered post-translational modification rather than altered expression of HSP70. Similarly, enolase appears to show changed post-translational modification with the enolase spot P12 increased, spot P13 decreased, and spot P14 unchanged (Table 1). DISCUSSION
Most reports on development of drug resistance identify one or a few mechanisms by which cells become resistant. Use of subtractive hybridization and 2D protein electrophoresis allows for a more extensive view of the many cellular changes associated with the development of resistance. The stable resistance of the H69/R38 cells was associated with coordinate changes in expression of genes that are part of the cytoskeleton, protein synthesis, cell cycle, redox/stress pathways and metabolic pathways (Table 1). In the H69/R38 cells (compared to the H69 cells), there was a general down-regulation of expression of genes as-
RADIATION RESISTANCE IN SCLC CELLS
499
FIG. 1. Gene expression determined by Northern blotting in the H69 and H69/R38 cells and the effect of X-ray treatment. Radiolabeled cDNA probes for each of the genes identified as being differentially expressed by subtractive hybridization were generated by random priming using the cloned fragments as templates. These were then used in Northern blot analysis of the H69 and H69/R38 cells 24 h after treatment with 0, 4 or 8 Gy of X rays and normalized against 28S RNA. The assigned clone numbers are presented and their identities are listed in Table 1.
500
HENNESS ET AL.
FIG. 2. The pattern of change in gene expression associated with stable resistance and with a single dose of X rays as detected by Northern blotting. The changes in gene expression in H69/R38 cells relative to the H69 cells (Fig. 1) were ordered from the greatest increase to the greatest decrease and plotted (panel A). Using the same gene order, the changes in gene expression were plotted for the H69 cells treated with 4 Gy (panel B) and 8 Gy (panel C) X rays and the H69/R38 cells treated with 4 Gy (panel D) and 8 Gy (panel E) X rays. Changes greater than or less than threefold are plotted as 1 or 2 3-fold, respectively.
sociated with the cytoskeleton (five decreased, two increased), protein synthesis (eight decreased, three increased), and cell cycle (two decreased, none increased). However, this general decrease in cellular activity was not accompanied by a decrease in expression of the genes associated with metabolic activity, but rather expression of these was generally increased (one decreased, seven increased). This may indicate that the metabolic activity is no longer responding to the decreased demands of cellular activity, thus increasing the flexibility of the H69/R38 cells to respond to treatment or stress. This is supported by a recent report suggesting that metabolic changes provide the basis for survival of resistant cells (19). Although there are no reports of similar studies involving SCLC cells, there is a report in which suppression subtractive hybridization was used to show that, relative to the H69 cells representative of the classic form of SCLC, the variant form of SCLC represented by the N417 cell line, had increased enolase and glutathione-S-transferase expression and increased expression of several ribosomal proteins (20). Since we found the expression of these classes of genes to be generally decreased in the H69/R38 cells, it suggests that this stable drug and radiation resistance probably is not caused by de-differentiation toward the variant form of SCLC, which is associated with a more aggressive and less responsive phenotype. The pattern of change in gene expression associated with the stable resistance of the H69/R38 cells relative to the H69 cells was similar to that induced in the H69 cells with a single dose of X rays. This was a consistent finding since those genes detected by subtractive hybridization/Northern blotting (Fig. 2a compared to Fig. 2b and c) and by 2D protein electrophoresis (Fig. 4a compared to Fig. 4b) both showed this similarity. The possibility this was the result of selecting a subpopulation of the H69 cells was excluded because microscopic examination showed there was little or no cell death of the H69 cells 24 h after the 4- or 8-Gy X-ray treatment, which was when gene expression was analyzed. Treatment of the H69 cells with a cycle of 3.5 Gy (five daily 0.75-Gy treatments) of fractionated X rays during the development of the H69/R38 cells did not produce detectable radiation or drug resistance. Signs of resistance were detected only after seven cycles (12). This suggests that the changes in gene expression induced in the H69 cells by 4 Gy X rays were probably transient and were not associated with resistance. The fact that these changes were similar to those associated with the stable resistance of the H69/R38 cells suggests the development of stable resistance may involve a conditioning process whereby the induced temporary responses to radiation become constitutively expressed as a result of the repeated treatments with fractionated radiation. Although this is highly speculative, it does warrant further consideration. We do not know what factor or factors in this fractionated treatment regimen promoted the switch to stable resistance. It could be accumulated dose, dose rate,
RADIATION RESISTANCE IN SCLC CELLS
501
FIG. 3. Gene expression determined by 2D protein electrophoresis of protein extracts from H69 and H69/R38 cells and the effect of X-ray treatment. Total protein extracts were prepared from the H69 and H69/R38 cells 24 h after treatment with 0 or 4 Gy of X rays, separated by 2D protein electrophoresis, silver stained, and quantified as described in the Materials and Methods. Spot identification numbers are shown for those proteins that were removed and digested with trypsin and the sequence identified (Table 1) by mass spectrometry.
frequency of treatment within a cycle, or the timing of cycles. There is clinical evidence that for SCLC, twice daily is better than daily fractionated radiotherapy (1), but it is difficult to determine whether this advantage was because of increased efficacy in the short term or because of delaying the development of resistance. There is a need to investigate the roles of these factors in the development of stable resistance. Actin was the only gene detected by both the subtractive/ Northern blotting method and 2D protein electrophoresis/ mass spectrometry (Table 1). This suggests that each method has a different inherent bias, part of which could be due to mRNA expression preceding protein expression. Proteinbased and mRNA-based methods of detection should therefore be combined to provide a more complete view of gene expression since either strategy alone is liable to miss valuable expression information. Two-dimensional protein electrophoresis also provides information on changes in post-
translational modification of proteins such as those detected for HSP70 and enolase (Table 1). The fact that these methods detected different sets of genes but both methods showed the same conservation of changed expression in the X-ray-treated H69 cells and in the stably resistant H69/R38 cells adds weight to the biological importance of this conservation. It is worth noting that many of these conserved changes were twofold or less in magnitude, suggesting that subtle changes may be important in the cellular response to radiation and the development of stable resistance. The previous study reported that, relative to the H69 cells, the H69/R38 cells had increased levels of MRP1, MRP2, topoisomerase IIa and N-myc and decreased levels of glutathione-S-transferase p and BCL2 (12). The present study would predict similar changes in expression to occur in the H69 cells after treatment with 4 Gy of X rays. However, in the previous study, topoisomerase IIa showed the predicted change, MRP1, N-myc, BCL2 and glutathione-S-
502
HENNESS ET AL.
FIG. 4. The pattern of change in gene expression associated with stable resistance and with a single dose of X rays as detected by 2D protein electrophoresis. A set of 29 protein spots identified by analysis using the PDQuest program as being differentially expressed in the H69/R38 cells were ordered from the greatest increase to the greatest decrease and plotted (panel A). Using the same gene order, the changes in gene expression were plotted for the H69 cells treated with 4 Gy of X rays (panel B) and the H69/R38 cells treated with 4 Gy X rays (panel C). Changes greater than or less than sevenfold are plotted as 1 or 2 7-fold, respectively.
transferase p showed no change and the change in MRP2 was opposite of that predicted (12). For the four genes that showed no change, it is difficult to determine whether they did or did not fit the prediction since their expression levels were determined by Western blotting, which is a relatively insensitive way of detecting change compared to the Northern blotting and silver staining methods used in this study. MRP2 may be one of those few genes that do not show the predicted changes in expression (Figs. 2, 4). It is difficult to determine the relative contribution of each gene to the stable resistance phenotype of the H69/ R38 cells and to the response to radiation in the H69 cells.
There are several genes that have previously been associated with resistance. Glutathione-S-transferase p is commonly increased in SCLC cells resistant to chemotherapeutic drugs (4, 21). However, glutathione-S-transferase (P11) expression was decreased in the H69/R38 cells and this is consistent with our previously reported Western blotting results for glutathione-S-transferase p in the H69/R38 cells (12) in which we speculated that radiation may affect glutathione-associated processes differently from drug treatment. Thioredoxin peroxidase I (m24) and thioredoxin peroxidase II (P7) were increased in the H69/R38 cells. This is consistent with their role in protecting against oxidative stress. Changes in thioredoxin peroxidases have not previously been associated with drug or radiation resistance in SCLC. However, thioredoxin peroxidase II is increased in the A549 non-small cell lung cancer cell line compared to the BEAS 2B human lung epithelial cell line (22), and both thioredoxin peroxidases are overexpressed in cell lines derived from malignant mesothelioma, a malignancy that is very resistant to both drugs and radiation (23). It is therefore likely that thioredoxin peroxidases may be involved in the resistance to chemotherapeutic drugs and to radiation in lung cancer in general. There was an obvious difference in the response to radiation treatment between the H69 cells and the H69/R38 cells, as shown by the changes in gene expression (Fig. 2b and c compared to Fig. 2d and e; Fig. 4b compared to 4c) confirming previous findings (12). There are many examples of genes whose changes in expression in response to radiation are in opposite directions in the H69 and H69/ R38 cells. Spots P3 and P39 are increased in the H69/R38 cells but decreased in the H69 cells. Similarly, clones m23, which is CDC-like kinase 2, and m17, which is poly-A binding protein, were increased in the H69/R38 cells but decreased in the H69 cells after radiation treatment. These changes in the CDC-like kinase 2 and poly-A binding protein may reflect a difference in the degree of radiationinduced G0/G1-phase cell cycle arrest between the H69 and H69/R38 cells. We have shown that a single dose of X rays produces a pattern of change in gene expression similar to that associated with stable resistance to radiotherapy and chemotherapy. If our speculation is correct and the repeated dosing associated with fractionated radiation promotes the development of drug and radiation resistance, then the treatment advantage associated with dose fractionation may have to be balanced against the increased chance of developing resistance. It will be important to determine which components of fractionated radiation promote the development of radiation and drug resistance. ACKNOWLEDGMENTS We thank Veronica Stevens for her technical help and Regina Bromley and Philip Vial for their expertise in irradiating cell cultures. This research was made possible by a research grant from the Dust Diseases Board, NSW, Australia.
RADIATION RESISTANCE IN SCLC CELLS
Received: October 13, 2003; accepted: December 18, 2003
REFERENCES 1. A. T. Turrisi and C. A. Sherman, The treatment of limited small cell lung cancer: A report of the progress made and future prospects. Eur. J. Cancer 38, 279–291 (2002). 2. N. Jain, Y. M. Lam, J. Pym and B. G. Campling, Mechanisms of resistance of human small cell lung cancer lines selected in vp-16 and cisplatin. Cancer 77, 1797–1808 (1996). 3. P. B. Jensen, B. Holm, M. Sorensen, I. J. Christensen and M. Sehested, In vitro cross-resistance and collateral sensitivity in seven resistant small-cell lung cancer cell lines—preclinical identification of suitable drug partners to Taxotere, Taxol, topotecan and gemcitabine. Br. J. Cancer 75, 869–877 (1997). 4. T. Moritaka, K. Kiura, H. Ueoka, M. Tabata, Y. Segawa, T. Shibayama, N. Takigawa, T. Ohnoshi and M. Harada, Cisplatin-resistant human small cell lung cancer cell line shows collateral sensitivity to vinca alkaloids. Anticancer Res. 18, 927–933 (1998). 5. S. P. Cole, G. Bhardwaj, J. H. Gerlach, J. E. Mackie, C. E. Grant, K. C. Almquist, A. J. Stewart, E. U. Kurz, A. M. Duncan and R. G. Deeley, Overexpression of a transporter gene in a multidrug-resistant human lung cancer cell line. Science 258, 1650–1654 (1992). 6. G. M. Su, M. W. Davey and R. A. Davey, Induction of broad drug resistance in small cell lung cancer cells and its reversal by paclitaxel. Int. J. Cancer 76, 702–708 (1998). 7. C. D. Evans, S. E. Mirski, M. K. Danks and S. P. Cole, Reduced levels of topoisomerase II alpha and II beta in a multidrug-resistant lung-cancer cell line. Cancer Chemother. Pharmacol. 34, 242–248 (1994). 8. L. A. Doyle, D. D. Ross, J. V. Ordonez, W. Yang, Y. Gao, Y. Tong, C. P. Belani and J. C. Gutheil, An etoposide-resistant lung cancer subline overexpresses the multidrug resistance-associated protein. Br. J. Cancer 72, 535–542 (1995). 9. U. A. Sartorius and P. H. Krammer, Upregulation of Bcl-2 is involved in the mediation of chemotherapy resistance in human small cell lung cancer cell lines. Int. J. Cancer 97, 584–592 (2002). 10. U. Zangemeister-Wittke, T. Schenker, G. H. Luedke and R. A. Stahel, Synergistic cytotoxicity of bcl-2 antisense oligodeoxynucleotides and etoposide, doxorubicin and cisplatin on small-cell lung cancer cell lines. Br. J. Cancer 78, 1035–1042 (1998). 11. K. Gemba, H. Ueoka, K. Kiura, M. Tabata and M. Harada, Immunohistochemical detection of mutant p53 protein in small-cell lung cancer: Relationship to treatment outcome. Lung Cancer 29, 23–31 (2000). 12. S. Henness, M. W. Davey, R. M. Harvie and R. A. Davey, Fraction-
503
ated irradiation of H69 small cell lung cancer cells causes stable radiation and drug resistance with increased MRP1, MRP2 and topoisomerase II expression. Int. J. Radiat. Oncol. Biol. Phys. 54, 895– 902 (2002). 13. L. Diatchenko, Y. F. Lau, A. P. Campbell, A. Chenchik, F. Moqadam, B. Huang, S. Lukyanov, K. Lukyanov, N. Gurskaya and P. D. Siebert, Suppression subtractive hybridization: A method for generating differentially regulated or tissue-specific cDNA probes and libraries. Proc. Natl. Acad. Sci. USA 93, 6025–6030 (1996). 14. P. Chomcyznski and N. Sacchi, Single-step method of RNA isolation by acid guanidium thiocyanate-phenol-chloroform extraction. Anal. Biochem. 162, 156–159 (1987). 15. G. M. O’Neill, G. B. Peters, R. M. Harvie, H. B. Mackenzie, S. Henness and R. A. Davey, Amplification and expression of the ABC transporters ARA and MRP in a series of multidrug-resistant leukaemia cell sublines. Br. J. Cancer 77, 2076–2080 (1998). 16. J. I. Garrels and B. R. Franza, Jr., The REF52 protein database. Methods of database construction and analysis using the QUEST system and characterizations of protein patterns from proliferating and quiescent REF52 cells. J. Biol. Chem. 264, 5283–5298 (1989). 17. A. Schevchenko, M. Wilm, O. Vorm and M. Mann, Mass spectrometric sequencing of proteins from silver-stained polyacrylamide gels. Anal. Chem. 68, 850–858 (1996). 18. D. L. Rothemund, V. L. Locke, A. Liew, T. M. Thomas, V. Wasinger and D. B. Rylatt, Depletion of the highly abundant protein albumin from human plasma using the Gradiflow. Proteomics 3, 279–287 (2003). 19. M. E. Harper, A. Antoniou, E. Villalobos-Menuey, A. Russo, R. Trauger, M. Vendemelio, A. George, R. Bartholomew, D. Carlo and M. K. Newell, Characterization of a novel metabolic strategy used by drug-resistant tumor cells. FASEB J. 16, 1550–1557 (2002). 20. L. Zhang, R. E. Cilley and M. R. Chinoy, Suppression subtractive hybridization to identify gene expressions in variant and classic small cell lung cancer cell lines. J. Surg. Res. 93, 108–119 (2000). 21. S. P. Cole, H. F. Downes, S. E. Mirski and D. J. Clements, Alterations in glutathione and glutathione-related enzymes in a multidrug-resistant small cell lung cancer cell line. Mol. Pharmacol. 37, 192–197 (1990). 22. J. W. Chang, H. B. Jeon, J. H. Lee, J. S. Yoo, J. S. Chun, J. H. Kim and Y. L. Yoo, Augmented expression of peroxiredoxin I in lung cancer. Biochem. Biophys. Res. Commun. 289, 507–512 (2001). 23. V. L. Kinnula, S. Lehtonen, R. Sormunen, R. Kaarteenaho-Wiik, S. W. Kang, S. G. Rhee and Y. Soini, Overexpression of peroxiredoxins I, II, III, V, and VI in malignant mesothelioma. J. Pathol. 196, 316–323 (2002).