along the lower 4 km of the flow line and then biannually ... As the quadrilaterals were thus overdeter- ..... Smoothed curves were drawn through comparable.
1550
Changes in mass balance, velocity, and surface profile along a flow line on Barnes Ice Cap, 1970- 1984l ROGERLEB. HOOKE Department of Geology and Geophysics, University of Minnesota, Minneapolis, MN 55455, U.S.A.
GERALDW . JOHNSON Department of Civil and Mineral Engineering, University of Minnesota, Minneapolis, MN 55455, U.S.A.
KEITHA. BRUGGER Department of Geology and Geophysics, University of Minnesota, Minneapolis, MN 55455, U.S.A.
Can. J. Earth Sci. Downloaded from www.nrcresearchpress.com by University of Maine on 09/19/13 For personal use only.
BRIANHANS ON^ National Center for Atmospheric Research, Boulder, CO 80307, U.S.A. AND
GERALD HOLDSWORTH National Hydrology Research Center, Suijiace Water Division, 11 Innovation Boul., Saskatoon, Sask., Canada S7h' 3H5 Received May 23, 1986 Revision accepted November 26, 1986 On a number of occasions between 1970 and 1984, measurements of mass balance, surface velocity, and surface elevation were made along a 10.2 km flow line extending from the divide to the margin on Barnes Ice Cap, Baffin Island, Canada. The average mass balance rate on this Arctic ice cap appears to be controlled principally by summer temperature. Years of negative mass balance dominated during the 14 year period of the study; according to our measurements, this should have resulted in a thinning of an average of 2.65 m along the flow line. Surface-elevation measurements, however, suggest that the glacier thinned only - 1.7 m during this time period. The slightly compressive mean transverse strain can account for - 0.20 m of the discrepancy between these two figures. The rest is attributed to errors in mass balance. In particular, increases in density of old fim and freezing of water in crevasses could not be evaluated adequately from our measurements. The thinning was not uniform. Near the margin the glacier thinned - 5 m and near the divide, 2.5 m, but between 3.5 and 5.5 km from the divide there seems to have been no substantial change in thickness. Thus, along the down-glacier half of the flow line the decrease in thickness was accompanied by an increase in slope. Within 4 km of the margin the decrease in thickness resulted in a decrease in horizontal velocity of up to - 15% , despite the increase in slope. Higher on the glacier, however, the horizontal velocity increased - 5 % . These changes are broadly consistent with those estimated from the changes in shear stress calculated using the hydrostatic approximation.
-
A plusieurs reprises entre 1970 et 1984, des mesures d'tquilibre de masse, de vitesses i la surface et d761Cvationde la surface ont kt6 effectutes le long d'une direction d'tcoulement de 10,2 krn allant de la ligne de partage jusqu'i la marge sur la calotte glaciaire de Barnes, ile de Baffin, Canada. Le taux moyen de l'tquilibre de masse sur cette calotte glaciaire arctique apparait contdlt principalement par la temptrature estivale. Les anntes dlCquilibre de masse ntgatif ont domint la pCriode des 14 ans de cette ttude; d'apks nos relevCs, il aurait dfi se pmduire un amincissement moyen de 2,65 m le long de la direction d'tcoulement. Cependant, les mesures dlCltvation de la surface indiquent que le glacier s'est aminci de seulement - 1,7 m durant les 14 ans de l'ttude. La faible contrainte transversale de compression moyenne ne peut contribuer que pour -0,20 m de l'tcart de ces donnks. Le reste est attribuC aux erreurs dans les tvaluations de 1'Cquilibre de masse. En particulier, 1'Cvaluation inad6quate i partir de nos mesures des accroissements de la densitt du nCvC ancien et de la congtlation de l'eau dans les crevasses. L'amincissement n'ttait pas uniforme. P k s de la marge le glacier s'est aminci de -5 m et p&s de la ligne de partage, -2,5 m, mais entre 3,5 et 5,5 km de la ligne de partage nous n'avons pas observt de changement substantiel de l'tpaisseur. Ainsi donc, en direction aval du glacier, i la moitit de la ligne d'kcoulement, la diminution de l'tpaisseur Ctait accompagnte d'une pente plus pmnoncCe. Dans les quatre premiers kilomktres de la marge la diminution en tpaisseur Ctait associte i une reduction de la vitesse horizontale de 15% et moins, et ce malgr6 une pente plus raide. Cependant, i un niveau plus Clevt dans le glacier, la vitesse horizontale augmentait de 5 % . Ces changements s'accordent de mansre satisfaisante avec ceux qui dtcoulent des variations dans la contrainte de cisaillement laquelle est calculte au moyen d'une approximation hydrostatique. [Traduit par la revue]
-
-
Can. J. Earth Sci. 24, 1550-1561 (1987)
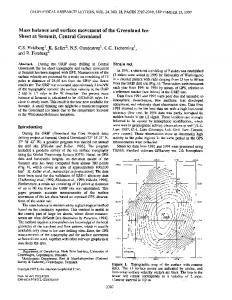
Introduction In 1970 a network of 43 stakes was established along a 10 km flow line extending down the northeast flank of the south dome of Barnes Ice Cap, Canada (Holdsworth 1975). The stakes formed a series of overlapping strain diamonds or 'Publication 1086 of the School of Earth Sciences, Department of Geology and Geophysics, University of Minnesota, Minneapolis, MN 55455, U.S.A. *Present address: Department of Geography, University of Delaware, Newark, DE 19716, U.S.A. Pnnted in Canada i lmpnmt au Canada
quadrilaterals (Fig. 1 ) . This net was resurveyed in 1971 to determine velocities, strain rates, and mass balance. The mass balance studies were continued annually until 1980 and then biannually until 1984. Ice thicknesses were measured along the flow line in 1970, using radioecho techniques (Jones 1972). In 1973 studies of near-surface temperatures were initiated using six 25 - 30 m deep boreholes along the flow line, and in 1974 deeper holes were drilled for measurement of temperature, stable-isotope ratios, crystal texture and fabric, and internal deformation (Hooke 1976; Hooke and Hudleston 1980, 198 1 ; Hooke et al. 1980, 1983a; Hooke and Clausen 1982; Hooke
1551
Can. J. Earth Sci. Downloaded from www.nrcresearchpress.com by University of Maine on 09/19/13 For personal use only.
HOOKE ET AL.
FIG. 1 . Map of part of south dome of Barnes Ice Cap showing original trilateration net, boreholes, and stakes measured in 1984. Down-glacier displacements of stakes not shown.
and Hanson 1986). To supplement the latter studies, surface velocities were measured annually between 1977 and 1980 along the lower 4 km of the flow line and then biannually between 1980 and 1984 along the lower 8 km. In 1984 the survey was continued all the way to the divide, thus providing surface elevation data to this point. During the 14 years of measurement, horizontal velocities changed significantly in response to changes in ice thickness and surface slope. The latter changes are a result of a complex dynamic response of the glacier to variations in mass balance (Nye 1960, 1963). The objectives of the present paper are to present the accumulated data on these changes and to discuss briefly the relations among them. More detailed analysis of the long-term implications is deferred.
Suwey techniques The procedure for the 1970 and 1971 surveys was described by Holdsworth (1975). Briefly, the instruments used were two Wild T-2 theodolites, permitting simultaneous measurement of
vertical angles, and a Wild Dl-10 distomat. (Whenever such a surveying instrument was set up on the glacier during these or subsequent surveys, the legs of the tripod were placed on boards that were buried 5- 10 cm beneath the ice or snow surface and covered with loose ice or snow.) The fixed points used for these early surveys were geodetic survey points established by Henderson (1966) on bedrock outcrops about 5 km from the glacier (A and B, Fig. 1). In each quadrilateral in the net, the six distances and eight interior horizontal angles were measured. As the quadrilaterals were thus overdetermined, a least-squares technique was used to adjust the results. The calculations were done with the use of computer programs available in the Geodetic Survey, Department of Energy, Mines and Resources Canada, Ottawa. The standard error in the horizontal velocities determined from these surveys is f100 mm. a-' near the margin, 110 mm. a-' at T061, and f300 mm - a-' at the divide. The corresponding errors in vertical velocities were estimated to be f15 mrn-a-', f 60 mm .a-', and f62 mm a-', respectively. (Herein we
+
Can. J. Earth Sci. Downloaded from www.nrcresearchpress.com by University of Maine on 09/19/13 For personal use only.
CAN.J. EARTH SCI. VOL. 24,1987
_
-_
--
Steady
Distance
from
d i v i d e , km
FIG. 2. (a) Horizontal velocities in 1970- 1971. ( b ) Change in horizontal velocity between 1970- 1971 and year shown. (c) Vertical velocities in 1977- 1978, 1978- 1979, and 1979- 1980. "Steady-state" curve shows approximate vertical velocities required to maintain profile unchanged during years with balanced mass budget. Points for this curve were calculated assuming 1970- 1971 horizontal velocities and a mass balance pattern similar to that measured for 1977- 1978 or 1978- 1979 but shifted downward to yield a zero net balance. (d) Vertical velocities in 1970- 1971, 1980- 1982, and 1982- 1984 and vertical velocities calculated from 141. Steady-state curve reproduced from (c) to facilitate comparison.
take the standard error as defining the error band within which the true value is expected to lie, with -68% probability, if errors are random and normally distributed.) A recently detected error in the adjustment of the vertical distances from these surveys has resulted in a correction of -0.206 m.a-', which must be applied to the vertical velocities obtained from them. Thus all vertical velocities reported by Holdsworth (1975, Table 4) must be reduced by this amount. This correction has been applied in the plot of these velocities in Fig. 2d. In the later surveys fewer stakes were surveyed and there
was less redundancy in the measurements. Between 1977 and 1982 the surveys were done with a Wild T-2 theodolite and Hewlett-Packard 3805 distance meter. In 1984 an AGA Geodimeter 140 electronic theodolite and distance meter ("total station") was available. In order to set the pressure and temperature correction factors on the electronic distance meters, the air temperature was measured and the pressure was estimated based on elevation. The fixed points for these surveys were points N and S (Fig. 1) on stable rock surfaces immediately in front of the glacier. The length of this baseline was
HOOKE ET AL.
measured in 1977, 1978, 1982, and 1984 and was 987.651 f 0.005 m. The uncertainty is less than the standard error of the instruments used (f 0.008 m for distances of 1 krn), so we assume that there were no systematic instrumental errors present. To begin a survey, the three apices of the triangle N - S -TO975 (Fig. 1) were occupied and all three angles and distances were measured. The closure error was distributed among the various measurements using a least-squares procedure. From TO975 outward along the flow line, the horizontal location of each stake was determined by occupying one stake and measuring not only the horizontal angle from the previous stake in the line to the next but also the slope distances between the three stakes. Vertical positions were determined by measuring vertical angles between successive stakes. Normally vertical angles were measured in both the up-glacier and the down-glacier direction, but not simultaneously. In 1977 the measurements out to stake TO91 were made in only the up-glacier direction, and a standard curvature and refraction correction was applied. In the 1977 through 1982 surveys, all vertical and horizontal angles were measured, direct and reversed, at least three times. Most stakes were occupied only once, but when the up-glacier and down-glacier measurements of the difference in elevation between two stakes differed by more than 30 or 40 mm, both stakes were reoccupied and the vertical angles remeasured. The Geodimeter 140 used in 1984 makes corrections for collimation and tilt-axis errors automatically, so it is not necessary to make measurements in both direct and reversed modes. This resulted in a substantial increase in surveying speed and enabled us to close our traverse by surveying first up glacier to the divide and then back again to the margin. Thus most stakes were occupied twice, and those that were not were part of a closed loop within the traverse. As a complete survey required several days, the date of a survey was defined as the date on which angles and distances to the lowermost stake, T0975, were measured. Distances measured later between stakes farther out along the flow line were then adjusted to the survey date, using the average strain rate between the respective stakes. Changes in angles over the few days that elapsed between the measurements were not large enough to warrant this refinement and thus were ignored. A detailed discussion of the uncertainties in the surveys is given in the Appendix. Suffice it to say here that the average uncertainty in position of borehole TO61 is estimated to be 20 mm parallel to the flow line, f 80 mrn normal to it, and f 3 0 mm vertically. At the divide the corresponding uncertainties are f 35, f 350, and 50 mm. These uncertainties result in standard errors in velocity of f 50 mm - a-' both horizontally and vertically at T061. (Because the movement is predominantly parallel to the flow line, most of the uncertainty in the horizontal velocity results from the uncertainty in this direction.) The corresponding standard errors at T020, the most distant point at which velocities were determined during the recent surveys, are 5 2 0 rnm. a-I horizontally and 1 3 0 mm . a-' vertic&ly. The standard error is lower at TO20 because survey techniques improved over the course of the study and because the time intervals between surveys were 2 years during this period. These uncertainties are somewhat less than those for the 1970- 1971 surveys largely because the baseline for the later surveys was 1 krn from the lowermost stakes rather than 6 km. In the context of the present analysis, the uncertainties in the
Can. J. Earth Sci. Downloaded from www.nrcresearchpress.com by University of Maine on 09/19/13 For personal use only.
-
+
-
-
-
1553
magnitudes of the horizontal-velocity vectors are negligible, but those in azimuths are locally large enough to suggest that certain measured changes from year to year are not real (see Appendix). The uncertainties in vertical velocity (Figs. 2c and 2d) are large enough to raise some question about apparent changes from year to year since 1975, and the absence of comparable variations in longitudinal strain rate, discussed below, suggests that these year to year changes are not real.
Comparison with 1970- 1971 measurements Because the 1970 and 1971 surveys were made from a different baseline and the adjusted positions of the stakes are given in geographic (latitude and longitude) coordinates, a direct comparison of survey results was not possible. For present purposes it is more practical to use actual ground distances for such a comparison rather than sea-level distances obtained from computations using geographic coordinates. It was thus desirable to transform the 1970 geographic coordinates into a project plane coordinate system with its origin at fixed point S, the y axis passing through fixed point N, and the x axis directed up glacier. Using the transverse Mercator projection, the 1970 stake locations were first projected from a geographic system to a sea-level plane coordinate system. Using this system, a leastsquares adjustment was made to determine coordinates for points N and S. The adjustment held A and B fixed and determined coordinates of N and S based on six measured interior angles and the measured distance, converted to sea level, between N and S. The sea-level coordinates of the 1970 stakes and of points N and S were then translated, rotated, and elevated into the project coordinate system at an elevation of 700 m above sea level. This adjustment yielded a length for baseline N-S that was 0.016 m longer than our measured length, which is considered a negligible discrepancy. The closure error in the least-squares adjustment of points N and S suggests an uncertainty of +0.1 m in the 1970 position of stake 000s in this new coordinate system. In the computations for the 1977- 1984 surveys, both the scale factor (the ratio of grid distance to sea-level distance) and the elevation factor (the correction due to height of the stakes above or below the 700 m level) have been ignored. In view of the limited east-west extent (about 12' of arc) of the survey network, the error introduced by neglecting the scale factor is less than 1 part in lo6. The maximum difference in elevation between the stakes and the 700 m level of the project coordinate system is 200 m, so the horizontal error introduced by assuming a common elevation for all survey points is 0 at the 700 m elevation and increases linearly (with elevation) to f 0 . 1 m at the margin and divide. In the context of the present analysis, these errors in the transformation procedure have no effect on the calculated velocities. They affect only the calculations of changes in ice cap thickness between 1970 and later years, and the uncertainties thus introduced into these calculations are negligible.
-
Profile changes If the horizontal and vertical coordinates of the top of a stake and its height above the firn or ice surface are known, the surface profile of the ice cap can be determined. However, because the stakes move and because new stakes or temporary survey points were sometimes established far from the original stakes, the points where elevations were determined along the
CAN. J.
Can. J. Earth Sci. Downloaded from www.nrcresearchpress.com by University of Maine on 09/19/13 For personal use only.
1554
p
EARTH SCI. VOL. 24, 1987
P o i n t s f r o m 4984 t h a t w e r e not used in drawing c u r v e s
I I
I O\
\O
+O
2
4
8
6
10
Distance f r o m d i v i d e , km FIG.3. Changes in elevation of ice or firn surface along flow line between 1970 and year indicated. profiles were never at the some location from one year to the next. As changes in the profde are rather small, a systematic interpolation procedure was needed to evaluate them. The procedure adopted was as follows: Each of the stakes included in the 1977- 1984 surveys, referred to henceforth as 77 - 84 stakes, was on or close to one of the original longitudinal lines of stakes established in 1970 (Fig. 1). We determined the 1970 positions of the three or four stakes on that longitudinal line that were closest to a 77-84 stake. Then, using first the positions of the two original stakes lying down glacier and the one lying up glacier from the 77 -84 stake, we calculated the coefficients of a quadratic curve passing through these three positions. Using this curve, we estimated the 1970 ice-surface elevation at the location of the 77 -84 stake and determined the change in elevation by difference. We then repeated the calculation, where possible, using the positions of the one stake down glacier and two stakes up glacier from the 77 - 84 stake. The mean of these two estimates of the change in elevation is plotted in Fig. 3, and the difference between the two estimates was used to evaluate the standard error in the calculation. In most cases, the original stakes were not suitably located to make both of the above calculations, so no formal error estimate is possible. In the majority of the situations where estimates could be made, the 77 - 84 stake was one of the original stakes, so it was only a short distance down glacier from its original position. Uncertainties were then typically less than +0.06 m. In one instance the 77-84 stake was far from the nearest of the original stake positions. The uncertainty was then k0.29 m. This leads us to suspect relatively large errors in other cases where the 77 - 84 stakes were either far from the original stake positions or displaced a significant distance laterally from the original line. In drawing the curve for 1984 in Fig. 3, four such points have been ignored. The consistent hump in these curves 8.1 km from the divide can
also be attributed to this source of error. The curves in Fig. 3 show that near the margin the ice cap thinned considerably between 1970 and 1977, a period of generally negative mass balance. In the late 1970's it began to thicken again, but a pair of strongly negative years in the early 1980's abruptly reversed this trend. Near the middle of the flow line, about 5 km from the divide, the profile appears to have changed relatively little in the early 1970's, and then it thickened 1 m in the late 1970's. The latter trend was again reversed in the early 1980's. The surveys of the 1970's did not extend all the way to the divide, so here we know only that the average trend was thinning over the 14 year period.
-
Mass bdance Measurements Mass balance measurements were made in the spring of each year by measuring both the distance from the top of a stake to the snow surface and the snow depth. The latter was determined by probing to the previous year's summer surface at a minimum of four places around each stake. This old summer surface is glacial ice in the ablation area and either superimposed ice or firn in the accumulation area. Where firn was present, a minimum estimate of its thickness was obtained by driving the probe as deep as possible with a hammer. The stake measurements were supplemented by snow pits excavated in one to three locations along the flow line. The pits normally penetrated any firn layers immediately below the new snow. Density and stratigraphic profiles were measured in them. The measured changes in the levels of the firn and ice surfaces on the stakes and the observed firn thicknesses at each stake were plotted stratigraphically as a function of distance along the flow line using the previous year's summer surface as a datum. Where several stakes were in close proximity to one another, as in the strain diamonds (Fig. I), average values were used. Smoothed curves were drawn through comparable
Can. J. Earth Sci. Downloaded from www.nrcresearchpress.com by University of Maine on 09/19/13 For personal use only.
HOOKE ET AL.
0
5
10
Distance from divide, km FIG.4. Mass balance during latter part of study. In some places the changes in ice or fim surface (Fig. 3), when adjusted for vertical velocity (Fig. 2), may appear to be inconsistent with the curves shown above. An example is 2 km from the divide in 1979- 1981. This occurs because the mass balance curves reflect internal accumulation wherever possible. NOTE: m.w.e., metres water equivalent.
points (Fig. 4) and used to estimate the volume (per unit width, normal to the flow line) of (1) snow, (2) new firn, (3) new superimposed ice (that is, ice added above the old summer surface), (4a) old firn that has increased in density, (46) old firn transformed into ice by refreezing of percolating melt-
water, and (5 and 6) ice and firn lost below the equilibrium line. These volumes were converted to water equivalents using measured snow and firn densities, or interannual changes in density, and an assumed density of 0.90 Mg/m3 for ice. The resulting figures were divided by the total length of the flow
Can. J. Earth Sci. Downloaded from www.nrcresearchpress.com by University of Maine on 09/19/13 For personal use only.
CAN. J. EARTH SCI. VOL. 24,1987
8
mmcv
999 000
+I +I +I cvoz bN
000;
I
0
+I N
8I
I
8 0 +I
I-
2
line to obtain the various components of the average net balance (Table 1, rows 1-6) and summed to obtain the average net balance (Table 1, row 7). The contribution to the net balance represented by items (4a) and (4b) is referred to as internal accumulation (Trabant and Mayo 1985). The average summer balance was estimated from the difference between the average winter and the average net balances (Table 1, row 8). For those years in which the change in ice surface was not measured directly because of the thickness of the firn, a crude approximation for ice accumulation was made by calculating the change in mass from the winter snowpack of 1 year to the firn of the next and assuming that the missing water was available to fill void space in the older firn, forming superimposed ice. This calculation assumes no water loss, which is reasonable at higher elevations (Loken and Andrews 1966). When this procedure was tested in areas where changes in ice surface were independently documented, the results were reasonably consistent with measured changes. These measurements underestimate the total winter balance because they were made in May or early June and thus do not include snow from late spring storms. Such storms can contribute significantly to the winter balance (Baird et al. 1952; Sagar 1966; Loken and Andrews 1966). Furthermore, our measurements do not extend onto the "wind-drift wedge" at the margin (Loken and Andrews 1966; Hooke 1973, Fig. 3), where the snowpack is two to three times as thick as elsewhere on the glacier. We have, however, allowed for the presence of this wind-drift wedge in the winter balance estimates in Table 1. Our measurements also tend to overestimate the summer balance, particularly during cooler years. This is because firn is the dominant form of accumulation during such years, whereas during warmer years much of the ice cap's nourishment is in the form of superimposed ice (Baird et al. 1952). After several consecutive years of firn accumulation, the thickness of the firn layers precludes the detection of the ice surface by probing (and digging). Consequently, in such situations not only is the yearly change in the ice surface unknown, but the change in density of older firn is also difficult to estimate. In addition to these systematic errors, there are uncertainties in the calculated mass balances as a result of random errors in measurement. For the years 1975- 1984 these were estimated in the following way. The measurements at each of the five stakes in some of the strain nets yield five independent observations of the mass balance over a reasonably small area. These data were used to calculate the probable error in each measurement and thus the probable error in the mean. In this way, the two to four strain nets measured each year provided a mean estimate of the uncertainty along the entire flow line. Typically, the uncertainties in snow depths and in the change in the ice or firn surface, where documented, were about f 5 and f l o % , respectively, while that in firn thickness was f 2 0 % . The latter value reflects the problem of determining, in the absence of pit observations, whether the probe bottomed on an ice lens, dense firn, or the true ice surface. The two former are easily mistaken for the ice surface. Uncertainties in changes in ice surface are lower in the ablation area where no firn exists and the ice surface is well defined. Uncertainties associated with the measurement of snow and firn densities and of volumes between successive surfaces in the diagrams are small. Other sources of error are more difficult to evaluate. The
1557
HOOKE ET AL.
Can. J. Earth Sci. Downloaded from www.nrcresearchpress.com by University of Maine on 09/19/13 For personal use only.
assumptions made in estimating the position of the ice surface, although thought to be reasonable, may introduce significant error into the results. Furthermore, when carried forward into successive balance years, these approximations may produce a systematic error of unknown magnitude. Curve smoothing and failure to accurately account for firn densification both add to the uncertainty in the results. These sources of error were assessed qualitatively, and the standard errors assigned to the various components of the mass balance (Table 1) reflect this assessment. Relation between mass balance rate and climate The mass balance rate of a glacier like Barnes Ice Cap is primarily a function of winter precipitation and summer melt. The latter depends on both sensible and radiative heating, and the contribution of radiative heating, in particular, is dependent upon albedo. Tangborn (1980) successfully modeled the daily melt on North Cascade Glacier, a temperate glacier, by assuming that sensible heating is proportional to air temperature and radiative heating to the daily temperature range, the latter being a proxy measure of cloudiness. Following his procedure, we attempted to build a regression model of annual mass balance rates on Barnes Ice Cap using winter precipitation, mean summer temperature, and mean summer temperature range. Monthly climatological data were obtained for Dewar Lakes, which lies 120 km south of the ice cap on the interior plateau of Baffin Island at an altitude of 518 m, which is approximately the altitude of the ice cap margin in the study area. Measurements at Dewar Lakes began in 1958 and have been continuous since then, so the number of data points is fixed by the number of years for which mass balance rates are available: 17 between 1962 and 1983. Simple and multiple regressions were carried out in which the dependent variable was the mass balance rate for each year and the independent variables were all possible combinations of winter precipitation, summer mean temperature, and summer mean temperature range. Although some snow may fall on the ice cap in July and August, the winter period was taken to extend from September to June, inclusive. Correlations with summer variables were found to be best when summer was defined as June through September, thus including all of the ablation season and in most years some of the accumulation season. We estimated the standard errors of the correlations using bootstrapping (Efron 1981) with 1000 samples, thus obviating the need to assume normally distributed data for such a small data set. The significance tests reported allow the maximum probability of erroneously accepting a bad correlation to be 5 % . In these regressions, winter precipitation at Dewar Lakes is never significantly correlated with mass balance. This is because winter precipitation has very little interannual variation compared with mass balance. For the 17 years used in this study, winter precipitation has a mean value of 0.162 m with a range of 0.078 -0.221 m. In contrast, the mean mass balance rates ranges from - 1.04 m . a-I to +0.38 m a-I with a mean of -0.19 m.a-'. The interannual variations of winter precipitation are so small, by comparison, that we may treat winter precipitation as a virtual constant and ascribe all interannual variations in mass balance rate to variations in summer balance. Both summer temperature and summer temperature range have strong, significant inverse correlations with mass balance, but they are also strongly correlated with each other.
- Sept.) t e m p e r a t u r e a t Dewar Lakes, "C
Mean summer (June
FIG. 5. Relation between mass balance and mean summer (JuneSeptember) temperature at Dewar Lakes. Monthly temperature data were kindly supplied by the Canadian Atmospheric Environment Service. Mass balance data for 1962- 1964 are from Sagar (1966). Data for 1965-1966 are from L@kenand Sagar (1967). Data for 1970 - 1974 are from Holdsworth and Hooke (1977). NOTE:m.w . e . , metres water equivalent.
In a multiple regression with two mutually correlated independent variables, the partial correlation of the weaker variable is reduced by the degree to which it mimics the stronger variable. As a result, when both summer temperature and summer temperature range are used in a multiple regression, summer temperature range becomes insignificant. This result does not imply that radiative heating is unimportant for the mass balance of the ice cap. If there is a correlation between cloud cover and temperature range on Baffin Island, as Tangborn (1980) found in the Pacific Northwest of the United States, then there clearly will also be a relation between cloud cover and temperature when averaging over a 4 month period; in this case the strength of the temperature relation dominates the statistical analysis. The best completely significant regression model we are left with makes the mass balance rate of Barnes Ice Cap a linear function of the mean summer temperature at Dewar Lakes. The correspondence is very strong, with a correlation 0.02 (Fig. 5). Kuhn (1984) suggested that the of -0.93 strongest influence on annual net balance rate in the Arctic is the duration of the ablation season. Our calculations clearly indicate that the ablation season is virtually all important in understanding the mass balance on Barnes Ice Cap. Additionally, since the rather long, 4 month summer was found to yield the best correlations, our summer mean temperature probably serves as a proxy for both the length and the intensity of the ablation season.
+
I
Can. J. Earth Sci. Downloaded from www.nrcresearchpress.com by University of Maine on 09/19/13 For personal use only.
1558
CAN. I. EARTH SCI. VOL. 24, 1987
Comparison of mass balance and profile changes If we sum the mass balances over the 14 years of the study, we find that the predominantly negative balances should have resulted in an average thinning of -2.65 f 0.14 m in the absence of transverse strain. Transverse strain rates at the surface were generally compressive in 1970- 1971 (Holdsworth 1975, Fig. 10); a numerical integration of the product of these strain rates and the thickness along the flow line suggests that this could have caused a thickening of -0.20 f 0.05 m, leaving a net thinning of -2.45 k 0.15 m. The profile changes (Fig. 3), on the other hand, suggest an average thinning of only 1.7 0.2 m, after an adjustment is made for the low-density firn along part of the 1984 profile. The large discrepancy between these two estimates suggests the existence of a systematic error of some kind. Two possible sources of systematic error merit consideration: an error in calculating the effect of transverse strain rate and an error in mass balance. Transverse strain rates probably decrease with depth. Taking this into account would increase the above discrepancy by 0.03 f 0.01 m .a-'. Transverse strain rates may also have changed during the period of the study. Our measurements on the four small strain nets along the flow line (Fig. 1) and on one of the original quadrilaterals that could be measured up to 1979 suggest that they have become less compressive or more extending at four of the five locations. Thus a change in transverse strain rate between 1970- 1971 and 1984 cannot explain the discrepancy either. A systematic error may be present in the mass balance measurements, however. As noted, these measurements do not include contributions to internal accumulation resulting from refreezing of meltwater in crevasses or in fim that is more than a couple of years old. Both certainly occur: during drilling in the accumulation area permeable firn layers were encountered at depths up to 10 m, and crevasses a few centimetres wide were commonly seen during late-season forays above the equilibrium line. As such internal accumulation might be expected to be largest in warmer years, we may have systematically overestimated the (negative) mass balance rate in warmer years. Whether this could account for the required -0.8 m (0.06 m - am') of internal accumulation is uncertain, but it could probably account for more than half of this amount.
+
-
-
-
Changes in velocity Horizontal velocities Over the down-glacier 4 krn of the flow line, horizontal velocities decreased between 1970- 1971 and 1977- 1978 (Fig. 2b). Then, in response to the thickening that resulted from the positive mass balances of the late 1970's (Table l), they increased for a couple of years. The strong thinning of the 1980's seems to have reversed this trend. In order to account for these changes quantitatively, we need to express the changes in surface velocity in terms of the changes in thickness and surface slope. We begin with Glen's (1955) flow law, i = (dB)", where i and T are the effective strain rate and stress and B and n are empirical constants. B is not independent of depth in Barnes Ice Cap (Hooke and Hanson 1986); a basal layer of bubbly white (Wisconsinan) ice is substantially softer and less dense than the overlying blue ice. To account for these different layers, we set B equal to its value in the blue ice and define an enhancement factor, E, such that i = E(T/B)" in the basal white ice. Additionally, we define f to be the ratio of the density of the white ice to the density of the blue ice. In the manner of Nye (1952), we neglect longitu-
dinal and transverse strain rates and integrate over the depth to obtain
where us is the surface velocity, g is gravity, a is the surface slope, H i s the total thickness of the glacier, h is the thickness of the basal layer of white ice, and y = f"E. Applying the chain rule and dividing by [I], we obtain [21
da du, = n + (n + 1 ) d ~
yHn - (y - 1)(H - h)"
us a In the present case y 4.9, and h is taken to increase from 8 m at TO20 to 20 m at TO61 and then remain constant. Note that if y = 1 or h = 0, this reverts to the much simpler singlelayer equation
-
With the use of the velocity and surface-profile data, evaluation of du, and dH in [2] is straightforward. Determining the surface slope for any given stake and year is a little more complicated. To do this a least-squares second-order curve was fit through the ice surface elevations at five stakes, the stake in question, and the two immediately up glacier and two down glacier from it. The derivative of the curve was then evaluated at the desired point. The slopes at the time of two successive surveys were averaged to obtain a mean slope for the time interval between the surveys. The difference between these mean slopes from one time interval to the next was then taken as an estimate of da. Mean values of H during a time interval were obtained in a similar fashion. Values of du, calculated from these estimates of dH and da, using n = 3 in [2], are plotted against observed values in Fig. 6. The number of points is small compared with the total number of stakes measured. This is in large part because the stakes used in the least-squares curve-fitting procedure described above had to be the same, or at least in nearly the same positions, in three successive surveys. Otherwise values of d a proved to be unreliable. Thus when more than one or two stakes melted out and were not replaced between surveys, d a could not be estimated. For this reason, for example, quantitative comparisons with the 1970- 1971 velocities were not possible. The uncertainties in d a and dH vary with position along the flow line but are typically f 15 and f 12%, respectively. This results in an uncertainty in du, of, for example, fO.10 m/a at T081. The corresponding uncertainty in the observed values of du, is f 0.06. The data plotted in Fig. 6 have a significant correlation coefficient of 0.58 f 0.13. The regression line falls very close to the diagonal of the graph, although the visually determined axis of the data ellipse has a higher slope. Given the error of the measurements involved and the simplicity of the assumptions behind [2], we consider this reasonable agreement between theory and observation.
-
-
-
-
Vertical velocities Vertical velocities arise from a combination of flow over a sloping bed and of longitudinal and transverse strain (assuming incompressibility). As ice thicknesses are 100-200 m while 3 -6 m. a-', differences in bed horizontal velocities are slope between successive locations of a stake are unlikely to have a significant effect on the vertical velocity of that stake.
-
-
HOOKE ET AL.
0.2
I
-
I
I
I
I
I
I
1
I
4977-78- 1978-79 0 4978-794979-80 0- 4979-804980-82 p 4980-82-4982-84 Average
-
standard
Can. J. Earth Sci. Downloaded from www.nrcresearchpress.com by University of Maine on 09/19/13 For personal use only.
error
0
-
-
-
P
-
P I
I
1
I
Observed
I
1
du,,
I
I
I
rn-a-'
FIG. 6. Calculated changes in velocity plotted against observed changes. Line shown is least-squares regression line.
Thus any changes that occur should be largely a result of changes in strain rate. We studied this possibility first by calculating the changes in the vertical velocity that would be expected from the observed changes in longitudinal strain rate acting over a known ice thickness. In 14 out of 17 instances in which this calculation was possible, the measured changes in vertical velocity were a great deal larger than the calculated changes, the differences often being in excess of an order of magnitude. We then calculated vertical velocities, w, at stakes along the central line of the original net, using the horizontal velocities, us,and principal strain rates, il and C2, measured in 1970- 1971 (Holdsworth 1975, Tables 3 and 5 ) and the ice thicknesses, h, and bed elevations, b , measured in 1970 (Jones 1972, Table 3). The relevant equation is if x is positive in the down-glacier direction. The factor 0.84 (= ( n + l)l(n + 2) with n = 4.2 (Holdsworth 1975)) allows for a decrease in strain rate with depth (Hooke et al. 19836, p. 271). The least well known of these parameters if the bed slope, dbldx. This is because values of b are given only at the locations of the stakes (Jones 1972), so dbldx is averaged over distances much greater than the distance a stake moves in a year. Near the equilibrium line, where usis highest, this leads to an uncertainty of f0.1 m .a-I in w. Farther out along the flow line the uncertainty is less. The resulting values of w are plotted in Fig. 2d. The agreement with measured values is considered satisfactory, given the uncertainties in strain rates and bed slopes. Thus we conclude that we should be able to predict changes in vertical velocity from the measured changes in
-
longitudinal strain rate to well within an order of magnitude. The discrepancy between the measured and predicted changes suggests that systematic errors are present in the measurements. This leads to the further conclusion that when averaged over 2 -3 years, the measured vertical velocities are probably reasonably accurate, but changes from year to year cannot be resolved with our data.
Movement at the divide Finally, it is interesting to compare the coordinates of stake 000s in 1970, 1971, and 1984. The position of this stake obtained from the 1984 survey is 1.76 m east-northeast of its 1970 position. However, between 1970 and 1971 the stake apparently moved 0.22 m to the south-southwest. Had it continued to move at this rate until 1984, it would now be -4.5 m southwest of the position calculated from the 1984 survey. There are, of course, three possible explanations for this 4.5 m discrepancy: (1)the velocity determined from the first two surveys is wrong; (2) the divide has shifted, thus reversing the flow direction; or (3) the procedure used to tie the Holdsworth and Hooke -Johnson surveys together has introduced more uncertainty than expected. The second of these seems most probable, as the ice divide in this location has been adjusting to the effects of a surge that is inferred to have occurred about a century ago (Holdsworth 1973, 1977). Concluding statement The main conclusions of this study are as follows: (1)The principle controls on the mass balance rate of Barnes Ice Cap are the duration and intensity of the ablation season,
CAN. J. EARTH SCI. VOL. 24, 1987
1560
which are strongly predicted by the mean June - September temperature. Variations in winter precipitation are an order of magnitude smaller than variations in mass balance rate. (2) Failure to include internal accumulation in mass balance calculations may have resulted in underestimating the mass balance rate by 0.06 mla, o r 30% of the average rate. (3) Changes in surface velocity due to the changes in thickness and surface slope are roughly in accord with those expected, based on theoretical considerations. Because of the presence of a layer of weak Wisconsinan ice at the base of the glacier, the changes are slightly less than would have occurred on a homogeneous glacier. As a result of escalating costs and diminishing returns, this 14 year study of the dynamics of Barnes Ice Cap has now been terminated. We hope and expect, however, that the data obtained will be used in other publications during the next few years. A copy of the final computer output giving stake coordinates, velocities, surface slopes, and other pertinent data will be placed on file with World Data Center A for Glaciology, at the Cooperative Institute for Research in Environmental Sciences, Boulder, C O 80309, U.S.A.
-
-
Can. J. Earth Sci. Downloaded from www.nrcresearchpress.com by University of Maine on 09/19/13 For personal use only.
-
-
Acknowledgments The hard work and cheerful demeanor of numerous colleagues and assistants over the years, often under adverse field conditions, have been essential to the success of this project. We want particularly to recognize the direct and indirect contributions of our colleagues Robert Baker, Bruce Koci, and Peter Hudleston; of our most persevering field assistant, Scott Watson, who can now readily distinguish between kerosene and gasoline; and of our most recent field assistant, Kent Swanson. We also acknowledge with gratitude the outstanding support of Bradley Air Services and the cooperation of the Inuit people of Clyde River. Larry Mayo's critical comments on an early draft of the manuscript resulted in significant improvements. We also appreciate the time spent on the manuscript by two anonymous referees. This research was supported by numerous United States National Science Foundation grants over the years, the most recent of which was DPP-8400918. In addition BH acknowledges the support of the National Center for Atmospheric Research, which is sponsored by the United States National Science Foundation. BAIRD,P. D., WARD,W. H., and ORVIC,S. 1952. The glaciological studies of the Baffin Island Expedition, 1950. Journal of Glaciology, 2: 2-23. EFRON, B. 1981. Nonparametric estimates of standard error: the jackknife, the bootstrap and other methods. Biometrika, 61: 589-599. GLEN,J. W. 1955. The creep of polycrystalline ice. Proceedings of the Royal Society of London, Series A, 228: 519-538. HENDERSON, J. P. 1966. Report and calculations for the Barnes Ice Cap movement survey. Unpublished manuscript. HOLDSWORTH, G. 1973. Evidence of a surge on Barnes Ice Cap. Canadian Journal of Earth Sciences. 10: 1565- 1574. 1975. Deformation and flow of Barnes Ice Cap, Baffin Island. Environment Canada, Scientific Series, No. 52. 1977. Surge activity on Barnes Ice Cap. Nature (London), 269: 558 -590. HOLDSWORTH, G., and HOOKE,R. LEB. 1977. In Fluctuations of Glaciers 1970-74, Val. 111, Edited by F, Miiller. International Association of Hydrological Sciences - United Nations Educational, Scientific and Cultural Organization, Paris, France, p. 123. HOOKE,R. LEB. 1973. Flow near the margin of the Barnes Ice Cap, and the development of ice-cored moraines. Geological Society of
America Bulletin, 84: 3929 -3948. 1976. Pleistocene ice at the base of the Barnes Ice Cap, Baffin Island, N.W.T., Canada. Journal of Glaciology, 17: 49 -60. HOOKE,R. LEB., and CLAUSEN, H. B. 1982. Wisconsin and Holocene 5180variations-Barnes Ice Cap, Canada. Geological Society of America Bulletin, 93: 784 -789. HOOKE,R. LEB., and HANSON,B. 1986. Borehole deformation experiments, Barnes Ice Cap, Canada. Cold Regions Science and Technology, 12: 261 -276. HOOKE,R. LEB., and HUDLESTON, P. J. 1980. Ice fabrics in a vertical flow plane, Barnes Ice Cap, Canada. Journal of Glaciology, 25: 195-214. 1981. Ice fabrics from a borehole at the top of the south dome, Barnes Ice Cap, Baffin Island. Geological Society of America Bulletin, 92: 274 -28 1. HOOKE,R. LEB., ALEXANDER, E. C., JR., and GUSTAFSON, R. G. 1980. Temperature profiles in the Barnes Ice Cap, Baffin Island, Canada, and heat flux from the subglacial terrane. Canadian Journal of Earth Sciences, 17: 1174 - 1188. HOOKE,R. LEB., GOULD,J. E., and BRZOZOWSKI, J. 1983a. Nearsurface temperatures near and below the equilibrium line on polar and subpolar glaciers. Zeitschrift fir Gletscherkunde und Glacialgeologie, 19: 1-25. HOOKE,R. LEB., BRZOZOWSKI, J., and BRONGE, C. 1983b. Seasonal variations in surface velocity, Storglaciaren, Sweden. Geografiska Annaler, 65A: 263 -277. JOHNSON, G. W., and CLAPP,J. L. 1971. Solar astronavigation in high latitudes. ASCE Journal of the Surveying and Mapping Division, 97: 27-38. JONES,S. J. 1972. Radio-depth sounding on Meighen and Barnes ice caps, Arctic Canada. Environment Canada, Scientific Series, No. 25. KUHN,M. 1984. Mass budget imbalances as criterion for a climatic classification of glaciers. Geografiska Annaler, 66A: 229-238. 0.H., and ANDREWS, J. T. 1966. Glaciology and chronolL@KEN, ogy of fluctuations of the ice margin at the south end of the Barnes Ice Cap, Baffin Island, N.W.T. Geographical Bulletin, 8: 341 -359. LOKEN,0 . H., and SAGAR, R. B. 1967. Mass balance observations on the Barnes Ice Cap, Baffin Island, Canada. Committee on Snow and Ice, General Assembly of Bern, Sept. -0ct. 1967, pp. 282-290. NYE,J. F. 1952. The mechanics of glacier flow. Journal of Glaciology, 2: 82-93. 1960. The response of glaciers and ice sheets to seasonal and climatic changes. Proceedings of the Royal Society of London, Series A, 256: 559-584. 1963. The response of glaciers to changes in the rate of nourishment and wastage. Proceedings of the Royal Society of London, Series A, 275: 85 - 112. SAGAR, R. B. 1966. Glaciological and climatological studies on the Barnes Ice Cap, 1962-64. Geographical Bulletin, 8: 3 -47. TANGBORN, W. 1980. TWOmodels for estimating climate-glacier relationships in the North Cascades, Washington, U.S.A. Journal of Glaciology, 25: 3 -21. TRABANT, D. C., and MAYO,L. R. 1985. Estimation and effects of internal accumulation on five glaciers in Alaska. Annals of Glaciology, 6: 113-117.
Appendix: Estimation of uncertainty in stake positions Horizontal velocity The uncertainty in the horizontal position of the stakes arises from uncertainties in the measurement of the distances and of the horizontal angles. We estimate this uncertainty in three ways: (1) fmm analysis of the standard elmr in each measurement, (2) from study of variations in azimuth of velocity Vectors from year to year, and (3) from a least-squares analysis of
Can. J. Earth Sci. Downloaded from www.nrcresearchpress.com by University of Maine on 09/19/13 For personal use only.
HOOKEI ET AL.
closure error in the 1984 survey. (1) The Geodimeter 140 distance meter has a rated precision of f 5 mm plus 3 ppm, and the accuracy of the HewlettPackard 3805 is assumed to be similar. The standard error in horizontal angle measurements is about f 2" of arc. To accommodate possible additional errors in instrument positioning we will assume an uncertainty of f 3". These uncertainties, along with certain details of the configuration of the stake net, were entered into a program that calculates the standard error in position of each stake (Johnson and Clapp 197I), using theory of error propagation. The resulting errors at TO61 were f 18 mm parallel to the stake line and +94 mm normal to the line. At the divide the corresponding uncertainties were f36 and f 356 mm, respectively. At TO61 this results in uncertainties in velocity of f 25 and f 135 mm-a-' parallel and normal to the stake line, respectively, for surveys 1 year apart. The resulting uncertainty in the magnitude of the velocity is +0.8%. At T020, the most distant point at which velocities were measured, the corresponding values are f 20 mm. year-' parallel to the stake line, f 180 mm. year-' normal to it, and f 1.8% for surveys 2 years apart. (2) A probable upper limit on the magnitude of errors in velocities normal to the stake line can be estimated from study of the azimuths of the horizontal velocity vectors. At TO61 the azimuths appear to vary systematically and gradually through time. The maximum deviation of an azimuth from the mean at this stake is 2.8", which, if attributed entirely to survey uncertainty, would imply an error in position normal to the flow line of about 300 mm. Because this deviation occurred during the 1977- 1978 survey interval, when techniques were least refined, and because the variation in azimuth over the period of study seems to be systematic and may thus be real, the uncertainty in subsequent surveys is believed to be lower. Eliminating 1977 from the above analysis reduces this uncertainty to about IfI 120 rnrn, and allowing for a systematic change in azimuth through time reduces it still further to about half that value. Farther out along the flow line a change in azimuth of 12" between 1980- 1982 and 1982- 1984 at TO20 suggests a probable uncertainty of f 0.5 m in position normal to the flow line. As the azimuth between 1982 and 1984 seems more consistent with Holdsworth's (1975) results from 1970- 1971 and with that of other stakes on the flow line, the error is tentatively attributed to the 1980 survey. (3) A least-squares solution of the 1984 closed traverse, involving 25 survey points and 30 instrument setups, yielded an uncertainty at the divide of f 3 0 mm parallel to the stake line and f500 mrn normal to it. The former is consistent with the estimates given above. The latter seems a little high. The constancy of the azimuths of the horizontal velocity vectors suggests, with a couple of exceptions, that the uncertainty may be less than half this amount.
1561
Vertical velocities The uncertainties in vertical position were analyzed more rigorously. The procedure used was to treat each up-slope or down-slope vertical angle measurement and the associated distance measurement as an independent determination of the difference in elevation between two points. In calculating this elevation difference a standard curvature and refraction correction, AH = 0.06774D2, was applied. In this relation AH is the correction in metres and D is the horizontal distance in kilometres. The correction is added for up-slope measurements and subtracted for down-slope measurements (as long as vertical angles are sufficiently large). The uncertainty i n an individual measurement and the resulting standard error in the mean were then calculated from these two or more independent measurements of the elevation difference, using standard procedures of error analysis. When up-slope and down-slope vertical angles are measured under the same atmospheric refraction conditions, the average difference in elevation obtained from the two measurements is the true difference. Applying the above curvature and refraction correction does not change this average difference and thus affects the resulting mean value only when up-slope and down-slope measurements are not paired. The principal reason for applying the correction was to obtain an objective, though approximate, measure of the uncertainty in the elevation difference. The uncertainty in the elevation of any given stake was calculated, using standard procedures, as the square root of the sum of the squares of all preceding elevation-difference errors along the traverse line. The uncertainty in vertical velocities was calculated as the square root of the sum of the squares of the uncertainties in stake elevations in successive years. These uncertainties are plotted in Figs. 2c and 2d). The true uncertainty in any given elevation-difference measurement is due to a combination of the uncertainty in the vertical angle measurements, estimated from reproducibility of repeated measurements to be f 2" or better, and the uncertainty due to changes in atmospheric refraction between up-slope and down-slope measurements. As surveys were done when the weather was generally stable, changes in refraction during the 1 -2 h that normally elapsed between up-slope and down-slope measurements were probably small. Larger changes may have occurred when the survey was interrupted for a day or longer. Because the uncertainties, for the most part, are consistent with slightly more than a f 2 " uncertainty in the vertical angle measurements, changes in refraction do not appear to have increased the error appreciably.