Frost Sensitivity of Opuntia ficus-indica and O. robusta in a Semiarid Climate of South Africa♦ Hennie A. Snyman1 Department of Animal, Wildlife and Grassland Sciences P.O. Box 339, University of the Free State, Bloemfontein 9300, South Africa e-mail:
[email protected] Herman J. Fouché
Agricultural Research Council, Range and Forage Institute P.O. Box 339, University of the Free State, Bloemfontein 9300, South Africa Paul L. Avenant Department of Agriculture, Directorate Land Use and Soil Management P/Bag X120, Pretoria 0001, South Africa Clement Ratsele 2 Department of Animal, Wildlife and Grassland Sciences P.O. Box 339, University of the Free State, Bloemfontein 9300, South Africa 1
2
Corresponding author Present address: Department of Livestock Services, Private Bag A82, Maseru 100, Lesotho
ABSTRACT There is a lack of information on the adaptability of different spineless cactus-pear cultivars under a range of environmental conditions. A study was conducted to evaluate the cold/frost tolerance of 10 cultivars of Opuntia ficus-indica (L.) Miller and one cultivar of O. robusta Wendl. over two growing seasons (2001/2002 to 2002/2003) in a semiarid climate of central South Africa. The cultivars of O. ficus-indica included Algerian, Gymno Carpo, Morado, Nudosa, Roedtan, Sicilian Indian Fig, Tormentosa, Van As, X28 and Zastron. The species O. robusta was represented by the cultivar Monterey. Frost damage was estimated visually, integrating the individual cladode damage over the entire plant. Frost damage only occurred in spring (late-seasonal frost: August to October) after a combination of frequent successive nights of freezing temperatures (between -2.06 and -9.6oC) when the plants already started sprouting. In winter, during dormancy, no plants suffered any frost damage at freezing temperatures as low as -8oC. For the one-year-old plants (2001/2002 season), Zastron suffered the most frost damage of all cultivars, with Monterey and X28 most tolerant to freezing temperatures. Algerian, Sicilian Indian Fig, Van As and X28 suffered 100% frost damage for the two-year-old plants (2002/2003 season). For the same season, frost damage to Tormentosa and Roedtan was 98%, 97% for Nudosa, 96% for Morado, and 95% for Gymno Carpo. The remaining two cultivars also suffered frost damage but to a lesser degree (Monterey 41% and Zastron 85%). The reason cactus-pear cultivars were killed can be debated, as there are other successful cactus-pear plantations in the study area. It is believed that freezing temperatures during springtime did not single-handedly cause the death of the cactus-pear plants, but water stress, plant health, and plant phonological stage could also have a bearing on that. To successfully cultivate cactus pear, whether for fodder or fruit production, it is important to select areas that are not prone to severe and late-season frost. Keywords: Frost damage, Opuntia ficus-indica, O. robusta, phonological stage, plant health, semiarid, water stress
♦
Received 22 January 2007; Accepted 21 April 2007.
J. PACD – 2007
1
1. INTRODUCTION Developing countries of the world are facing huge challenges in providing enough food for their everescalating populations of people and animals. In the arid and semiarid regions of Southern Africa, where annual rainfall ranges from 150 to 300 mm, animal feed scarcity is also common (De Kock, 1965; Snyman, 1998, 2004a). The stock industry suffers major losses as a result of shortage of food during droughts and harsh winters in these areas. The Opuntia cactus is a xerophyte of about 200 to 300 species (Moßhammer et al., 2006) which grows mainly in arid and semiarid zones, is due to their remarkable genetic variability, ecologically adapted to fill this changing gap in feed scarcity. Cactus pear is also a drought-resistant fruit crop (Brutsch, 1997; Gugliuzza et al., 2000; Ratsele, 2003; Galizzi et al., 2004). In many areas cactus-pear fruit is an important food source for satisfying the nutritional needs of people in their countries of origin (Schirra, 1996; Le Houérou, 1996) for about 3 to 4 months of the year (Inglese et al., 1995; Potgieter, 1995). Knowledge of its chemical composition, nutritional value and effect on human health has lead to a recent increase in the consumption of cactus pear (Livrea and Tesoriere, 2006; Moßhammer et al., 2006). There is still scope for increased production on commercial scale for local and export markets of cactus-pear fruit (Feugang et al., 2006). Prices obtained for cactus-pear fruit on the national fresh produce markets of South Africa for example, compare very favorably with those of more common fruits, such as apple, peach, and orange (Brutsch, 1994; Snyman, 2003). The value of spineless cactus pear in subsistence agriculture has been well documented (Le Houérou, 1992a; Brutsch, 1979, 2000; Barbera, 1995). In the future, declining water resources and global climate change may even increase Opuntia spp. importance as an effective food production system including both fruits and vegetable parts (Stintzing and Carle, 2005; Moßhammer et al., 2006). Cactus-pear species differ with respect to yield, quality, and also in sensitivity to biotic and abiotic factors, which may affect growth and productivity (Pimienta-Barrios et al., 1993; Barbera et al., 1993; Le Houérou, 1996; Wang et al., 1997; Mizrahi and Nerd, 1999; Lahasasni et al., 2003; 2004; Snyman, 2004b; Felker et al., 2005). Although the decade of the 1990’s has seen great expansion in plant physiology and orchard management of cactus pear (Nobel, 1997; Felker and Inglese, 2003), still little horticultural research has been devoted to its productivity under different environmental conditions and management systems (Inglese, 1995; Snyman, 2007). It is increasingly commercialized (Felker and Inglese, 2003) and there is, therefore, a need to evaluate different characteristics to improve the farmer’s selection of cultivars and productivity (Wang et al., 1997; Oelofse, 2002). Cold or frost tolerance of a given cactus-pear species is difficult to assess in a precise way as it depends on a number of local factors (Nobel 1988, 1991, 1994, 2001; Le Houérou 1994, 1996; Valdez-Cepeda et al., 2001). According to Le Houérou (1994) there are no serious cold tolerance problems involved for cactus pear in most arid and semiarid areas. In contrast, Guevara and Estevez (2001) suggested that the cold temperatures of winter are the major limitation to cultivation of cactus pear in some areas. There is, therefore still a need for more intensive studies on the adaptability of this plant under different climatic conditions. Hybridization of cold-tolerant native species with highly productive but cold-sensitive commercial species should be a major objective of breeding programmes to expand cultivation of Opuntia (Gregory et al., 1993, Nobel and Loik, 1993; Mizrahi et al., 1997, Wang et al., 1997; Mondragón-Jacobo and Perèz-González, 2000; Valdez-Cepeda et al., 2001). The most important Opuntia cultivars are generally irreversibly damaged at temperatures of –5 to –12oC (Nobel, 1990; Nobel and Loik, 1993). Cold hardiness of Opuntia spp. used for fruit, forage, or vegetable production has also been reported by Russell and Felker (1987); Gregory et al. (1993), Parish and Felker (1997), Wang et al. (1997) and Guevara et al. (2000). According to Le Houérou (1971; 2002) Opuntia ficus-indica is among the mildly cold-tolerant species (m > 3oC) and O. robusta is a fairly frost tolerant species (m > 1oC). The aim of this study was, therefore, to evaluate the frost or cold tolerance of different Opuntia ficus-indica and O. robusta cultivars in a semiarid climate of central South Africa.
2
J. PACD – 2007
2. MATERIALS AND METHODS 2.1. Site Description The research was conducted on the farm Welgegund (28o 53′ S; 26o 56′E; altitude 1,304 m) near a small town called Verkeerdevlei, Free State Province, in South Africa, 60 and 90 km northeast of Glen Agricultural College and Bloemfontein, respectively. Other climatic data used in this study was obtained from a new weather station established in January 2001 close to the study area. Long-term data was obtained from Glen weather station (70 years data) (Botha, 1964) and stored on the national climatologically weather database of the Institute for Soil, Climate and Water of the Agricultural Research Council (ARC) in South Africa. All climatic data were obtained from automatic recorders on an hourly basis. The months December, January, and February are the hottest months, with long-term mean temperatures of 21.9, 22.7, and 22.0°C, respectively (Table 1). In general the winters are cold with mean minimum temperatures for the months June and July lower than 0°C. The first frost can be expected as early as 23 March (Botha, 1964). The mean frost set-in date is 28 April and last date that frost can be expected is 3 October (Botha, 1964). The variation in the end date of frost is greater than that of the frost set-in date (Botha, 1964). According to Botha (1964), the average maximum temperatures for Glen are 23.8, 20.2, 17.5, 16.4, 19.6, 22.8, and 25.8°C for April, May, June, July, August, September and October, respectively, and the average minimum temperatures for these months are 7.4, 2.4, –1.3, –2.4, 0.8, 4.7, and 8.3°C, respectively, over the long-term (Table 1). Table 1. The long-term mean shelter and surface temperatures of Glen for the different months (National climatologically weather database of the Institute for Soil, Climate and Water 1922-1990) (Botha, 1964). Month
Mean Maximum Temperature (oC)
Mean Minimum Temperature (oC)
Mean Temperature (oC)
Mean Grass Minimum Temperature (oC)
July
17.3
–1.6
7.7
–4.4
August
20.4
0.7
10.5
–2.3
September
24.5
4.8
14.4
2.1
October
27.1
9.2
18.0
5.9
November
28.1
11.7
19.9
8.8
December
30.0
13.9
21.9
11.1
January
30.6
15
22.7
12.2
February
29.7
14.6
22.0
12.1
March
27.2
12.3
19.7
9.8
April
23.8
7.4
15.5
4.7
May
20.2
2.4
11.4
0.0
June
17.5
–1.3
7.9
–3.8
J. PACD – 2007
3
The experimental site is located in the semiarid (summer mean average rainfall of 548 mm) region of South Africa. The probability of rainfall higher than 50% is expected from October to April. The highest rainfall of 85 mm occurs in March. The rainfall reliability is only for seven months higher than 50%, with the highest reliability of 58% in January (Botha, 1964). The highest mean rain days of 10 are also in March (Table 2). Table 2. The long-term rainfall characteristics of Glen for the different months (National Climatological Weather Database of the ARC, Institute for Soil, Climate and Water 1922-1990) (Botha, 1964). Mean Rainfall (mm)
Reliability (%)
Mean Rain Days 1914-1964 (Botha, 1964)
July
8.7
20.63
2.1
August
11.8
18.13
2
September
19.1
20.68
2.6
October
47.1
51.15
5.5
November
64.3
52.41
8.2
December
66.5
51.55
8.1
January
81.8
58.01
9.8
February
82.4
57.81
9.6
March
85.2
56.15
10.1
April
52.3
51.34
6.4
May
19.3
36.01
4.6
June
9.5
27.82
2.0
Month
The soil is a sandy loam of the Valsrivier form (Aliwal family-11220) (Soil Classification Working Group, 1991). The average soil texture for 0-300 mm, 300-800 mm and deeper than 800 mm were 32%, 54%, and 56% clay, respectively. The decrease in sand percentage, phosphorus and zinc, and increase in clay percentage, electrical conductivity (EC), pH, Ca, Mg, K, and Na with increasing depth of the soil is not unusual (Table 3). Soil samples for laboratory analysis were collected from the three different horizons (0 to 300, 300 to 800 and >800 mm). Samples for analysis were obtained from two blocks (A and B) of 1.5 ha each, using a soil auger. According to Wessels (1988), the optimal levels of macroelements in the soil for cactus plants should be 150 mg kg-1 for K, 12-15 mg kg-1 for P, and 80-100 mg kg1 for Mg. The values for K and Mg (Table 3) were above the recommendations while P was low compared to the record provided by Wessels (1988).
4
J. PACD – 2007
Table 3. Laboratory soil analysis for sand, clay, electrical conductivity (EC), soil acidity (pH), calcium (C), magnesium (Mg),potassium (K), sodium (Na), phosphorus (P) and zinc (Zn) for different depths in the experimental site at Welgegund. Depth (mm) Profile (0-300) Profile (300-800) Profile (>800)
Clay %
Sand %
EC mSm-1
pH
Ca mg kg-1
Mg mg kg-1
K mg kg-1
Na mg kg-1
Zn P mg kg-1 mg kg-1
32.00
68.00
12.50
4.40
761.50
324.50
350.00
31.00
9.52
0.45
54.00
46.00
19.00
5.95
1823.50
920.50
106.00
96.50
1.04
0.38
56.00
44.00
61.00
7.65
9298.50
1430.50
144.00
232.00
0.18
0.0
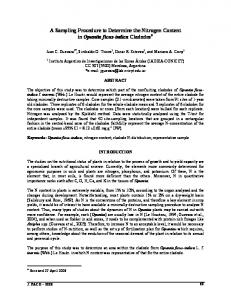
2.2. Treatments The cactus-pear plant material (one-year-old cladodes) used during the study was collected on 8 August 2001 from Gillemberg Farms (Mokopane) in the Limpopo province of South Africa. Cladodes were washed with a Parathion dosage (60 ml per 100 litres water) to reduce possible incidences of cochineal infection before planting. The two Opuntia species used were Opuntia ficus-indica (L.) Miller and O. robusta Wendl. The 10 cultivars for the first-mentioned species were Algerian, Gymno Carpo, Morado, Nudosa, Roedtan, Sicilian Indian Fig, Tormentosa, Van As, X28 and Zastron (Figure 1). Monterey was the only cultivar used for O. robusta (Figure 1). The selection of cultivars was based on their adaptability and production potential according to research and literature (Potgieter, 1995). Opuntia ficus-indica is believed to have a higher cladode production than O. robusta (Guevara et al., 2000; Oelofse, 2002; Snyman, 2005, 2007). Opuntia ficus-indica can be used either for fruit or cladode production. Opuntia robusta is traditionally a fodder plant compared to O. ficus-indica.
J. PACD – 2007
5
NODOSA
X28
MONTEREY
Figure 1. Internal and external views of longitudinal sections of fruit of different cultivars studied. The experimental layout was a randomized block design consisting of cultivar, replicated 6 times (3 times per block) on 66 plots. Each plot consisted of 20 plants, planted in 2 rows of which 10 plants were randomly selected, marked, and used as data plants. The cladodes were spaced 5 m apart between rows and 2 m apart within the row. The plant density was 1,000 plants per hectare. Cladodes were planted on 18 October 2001 (70 days after cut) on a deeply tilled (300 to 400 mm) and well-disked soil, with no impervious soil layers present. Therefore, no deep ripping was done. No visible dehydration process occurred in the cladodes before planting. The cropping history of the field was maize and wheat
6
J. PACD – 2007
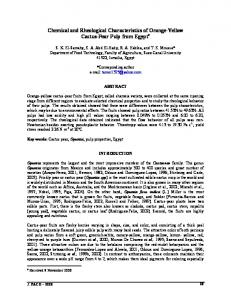
cultivation over a few years. For a whole year, no cultivation took place before starting the cactus-pear study. The cladodes were planted upright, one-third into the soil. The row direction was North-South. Liming to raise the soil pH, as per laboratory analysis used during the study, was 4 t (Calcite lime) per hectare. Super phosphate was added at 300 kg ha-1 (30 kg P ha-1), with 75 kg ha-1 of N-fertilizer applied with establishment. Unfortunately, no topdressing of fertilizer was applied over the study period due to management problems. A tractor-drawn disc cultivator was used to remove the weeds between the rows to reduce competition for water and nutrients. Chemical weed control (on plant row and also between rows) in the second season of the study was done using glyphosphate. To ensure that the chemical did not reach the plants, the cactus plants were covered by plastic containers before hand-spraying the herbicide. 2.3. Data Collection As part of a larger study on the vegetative measurements, frost damage of cladodes was visually estimated, integrating the individual cladode damage over the entire plant and expressed as percentage. A 100% frost damage indicated that the plant was dead to ground level and 0% damage indicated that the plant had suffered no damage. These values were used to indicate the susceptibility of cultivars to frost damage. Frost damage was estimated about one month after the freeze, i.e., when the extent of necrosis from the freezing weather was fully expressed. Frost damage was observed three times, namely on 16 August 2002, 4 October 2002, and between 15 and 27 August 2003. Although this research project was planned for longer than a few years, the plants were, unfortunately, totally killed by frost after only two growing seasons (2001/2002 to 2002/2003). 2.4.Statistical Analysis All data were analyzed using a one-way of variance ANOVA analysis (Winer, 1974) at 95% confidence level. Data for different frost dates and/or years were analyzed separately. The Number Cruncher Statistical System (2000) software package was used in the analysis (Hintze, 1997). 3. RESULTS 3.1. Climate The monthly mean maximum temperatures for April, May, and June of 26.3, 20.1, and 16.3oC in the 2001/2002 growing season and 27.1, 20.4, and 17.9oC in the 2002/2003 growing season, respectively (Figure 2), recorded during the study (Figure 2), were not abnormal, compared to the long-term averages (Table 1). During the study, the recorded mean monthly minimum temperatures of –0.4, –3.3 and –0.1oC in the 2001/2002 growing season for the months April, May, and June, respectively, were below the longterm levels. During the 2002/2003 growing season, monthly minimum temperatures of 10.1, 2.1, and 2.9oC for April, May and June were recorded, which are not unusual when compared to the long-term readings (Table 1). For springtime (August to October) the recorded mean monthly minimum temperature of –3oC in the 2003/2004 growing season for the month August (Figure 2), is far below the 0.7oC longterm level (Table 1). In contrast, for the month of August 2002 the recorded monthly minimum temperature was 5oC (Figure 2) comparing to the only 0.7oC long-term value (Table 1). The number of hours of freezing weather and the absolute minimum temperatures for the coldest months, including minimum temperatures up to ≤–9oC (3oC intervals) for the 2001/2002 and 2002/2003 seasons, are shown in Table 4. Freezing weather totaled 343 hours in 2001/2002 and 447 hours in 2002/2003. There were more hours with temperatures of ≤–6oC in the 2002/2003 season than the 2001/2002 season. Details on the temperatures attained specifically during the late-seasonal freezes and the freezing periods that occurred with frost damage in 2001/2002 and 2002/2003 seasons are presented in Table 5.
J. PACD – 2007
7
Temperature °C
2001/2002 35.0 30.0 25.0 20.0 15.0 10.0 5.0 0.0 -5.0 Jul
Aug Sep Oct
Nov Dec Jan Feb Mch Apr May Jun Month
Ave temperature Ave min temperature
Ave max temperature
Temperature °C
2002/2003 35.0 30.0 25.0 20.0 15.0 10.0 5.0 0.0 -5.0 Jul
Aug Sep
Oct
Nov Dec Jan Feb Mch Apr
May Jun
Month
Ave temperature Ave min temperature
Ave max temperature
Temperature °C
2003/2004 35.0 30.0 25.0 20.0 15.0 10.0 5.0 0.0 -5.0 Jul
Aug Sep
Oct
Nov Dec
Jan Feb Mch Apr
May Jun
Month
Ave temperature Ave min temperature
Ave max temperature
Figure 2. Mean monthly temperatures (oC) of study site for the 2001/2002, 2002/2003, and 2003/2004 growing seasons.
8
J. PACD – 2007
Table 4. Duration of freezing temperatures (hours) and absolute minimum temperatures occurring at the study site in 2001/2002 and 2002/2003 seasons. Number of Hours of Occurrence of Temperatures 0°C –3°C –6°C –9°C
Year 2002 May June July August September October 2003 May Jun Jul Aug Sep
Absolute Minimum Temperature (°C)
34 100 189 16 0 4
3 15 67 2 0 0
0 0 7 0 0 0
0 0 0 0 0 0
–3.3 –4.7 –7.5 –3.7 0.6 –2.1
33 196 153 57 8
4 63 60 31 0
0 11 2 11 0
0 0 0 3 0
–3.6 –8.1 –6.3 –9.6 –1.9
Table 5. Freezing temperatures occurrence with frost damage during springtime for the 2001/2002 and 2002/2003 seasons. Date 16/08/02 04/10/02
Number of Hours of Occurrence of Temperatures 7 2 0 0 3 0 0 0
15/08/03 * 16/08/03 * 17/08/03 * 18/08/03 * 19/08/03 * 20/08/03 * 21/08/03 12 22/08/03 8 23/08/03 7 25/08/03 8 27/08/03 8 * not available
J. PACD – 2007
* * * * * * 9 8 2 3 5
* * * * * * 6 5 0 0 0
* * * * * * 3 0 0 0 0
Absolute Minimum Temperature (°C) –3.69 –2.06 –4.98 –3.93 –8.07 –9.63 –8.05 –3.34 –9.63 –8.05 –3.34 –4.25 –4.93
9
The total rainfall of 677 mm recorded during the 2001/2002 growing season (Figure 3) was 24% higher than the long-term (547.5 mm) for Glen (Table 2 and Figure 3). The total rainfall of 93.7 mm recorded for April, May, and June during the first season of the study (2001/2002) was also higher (16%) than the long-term means for the same months. During the 2002/2003 growing season, the total rainfall of 484.1 mm was lower (12%) than the long-term levels for Glen. The total rainfall of only 5.3 mm for April, May, and June received during the 2002/2003 growing season, was far below (94%) the long-term means for the same months.
2001/2002
Rainfall (mm)
200.0 150.0 100.0 50.0 0.0 Jul
Aug Sep Oct
Nov Dec Jan
Feb Mch Apr May Jun
Month Total rainfall
Ave rainfall Glen
2002/2003
Rainfall (mm)
100.0 80.0 60.0 40.0 20.0 0.0 Jul
Aug Sep Oct
Nov Dec Jan
Feb Mch Apr May Jun
Month Total rainfall
Ave rainfall Glen
Figure 3. Long-term rainfall (mm) for Glen and total rainfall (mm) at study area for the 2001/2002 and 2002/2003 growing seasons.
10
J. PACD – 2007
3.2. Frost Damage The average percentage frost damage per plant for the different cultivars and frost damage dates are illustrated in Table 6. During both seasons some cultivars were significantly more sensitive to frost damage than the others. For the 2001/2002 season, Zastron suffered the most (P