832 Orthopedics & Biomechanics
Changes in Running Mechanics and Spring-Mass Behaviour during a 5-km Time Trial
Affiliations
Key words ▶ leg spring behaviour ● ▶ stride parameters ● ▶ stiffness ● ▶ pacing strategy ● ▶ middle distance running ●
O. Girard1, G. P. Millet2, J. Slawinski3, S. Racinais1, J. P. Micallef4 1
Research and Education Centre, ASPETAR – Qatar Orthopaedic and Sports Medicine Hospital, Doha, Qatar ISSUL, Institute of Sport Sciences, Department of Physiology, Faculty of Biology and Medicine, University of Lausanne, Lausanne, Switzerland 3 CeRSM (EA 2931), Faculty of Sport Sciences, University of Paris Ouest Nanterre la Defense, Nanterre, France 4 Faculty of Sport Sciences, University of Montpellier 1, Movement to Health (M2H), EuroMov, Montpellier, France 2
Abstract
▼
Research into the biomechanical manifestation of fatigue during exhaustive runs is increasingly popular but additional understanding of the adaptation of the spring-mass behaviour during the course of strenuous, self-paced exercises continues to be a challenge in order to develop optimized training and injury prevention programs. This study investigated continuous changes in running mechanics and spring-mass behaviour during a 5-km run. 12 competitive triathletes performed a 5-km running time trial (mean performance: ̴17 min 30 s) on a 200 m indoor track. Vertical and anterior-posterior ground reaction forces were measured every 200 m by a 5-m long force platform system, and used to determine spring-mass model characteristics. After a fast
Introduction accepted after revision October 05, 2012 Bibliography DOI http://dx.doi.org/ 10.1055/s-0032-1329958 Published online: April 2, 2013 Int J Sports Med 2013; 34: 832–840 © Georg Thieme Verlag KG Stuttgart · New York ISSN 0172-4622 Correspondence Olivier Girard, PhD Exercise and Sport Sciences ASPETAR – Qatar Orthopaedic and Sports Medicine Hospital Doha POBox 29222 Qatar Tel.: + 974/413 2576 Fax: + 974/413 2034
[email protected]
▼
During running the leg can be described as springs loaded by the runner’s body mass, constituting the “spring-mass model” (SMM) [17]. Because they influence the regulation of temporal and kinematic variables, leg stiffness (kleg, ratio of the vertical ground reaction force to the leg-spring compression at middle of the stance phase) and vertical stiffness (kvert, ratio of the maximal force to the vertical downward maximal displacement of the centre of mass (CM)) are often used for characterization of one runner’s kinetics and kinematics [2]. During the last few years, an increasing number of studies have specifically investigated the impact of fatigue development on changes in SMM parameters. A large focus has been on repeated sprint protocols [9, 10, 18, 21] and constant velocity runs of lowto severe-intensity, performed in the laboratory environment [7, 15, 16, 19] or under field conditions [20, 27].
Girard O et al. Changes in Running Mechanics … Int J Sports Med 2013; 34: 832–840
start, running velocity progressively decreased (− 11.6 %; P < 0.001) in the middle part of the race before an end spurt in the final 400–600 m. Stride length (− 7.4 %; P < 0.001) and frequency (− 4.1 %; P = 0.001) decreased over the 25 laps, while contact time (+ 8.9 %; P < 0.001) and total stride duration (+ 4.1 %; P < 0.001) progressively lengthened. Peak vertical forces (− 2.0 %; P < 0.01) and leg compression (− 4.3 %; P < 0.05), but not centre of mass vertical displacement (+ 3.2 %; P > 0.05), decreased with time. As a result, vertical stiffness decreased (− 6.0 %; P < 0.001) during the run, whereas leg stiffness changes were not significant (+ 1.3 %; P > 0.05). Spring-mass behaviour progressively changes during a 5-km time trial towards deteriorated vertical stiffness, which alters impact and force production characteristics.
In typical athletic events; i. e., middle distance runs, however, pacing is freely chosen in order to ensure the best possible performance outcome. To date, only a few studies have attempted to characterize changes in SMM taking place over the course of strenuous runs with self-selected intensity [14, 29]. For instance, it has been noted that maintaining a higher stride frequency through retaining a higher kvert would be necessary in order to keep running velocity (Vforward) high at later stage of a 400-m sprint [14], while no variations in kleg or kvert have been detected following a 2000-m maximal run [29]. In their study, however, Slawinski et al. [29] measured the discrepancy in kleg and kvert between pre vs. post exercise measures at control velocities that actually differed from those recorded during the exhaustive run. This approach provides no information regarding the time course of adjustments in leg spring behaviour to counteract fatigue during typical middle-distance runs. Previous studies have documented that changes in running
This document was downloaded for personal use only. Unauthorized distribution is strictly prohibited.
Authors
Orthopedics & Biomechanics
times at each kilometre were given to the athletes with verbal encouragement during the test. All tests were performed at the same time of the day (between 4 and 8 pm) with the air temperature constant at 20–22 °C.
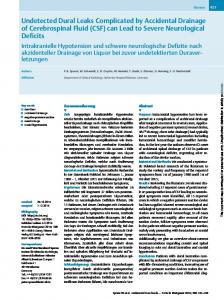
Data collection Once per lap (200 m), the vertical and anterior-posterior components of the ground reaction forces (GRF) were measured by a 5-m-long force platform system (natural frequency ≥ 200 Hz) ▶ Fig. 1a). The system consisted of 5 individual force plates (● (1.00 m x 1.00 m) connected in series, covered with a tartan mat, and levelled with the stadium track. Each force platform was equipped with Kistler piezoelectric sensors (KI 9067, Kistler, Wintertur, Switzerland). Before every test, GRF signals were gauged using the manufacturer’s recommended procedure (sampling frequency: 500 Hz) using MP100 hardware (Biopac Systems Inc., Santa Barbara, CA, USA) and stored for analysis with commercially available software (Acqknowledge 3.6.7, Biopac Systems Inc, Santa Barbara, CA, USA). Concomitantly, instantaneous running velocity (Vforward in m.s − 1) of the subjects on the force platform system was measured by a radar Stalker ATS SystemTM (Radar Sales, Mineapolis, MN, US) at a sampling frequency of 35 Hz. The radar device was placed on a tripod at a height of 1 m corresponding approximately to the height of the subject’s CM.
Data analyses Methods
▼
Subjects 12 male triathletes (mean ± SD: age = 21.4 ± 2.6 yr, weight = 70.2 ± 6.4 kg, stature = 180.7 ± 6.0 cm; maximal oxygen uptake = 62.9 ± 8.3 ml.min − 1.kg − 1 and its associated velocity (v-VO2max) = 1 9.0 ± 1.2 km.h − 1), competing at a regional to national level were recruited to participate in the study. Selection was based on history of training volume (≥ 12 h a week; average of 18.9 ± 4.6 h. wk − 1) and best performance for the 5-km race (≤ 20 min; average of ~17 min 02 s) during the previous 3 months. A medical questionnaire was administered to exclude subjects with any known lower limbs injury in the past 4 months. Written informed consent was obtained from each participant. All procedures complied with the Declaration of Helsinki regarding human experimentation and the project was reviewed and approved by the local ethics committee before its initiation. The study was conducted in full accordance with ethical standards for the treatment of participants recommended by the journal [12].
Procedures 2 runs were required for each subject. The first run was carried out as a graded exercise test (3-min stages) to determine maximal oxygen uptake and v-VO2max using the same procedure and equipment as described previously [27]. The second run, performed 2–3 days later, was a 5-km running time trial on a 200 m indoor tartan track. This was preceded by a standardized warmup according to a regular pre-event 5-km warm-up (15 min of jogging, 30 m athletic drills, stretching, 3 × 50 m sprints realized at the 5-km start velocity) and followed by a 3 min recovery period before the onset of the test. Athletes were free to select their own pace in order to realize the best performance (i. e., the shortest time possible) and to run as in a competition. Split
Each lap included 2–4 ground contacts on the force platform system (according to the step length and the separated distance of the first foot contact from the entrance of the force plate area). For each ground contact, amplitude of active peak of vertical GRFs (Fzmax in kN) was determined and data of the 2 highest consecutive steps (i. e., one stride for each 200 m interval) were ▶ Fig. 1b). used for final analysis (●
Spatiotemporal parameters Contact (tc in ms) and aerial (ta in ms) times were defined when the vertical GRFs were more than and less than 10 N, respectively [9, 27]. The time elapsed between 2 onsets of vertical GRFs generated by the same foot was defined as the total stride duration. Swing time was determined by subtracting tc from the total stride duration. Stride frequency (= 1/(tc + ta), in Hz) and stride length ( = Vforward/stride frequency, in m) were calculated. Active peak amplitude of vertical GRFs, peak braking (Fymax − in N) and push-off (Fymax + in N) forces were determined. Anterior-posterior GRFs were used to measure the duration of the braking and push-off phases during ground contact when the anterior-posterior GRF signal was negative and positive, respectively. Vertical, braking and push-off impulse values were determined from the product of the effective force applied to the running surface and foot-ground contact times of these respective phases.
Spring-mass properties The SMM initially described by McMahon and Cheng [17] was used to investigate the main mechanical parameters characterizing the lower limbs behaviour during running. The vertical maximal downward displacement of CM (Δz in m) was determined by double integration of vertical acceleration of CM over time during ground contact [4]. Vertical stiffness (kvert in kN.m − 1) was calculated as follows: kvert = Fzmax/Δz
(1)
Girard O et al. Changes in Running Mechanics … Int J Sports Med 2013; 34: 832–840
This document was downloaded for personal use only. Unauthorized distribution is strictly prohibited.
mechanics (e. g. anterior-posterior and vertical braking forces, peak leg impact accelerations and impact attenuation) occurred during the course of intense constant-load runs (i. e., durations < 45 min; intensity > ventilatory threshold), resulting in fatigue-induced lowered tolerance to ground impact [6, 8, 24]. Investigating changes in stride characteristics during a 5 km time trial; i. e., a strenuous exercise in which work rate is free to vary, Nummela et al. [23] reported that the decrease in velocity was strongly correlated with the increase in the ground contact time. To our knowledge, however, no study has systematically quantified how spring-mass behaviour of the lower limbs – as directly determined from force plate recordings – change during such running exercise. The aim of this study was to investigate continuous changes in running mechanics and leg-spring behaviour over the course of a 5-km time trial. Pacing strategies adopted by elite runners during 5-km races [30] and time trials [1, 22, 23] are characterized by fast starts and a period of slower running during the middle distance of the race, followed by a significant increase in velocity towards the end [30]. Accordingly, we hypothesized that temporal, kinematic and kinetic parameters associated with the spring-mass stiffness would be related with the alterations in running velocity during the 5-km run. A better understanding of this pacing strategy is a challenge to develop an optimized training program, especially in triathlon because the overall finishing position is strongly determined by running performance [31].
833
a
Fig. 1 Experimental protocol a, typical curves obtained at the beginning (solid line) and toward the end (dotted line) of the 5-km time trial b. a Illustration of the 200 m runway with force plate emplacements. b Vertical ground reaction forces (GRF), centre of mass (CM) vertical displacement, anterior-posterior GRF and CM horizontal velocity. Fzmax is the amplitude of active peak of vertical GRF. Fymax − and Fymax + are the braking and push-off peaks of anterior-posterior GRFs. tc and ta, Hmin and Hmax, Vmin and Vmax are contact and aerial times, minimal and maximal relative heights of the CM, minimal and maximal CM horizontal velocities. Double integration in the time domain of the acceleration-time function provided an estimate for the CM vertical displacement during ground contact.
5 km run time trial
Photocell gates
Radar
200 m indoor tartan track with banked corner
1 2 3 4 5
1
2
3
4
5
Ground reaction forces (5 m-long force platform system) for two consecutive steps
b 1 500 1 000
0
tc
ta 4
Hinitial
2
Hmax
0
∆z
–2
Anterior-posterior GRF (N)
–4
Hmin
Fymax+
800
CM vertical displacement (cm)
Fzmax
500
400 0 –400 –800
Fymax–
Vinitial
0.2 –0.2
Vmax
–0.6 –1.0
Vmin
–1.4 0
100
200
300
400
500
600
CM horizontal velocity (m.s–1)
Vertical GRF (N)
Total stride 2 000
700
Time (ms)
It was assumed that the vertical velocity of CM was zero at the time of peak force. Vertical velocity would be zero if the slope of the vertical average velocity of the CM equaled zero, which would occur at the point of peak displacement of CM during ground contact. Thus it was assumed that the peak CM vertical displacement coincided with Fzmax [7]. Leg stiffness (kleg in kN.m − 1) was calculated as the ratio of Fzmax to the maximal leg spring compression (ΔL in m); both occurring at mid-stance: kleg = Fzmax/ΔL
(2)
ΔL was calculated from values of the maximal vertical downward CM displacement during contact (Δz in m), running velocity (Vforward in m.s − 1), contact time (tc in s), and initial leg length (L0; great trochanter to ground distance in a standing position was determined from subject’s stature as L0 = 0.53 stature; [32]): ΔL = Δz + L0(1 − cosθ)
(3)
Girard O et al. Changes in Running Mechanics … Int J Sports Med 2013; 34: 832–840
The vertical displacement Δz was calculated by integrating the vertical acceleration twice (constants of integration were calculated according to the methodology proposed by Cavagna [4]). This method relies on 2 assumptions, the first of which is that running speed is constant during ground contact. The second assumption is that the mid-point of the ground contact period can be estimated as occurring at the half leg sweep angle. As pointed out recently [31], this method “that has been used for a wide range of tasks without issues” is recommended when fieldbased measurements are desired (kinematic analysis is not possible [28]). θ was calculated from the contact time (tc), the forward velocity (Vforward), and the L0, according to the following formula: θ = sin − 1(Vforward tc/2 L0)
(4)
where Vforward tc represented the horizontal distance travelled by the CM (in meters) during the contact phase. It is important to note that kleg represents the total stiffness of the runner’s leg during stance, whereas kvert describes the vertical compliance of the running gait [17].
This document was downloaded for personal use only. Unauthorized distribution is strictly prohibited.
834 Orthopedics & Biomechanics
Orthopedics & Biomechanics
Running velocity (km.h–1)
19
* * * * * * * * * * * * * *
17
* * * * * * * * *
16
20 0 40 0 60 0 80 10 0 1 20 0 1 4 00 1 6 00 1 800 2 000 2 20 0 2 400 2 6 00 2 8 00 3 000 3 200 3 400 3 6 00 3 800 4 000 4 2 00 4 400 4 600 4 8 00 5 0 00 00
15
Distance (m)
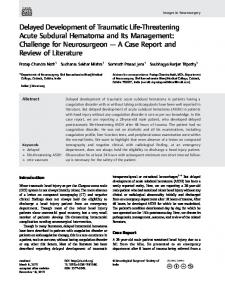
Fig. 2 Running velocity at each 200 m distance intervals during the 5-km time trial. *, P < 0.05, significantly different from the initial 200 m distance interval.
Statistical analysis Data are expressed as means ± SD within the text and displayed as means ± SE in figures. Normal distribution of the data was tested using the Kolmogorov-Smirnov test. Sphericity (homogeneity of covariance) was verified by the Mauchly’s test. When the assumption of sphericity was not met, the significance of the F-ratios was adjusted according to the Greenhouse-Geisser procedure. For all tested variables, the effect of time was determined by a single factor ANOVA for repeated measures across each 200 m intervals. Multiple comparisons were made with the Tukey HSD post hoc test when the Greenhouse-Geisser epsilon correction factor was P > 0.50, or with the Bonferroni post hoc test when the epsilon was P < 0.05. For each ANOVA, partial etasquared (η2) was calculated as measures of effect size (ES). Values of 0.01, 0.06 and above 0.14 were considered as small, medium and large, respectively. Pearson correlation coefficients were used to examine the relations between selected study variables, while each 200 m interval was used as a separate datum point. In addition to measures of statistical significance, the following criteria were adopted to interpret the magnitude of the correlation (r) between test measures: < 0.1, trivial; > 0.1–0.3, small; > 0.3–0.5, moderate; > 0.5–0.7, large; > 0.7–0.9, very large; and > 0.9–1.0, almost perfect. Statistical analyses were undertaken by using the SPSS statistical package (version 18.0, SPSS, Chicago, IL, USA). The level of statistical significance was set at P < 0.05.
Results
▼
Running performance Mean 5-km performance was ~17 min 31 s (ranging from 15 min 58 s to 20 min 42 s). The average Vforward achieved (17.3 ± 0.6 km.h − 1) corresponded to 90.6 ± 3.3 % of v-VO2max. Several phases could be distinguished during the run: Vforward peaked at 18.8 ± 1.5 km.h − 1 (98.6 ± 6.3 % of v-VO2max) during the first lap, and then decreased (F(24,264) = 12.50; − 11.6 %; P < 0.001; η2 = 0.53) continuously down to 16.4 ± 1.6 km.h − 1 (85.9 ± 4.7 % of v-VO2max) ▶ Fig. 2). At the end of the race, V at 4 400 m (● forward increased progressively during the last 600 m to reach 17.7 ± 2.1 km.h − 1 (92.6 ± 7.3 % of v-VO2max) during the final lap. As a consequence relative changes in biomechanical variables during the run were marked as the difference between 200 m and 4 400 m (averaged fastest and slowest laps, respectively) distance intervals.
The changes in stride duration parameters are displayed 2 ▶ Fig. 3: t (F in ● c (24,264) = 3.59; + 8.9 %; P < 0.001; η = 0.44), swing time (F(24,264) = 5.96; + 6.1 %; P < 0.001; η2 = 0.35) together with braking, push-off and total stride durations (F(24,264) = 1.87, 1.79 and 2.37; + 11.0 %, + 10.9 % and + 4.1 %; all P < 0.001; η2 = 0.15, 0.14 and 0.18) progressively lengthened during the run, with ta (F(24,264) = 1.61; − 3.2 %; P < 0.05; η2 = 0.13) decreasing with time. Stride length (F(24,264) = 3.87; − 7.4 %; P < 0.001; η2 = 0.26) and frequency (F(24,264) = 2.32; − 4.1 %; P = 0.001; η2 = 0.17) decreased ▶ Fig. 4). Both peak braking and push-off forces over the 25 laps (● decreased (F(24,264) = 3.98 and 3.26; − 6.8 % and − 14.3 %; all ▶ Fig. 5). Vertical and P < 0.001; η2 = 0.27 and 0.23) with time (● push-off impulses did not show any significant change (F(24,264) = 0.94 and 1.01; + 7.6 % and − 2.4 %; all P > 0.05; all η2 = 0.08), whereas braking impulse decreased significantly (F(24,264) = 2.27; − 1.3 %; P = 0.001; η2 = 0.17) throughout the run ▶ Fig. 5). (●
Spring-mass parameters Peak vertical force (F(24,264) = 2.01; − 2.0 %; P < 0.01; η2 = 0.15) and leg compression (F(24,264) = 1.74; − 4.3 %; P < 0.05; η2 = 0.14) but not CM vertical displacement (F(24,264) = 0.91; + 3.2 %; P > 0.05; η2 = 0.08) decreased from the start to the later parts of the dis▶ Fig. 5). As a result, k tance (● vert decreased (F(24,264) = 3.75; − 6.0 %; P < 0.001; η2 = 0.25) during the run, whereas kleg changes were ▶ Fig. 4). not significant (F(24,264) = 0.76; + 1.3 %; P > 0.05; η2 = 0.07) (● The relationships between Vforward, kleg and kvert and selected ▶ Fig. 6. Most of the impact characteristics are presented in ● observed changes in kvert were associated with altered peak vertical force (r = 0.68, P < 0.05), as opposed to changes in CM verti▶ Fig. 6). Changes in k cal displacement (r = − 0.32, P > 0.05) (● leg were found to be associated with peak vertical force and leg ▶ Fig. 6). compression (r = 0.83 and − 0.64, respectively; P < 0.05) (●
Discussion
▼
This study, presenting a high ecological validity, is the first to use continuous (i. e., 200 m intervals) GRF recordings to document changes in running mechanics and leg-spring characteristics during the course of a strenuous self-paced exercise (i. e., 5-km time trial). The main findings were that i) observed reductions in peak vertical forces together with well-preserved CM vertical displacement during the run resulted in progressively lower kvert values, and ii) kleg remained constant because the reduced peak force is offset by the reduction in leg compression. When the runner is free to adapt his velocity, his natural choice is to progressively decrease his velocity rather than to modify the trajectory of his CM. As a result, progressively longer strides accompanied reductions in force application characteristics during the major part of the run. Remarkable consistent pacing strategies have been observed during 5-km world records runs [30], with the first and the final kilometres of the race being significantly faster than the middle kilometre intervals. Also in line with previous laboratory [1] and field-based [22, 23] studies, our results show that after a fast start, Vforward progressively decreases in the middle part of the race (− 12 % at the 4 200–4 400 m distance interval) before a remarkable increase in the final 400–600 m. This may illustrate a choice made by the runners to voluntarily adjust their pace owing to the remaining trial distance. Girard O et al. Changes in Running Mechanics … Int J Sports Med 2013; 34: 832–840
This document was downloaded for personal use only. Unauthorized distribution is strictly prohibited.
Spatiotemporal parameters
20
18
835
836 Orthopedics & Biomechanics
a 220
b 160
* * * * *
* *
150
* * * *
00
*
*
00 50
46
00
00 42
00
00
38
00
00
34
30
26
00
00 22
18
00 14
20
0
00 50
46
00
00 42
00 38
00
00
00 34
30
00
26
00
22
18
14
10
60
20
00
0
00
0
0
100
0
70
e 715
*
110
0
80
*
120
00
90
*
*
10
*
*
*
130
60
Push-off phase duration (ms)
*
f 575
* * * * *
685
* *
*
* *
*
* *
*
560
670
545
* *
*
* *
* *
* *
* *
0 40 0 60 0 80 10 0 0 12 0 1 400 0 16 0 1 800 0 20 0 0 22 0 0 24 0 2 600 0 28 0 0 30 0 0 32 0 0 34 0 3 6 00 3 800 0 40 0 0 42 0 4 4 00 0 46 0 0 48 0 0 50 0 00
20
00
00
00
50
46
00
00
00
42
38
34
00
30
00
00
26
22
18
00 14
10
60
0
0
00
0
0
*
* * * *
*
*
530
515
Distance (m)
* *
655
20
*
* Swing time (ms)
700
Distance (m)
Fig. 3 Impact characteristics (a contact time, b aerial time, c braking phase duration, d push-off phase duration, e total stride duration, f swing time) at each 200 m distance intervals during the 5-km time trial. *, P < 0.05, significantly different from the initial 200 m distance interval.
The calculation of SMM characteristics (i. e., the effective kvert and kleg) has been widely used during the last decade to characterize the overall behaviour of the lower limb during running and sprinting. While a major focus of available studies to date has been on running tasks performed at a constant velocity [7, 16, 19, 27], less is known on the kinetics of spring-mass behaviour changes during self-paced runs [14]. In the 400 m sprint, it has ben reported that kvert and Vforward peaked at the 50-100 m interval and consistently decreased from the middle to the last part of the sprint (~ 40 % and ~ 25 %, respectively), whereas kleg peaked at first 50 m interval and remained constant from next 50 m interval to finish [14]. In the above-mentioned experimentation, the decrease in kvert was mainly due to an Girard O et al. Changes in Running Mechanics … Int J Sports Med 2013; 34: 832–840
increase in the motion of the CM, while Fzmax remained unaltered. Sprint studies have also reported similar adjustments in runners’ leg spring behaviour [9, 10, 18]. In the present study, however, exercise-induced reductions in Fzmax are likely to explain the progressively lower kvert since non-significant changes in Δz were found. It is well described that there is no or little change in kleg over a wide range of velocities [2]. In the present study, kleg remained unchanged over the duration of the run, as already observed during the course of repeated-sprint tests [9, 10]. Although ultra-long distance runners modified their running patterns toward a significantly higher kleg over a 24-h run [19], reports of decreased kleg values, as measured during the course [7, 27] and
This document was downloaded for personal use only. Unauthorized distribution is strictly prohibited.
00
50
00
46
38
42
00
00
00
34
00
30
00
26
00
22
00
0
00
18
14
20
d 140
100 Braking phae duration (ms)
0
00
00
50
00 42
46
00
00
38
00
00
34
30
00
26
22
00
18
14
10
20
00
0
00
0
0
120
0
180
c 110
Total stride duration (ms)
*
130
10
190
* * *
*
140
60
* *
* * * *
* * *
* * * * *
Aerial time (ms)
200
60
Contact time (ms)
210
Orthopedics & Biomechanics
b
1.55
3.65
3.50
00
00
00
50
46
00
42
00
00
38
34
00
30
00
00
26
22
00
* * * * * * * * * *
9.0
f
00
00
00
00
00
00
50
46
42
38
34
00
30
00
26
22
18
0 20
00
00
00 50
46
00
00
00
00
42
38
34
30
00
00
26
22
18
14
10
20
00
0
00
0
0
7.4
0
20
00
7.8
00
21
8.2
14
*
00
*
10
*
0
* *
*
60
*
22
Centre of mass vertical displacement (cm)
8.6
*
e 10.0
26
25
00
00
00 46
00
00
00
42
38
34
00
30
00
00
26
22
18
00 14
0
*
50
*
20
00
00 50
00
00
00
00
00
46
42
38
34
30
00
00
26
22
00
18
14
10
60
00
0
0
0
0
22
20
* * * * * *
23
8.0
Distance (m)
* *
0
8.5
*
24
00
9.0
10
–1
–1 Vertical stiffness (kN.m )
9.5 Leg stiffness (kN.m )
* * * *
Distance (m)
Fig. 4 Spring-mass model characteristics (a stride frequency, b stride length, c leg length change, d centre of mass vertical displacement, e leg stiffness, f vertical stiffness) at each 200 m distance intervals during the 5-km time trial *, P < 0.05, significantly different from the initial 200 m distance interval.
after [29] time trials of various nature, also exist. When 9 elite triathletes ran to exhaustion (~ 11 min) on an indoor track at a constant pace (~ 5 m.s − 1) the effect of fatigue in leg-spring behaviour was manifested by decreased kleg, as progressive reductions in Fzmax occurred with unchanged leg spring (ΔL) compression, with no change in kvert [27]. These changes in SMM characteristics are almost exactly opposite to what has been observed here, where there was no change in kleg because the reduced Fzmax was offset by the decrease (though not significant) in ΔL. Indeed, changes in kleg during the course of the run were found to be very largely and largely associated with peak vertical force (r = 0.83) and leg compression (r = − 0.64), respec▶ Fig. 6). In the present study, k tively (● vert was reduced because Fzmax decreased significantly and the vertical maximal down-
ward displacement of CM (Δz) remained constant throughout the run. The discrepancy between our results and those reported in the study by Rabita et al. [27] may point out the necessity for athletes to adapt their running style differently when exercising at self-paced vs. constant velocities. Indeed, Rabita et al. [27] concluded that the spring system adjusts to compensate for the effects of fatigue through a constant velocity exhaustive run by flattening CM vertical displacement (decrease of Δz) and taking longer strides. The lack of significant correlation between CM vertical displacement and kvert further suggests that when the runner is free to adapt his velocity his natural choice is to decrease his velocity rather than to modify the trajectory of his CM. One possibility may be a concomitant change in leg landing angle along with Vforward, which decreased leg compression; i. e., Girard O et al. Changes in Running Mechanics … Int J Sports Med 2013; 34: 832–840
This document was downloaded for personal use only. Unauthorized distribution is strictly prohibited.
d
18
20
0
00
00
00
50
46
00
00
42
38
00
00
34
30
00
00
26
22
18
14
10
60
00
0
00
0
0
3.05
0
1.43
24
*
3.20
14
* *
1.46
0
*
* * * *
00
*
10
*
* *
3.35
60
* * * *
Stride length (m)
*
23 Leg length change (cm)
*
*
1.49
20
c
*
*
60
Stride frequency (Hz)
1.52
60
a
837
838 Orthopedics & Biomechanics
2.10
240 –1
Vertical impulse (N.s )
b 250
00
00
50
00
00
46
42
00
38
00
34
00
30
00
26
00
22
00
*
–1
Braking impulse (N.s )
20
f
00
00
00
50
46
00
00
42
38
00
00
*
34
30
00
00
26
22
18
0 20
00
00 50
00
00
00
00
46
42
38
34
00
30
00
26
22
18
14
10
60
20
00
0 00
0 00
11
0
0.36
e 0.35
*
14
00
*
14
*
* *
0
*
00
*
10
* * * 0.42
17
60
0.48
0
20
0.32 –1
Push-off impulse (N.s )
18
Distance (m)
00
00
50
00
00
00
00
00
46
42
38
34
30
00
00
26
22
18
0 20
00
00
00 50
46
00
00
42
38
34
00
00 30
00
00
26
22
18
14
10
60
20
00
0 00
0 0
12
0
0.23
00
14
14
* *
0
* * * *
16
00
* 0.26
*
10
0.29
60
Peak braking force (kN)
0.54
23
Distance (m)
Fig. 5 Peak forces (a vertical force, c braking force, e push-off force) and impulsions (b vertical impulse, d braking impulse, f push-off impulse) at each 200 m distance intervals during the 5-km time trial. *, P < 0.05, significantly different from the initial 200 m distance interval.
less joint flexion and a straighter limb posture at ground impact [3]. During the time trial slowed Vforward were accompanied by reductions in stride length and stride frequency together with smaller amplitudes of braking and push-off peaks of anteriorposterior GRFs. The resulting lengthening of the total stride duration (caused by a longer tc and a concomitant reduced ta) confirms that subject’s running style is continuously altered when exercise is self-paced. Our data also add that a lengthening of the braking and push-off phases both contributed to the longer tc. Relatively similar effects have been observed on impact and force application characteristics during severe-intensity runs [8, 22, 24] and repeated-sprint tests [9, 10]. However, it may be incorrect to directly compare results across studies since difGirard O et al. Changes in Running Mechanics … Int J Sports Med 2013; 34: 832–840
ferent running strategies, resulting from different exercise characteristics (i. e., duration, intensity and/or mode), may elicit different biomechanical adjustments. For instance, stride frequency has been shown to increase [26, 27] or decrease [5, 7, 15] with the development of fatigue when running at a constant velocity. In our study, the significant correlation observed between kvert and Vforward over the entire 5-km race, as also reported during a 400 m sprint [14], suggests that maintaining a high stride frequency through retaining a high kvert would be necessary to maximise 5-km performance. A remarkable finding is that most of those changes in running mechanics and spring mass characteristics during the 5-km time trial were relatively progressive. Interestingly, a different
This document was downloaded for personal use only. Unauthorized distribution is strictly prohibited.
d
18
0 20
00
00
50
00
46
00
42
00
38
00
00
34
30
00
00
26
22
18
14
10
20
00
0 00
0 0
210
0
1.80
c 0.60
Peak push-off force (kN)
220
14
1.90
230
0
*
00
* *
10
*
*
60
2.00
60
Peak vertical force (kN)
a 2.20
Orthopedics & Biomechanics
Running velocity
a
Almost perfect
0.5
Moderate
Very large Almost perfect
*
*
–0.5 –0.7 –0.9
*
* * *
2.4 2.2
8
2.0
6
1.8
4
1.6
c
28 26
Leg stiffness 2.6 2.4
r = –0.64*
24
2.2
22
2.0
20
1.8
18
Peak vertical force (BW)
10
*
Vertical stiffness
Peak vertical force (BW)
CM vertical displacement (cm)
* *
–0.3
r = –0.32
1.6
r = 0.68*
r = 0.83*
2
1.4 19
* *
0.1
2.6
17
Peak push-off force
–0.1
14 12
Peak braking force
*
*
*
Running velocity b
Stride length
21 23 25 27 Vertical stiffness (kN.m–1)
29
31
16
1.4 5
6
7 8 9 10 Leg stiffness (kN.m–1)
11
12
Fig. 6 a Correlation coefficients between running velocity, vertical and leg stiffness and selected other biomechanical parameters during the 5-km time trial. b Relationship between changes in vertical stiffness and changes in centre of mass vertical displacement (circles) and in peak active force (squares) during the 5-km time trial. c Relationship between changes in leg stiffness and changes in maximal leg spring compression (circles) and in peak active force (squares) during the 5-km time trial. Data were pooled over all laps (n = 300). * denotes a significant correlation coefficient between considered variables (P < 0.05).
behaviour has been reported during the course of a constant velocity 10-km run, where major adjustments in stride parameters were seen during the first 2-km with only minor change during the remaining portions of the run [8]. In time trials, a centrally mediated down-regulation of neural drive, presumably affecting stiffness regulation and then stride parameters, has been proposed to occur in order to delay or attenuate the development of fatigue [22]. Although EMG activity of the lower limb was not measured here, previous studies indicated that Vforward profile mirrored EMG pattern in self-paced 5-km runs [1, 22]. Reports of decreased pre-activation of working muscles and significant relationships between decreased EMG pre-activation levels and both increased contact times [22] and decreased horizontal GRFs in the braking phase [24] exist during similar exercise tasks. In line with these existing findings is the moderate to large correlations observed in this study between changes in musculo-skeletal stiffness and both tc and Fymax-. When 10 triathletes ran to exhaustion on a treadmill (intensity corresponding to their lactate threshold) following an intense cycling exercise, Le Meur et al. [16] reported that leg stiffness decreased through-
out the run with concomitant reductions in EMG activity of knee extensors and ankle flexors during pre-contact and braking phases. Other literature findings also show that EMG activity may increase or remain unchanged despite a decline in power output towards the end of middle distance (4 000 m) cycling time trials [13]. As such, physiological changes within the muscle itself (peripheral fatigue), as evidenced by a reduction in twitch mechanical force after a 5-km time trial [11], may also contribute to the altered mechanical characteristics and subsequent variations in pacing strategies. Changes in force application characteristics that we observed are, however, generally of lower relative magnitude (in general ranging 3–14 % on average in the 3 800–4 600 m distance interval when compared to the first lap) than previously reported reductions in the knee extensors ( − 15 %; [23]) and plantar flexors ( − 27 %; [11]) maximal voluntary force production after similar running tasks. This along with the absence of correlation between the decrease in velocity during the 5-km time trial and the post-exercise force loss in the knee extensors in the study by Nummela et al. [23], suggest that factors other than the impaired capacity of the neuromuscular
Girard O et al. Changes in Running Mechanics … Int J Sports Med 2013; 34: 832–840
This document was downloaded for personal use only. Unauthorized distribution is strictly prohibited.
Large
*
0.3
Small Small
Stride frequency
*
Leg spring compression (cm)
Partial correlation coefficient
0.7
Large
Moderate
Total stride duration
0.9
Very large
Trivial
Aerial time
Contact time
839
system to generate force maximal force levels are likely to better explain the adjustments in stride parameters that occurred during the run. During a 5-km time trial, experienced triathletes progressively slowed running velocities over the major portion of the run compared to the start, followed by a significant increase in velocity towards the end. This pacing strategy was associated with a modification of their spring-mass behaviour towards a lower vertical stiffness, whereas leg stiffness remained unchanged. Ultimately this resulted in an alteration in their running pattern. Future research focusing on musculo-skeletal stiffness control strategies (e. g. muscle activation, reflexes, antagonist muscle coactivation, and sagittal-plane knee and ankle joint kinematics) are needed to determine if those adjustments are consciously adjusted or affected by the neuro-physiological state. In addition, improved neuromuscular characteristics through explosive-strength training, is known to have a positive influence on 5-km running performance [25]. However, whether such training-induced improvements in muscle power and running economy may also lessen the negative influence of fatigue development on running mechanics and musculoskeletal stiffness regulation during middle-distance runs of varying intensities is still unknown and requires more attention.
References 1 Billaut F, Davis JM, Smith KJ, Marino FE, Noakes TD. Cerebral oxygenation decreases but does not impair performance during self-paced, strenuous exercise. Acta Physiol 2010; 198: 477–486 2 Brughelli M, Cronin J. Influence of running velocity on vertical, leg and joint stiffness. Modelling and recommendations for future studies. Sports Med 2008; 38: 647–657 3 Butler RJ, Crowell HP, Davis IM. Lower extremity stiffness: implications for performance and injury. Clin Biomech 2003; 18: 511–517 4 Cavagna GA. Force platforms as ergometers. J Appl Physiol 1975; 39: 174–179 5 Candau R, Belli A, Millet GY, Georges D, Barbier B, Rouillon JD. Energy cost and running mechanics during a treadmill run to voluntary exhaustion in humans. Eur J Appl Physiol 1998; 77: 479–485 6 Derrick TR, Dereu D, McLean SP. Impacts and kinematic adjustments during an exhaustive run. Med Sci Sports Exerc 2002; 34: 998–1002 7 Dutto DJ, Smith GA. Changes in spring-mass characteristics during treadmill running to exhaustion. Med Sci Sports Exerc 2002; 34: 1324–1331 8 Finni T, Kyröläinen H, Avela J, Komi PV. Maximal but not submaximal performance is reduced by constant-speed 10-km run. J Sports Med Phys Fitness 2003; 43: 411–417 9 Girard O, Micallef J-P, Millet GP. Changes in spring-mass model characteristics during repeated running sprints. Eur J Appl Physiol 2011; 11: 125–134 10 Girard O, Racinais S, Kelly L, Millet GP, Brocherie F. Repeated sprinting on natural grass impairs vertical stiffness but does not alter plantar loading in soccer players. Eur J Appl Physiol 2011; 111: 2547–2555 11 Girard O, Millet GP, Micallef JP, Racinais S. Alteration in neuromuscular function after a 5 km running time trial. Eur J Appl Physiol 2012; 112: 2323–2330
Girard O et al. Changes in Running Mechanics … Int J Sports Med 2013; 34: 832–840
12 Harriss DJ, Atkinson G. Update – ethical standards in sport and exercise science research. Int J Sports Med 2011; 32: 819–821 13 Hettinga FJ, De Koning JJ, Broersen FT, Van Geffen P, Foster C. Pacing strategy and the occurrence of fatigue in 4000-m cycling time trials. Med Sci Sports Exerc 2006; 38: 1484–1491 14 Hobara H, Inoue K, Gomi K, Sakamoto M, Muraoka T, Iso S, Kanosue K. Continuous change in spring-mass characteristics during a 400 m sprint. J Sci Med Sport 2010; 13: 256–261 15 Hunter I, Smith GA. Preferred and optimal stride frequency, stiffness and economy: changes with fatigue during a 1-h high-intensity run. Eur J Appl Physiol 2007; 100: 653–661 16 Le Meur Y, Dorel S, Rabita G, Bernard T, Brisswalter J, Hausswirth C. Spring–mass behavior and electromyographic activity evolution during a cycle-run test to exhaustion in triathletes. J Electromyogr Kinesiol 2012 http://dx.doi.org/10.1016/j.jelekin.2012.04.011 17 McMahon TA, Cheng GC. The mechanics of running: how does stiffness couple with speed? J Biomech 1990; 23: 65–78 18 Morin J-B, Jeannin T, Chevallier B, Belli A. Spring-mass model characteristics during sprint running: correlation with performance and fatigue-induced changes. Int J Sports Med 2006; 27: 159–165 19 Morin J-B, Samozino P, Millet GY. Changes in running kinematics, kinetics and spring-mass behavior over a 24-h run. Med Sci Sports Exerc 2011; 43: 829–836 20 Morin J-B, Tomazin K, Edouard P, Millet GY. Changes in running mechanics and spring-mass behavior induced by a mountain ultramarathon race. J Biomech 2011; 44: 1104–1107 21 Morin J-B, Tomazin K, Samozino P, Edouard P, Millet GY. High-intensity sprint fatigue does not alter constant-submaximal velocity running mechanics and spring-mass behaviour. Eur J Appl Physiol 2012; 112: 1419–1428 22 Nummela AT, Paavolainen LM, Sharwood KA, Lambert MI, Noakes TD, Rusko HK. Neuromuscular factors determining 5 km running performance and running economy in well-trained athletes. Eur J Appl Physiol 2006; 97: 1–8 23 Nummela AT, Heath KA, Paavolainen LM, Lambert MI St, Clair Gibson A, Rusko HK, Noakes TD. Fatigue during a 5-km running time trial. Int J Sports Med 2008; 29: 738–745 24 Paavolainen L, Nummela A, Rusko H, Häkkinen K. Neuromuscular characteristics and fatigue during 10 km running. Int J Sports Med 1999; 20: 516–521 25 Paavolainen L, Häkkinen K, Hämäläinen I, Nummela A, Rusko H. Explosive- strength training improves 5-km running time by improving running economy and muscle power. J Appl Physiol 1999; 86: 1527–1533 26 Place N, Lepers N, Deley G, Milley GY. Time course of neuromuscular alterations during a prolonged running exercise. Med Sci Sports Exerc 2004; 36: 1347–1356 27 Rabita G, Slawinski J, Girard O, Bignet F, Hausswirth C. Spring-mass behavior during exhaustive run at constant velocity in elite triathletes. Med Sci Sports Exerc 2011; 43: 685–692 28 Serpell BG, Ball NB, Scarvell JM, Smith PN. A review of models of vertical, leg and knee stiffness in adults for running, jumping or hopping tasks. J Sports Sci 2012; 30: 1347–1363 29 Slawinski J, Heubert R, Quievre J, Billat V, Hanon C. Changes in springmass model parameters and energy cost during track running to exhaustion. J Strength Cond Res 2008; 22: 930–936 30 Tucker R, Lambert MI, Noakes TD. An analysis of pacing strategies during men’s world-record performances in track athletics. Int J Sports Physiol Perf 2006; 1: 233–245 31 Vleck VE, Bentley DJ, Millet GP, Bürgi A. Pacing during an elite Olympic distance triathlon: comparison between male and female competitors. J Sci Med Sport 2008; 11: 424–432 32 Winter DA. Biomechanics and Motor Control of Human Movement. 2nd ed. New York: Wiley Inter Science, 1990; 75–102
This document was downloaded for personal use only. Unauthorized distribution is strictly prohibited.
840 Orthopedics & Biomechanics