662
AGRONOMY JOURNAL, VOL. 90, SEPTEMBER–OCTOBER 1998
Lewis, W.M., and J.A. Phillips. 1976. Double cropping in the eastern United States. p. 41–50. In R.I. Papendick et al. (ed.) Multiple cropping. ASA Spec. Publ. 27. ASA, CSSA, and SSSA, Madison, WI. Malik, N.S.A., M. Pence, H.E. Calvert, W.D. Bauer. 1987. Nitrate induced regulation of nodule formation in soybean. Plant Physiol. 75:90–94. Nelson, R.L., P.J. Andaor, J.H. Orf, J.F. Cavins. 1988. Evaluation of the USDA soybean germplasm collection: Maturity Groups 000 to IV (PI 427.136 to PI 445.845). USDA Tech. Bull. 1726. U.S. Gov. Print. Office, Washington, DC. Peterson, T.A., and G.E. Varvel. 1989. Crop yield as affected by rotation and nitrogen rate in soybean. Agron. J. 81:727–731. Pyle, M.E. 1982. A comparison of determinate and indeterminate soybean lines for double cropping in Virginia. Ph.D. diss. Virginia Polytechnic Inst. & State Univ., Blacksburg (UMI Diss. Abstr. 8304135) (Diss. Abstr. Int. 43B:3095). SAS Institute. 1985. SAS user’s guide: Statistics. 5th ed. SAS Inst., Cary, NC. Sims, G.K., T.R. Ellsworth, and R.L. Mulvaney. 1995. Microscale determination of inorganic nitrogen in water and soil extracts. Commun. Soil Sci. Plant Anal. 26:303–316. Sorensen, R.C., and E.J. Penas. 1978. Nitrogen fertilization of soybean. Agron. J. 70:213–216.
Stone, J.A., and B.R. Buttery. 1986. Some effect of nitrate on soybean root development. Can. J. Plant Sci. 66:505–510. Stone, L.R., D.A. Whitney, and C.K. Anderson. 1985. Soybean yield response to residual NO3–N and applied N. Plant Soil 84:259–265. Touchton, J.T., and D.H. Rickerl. 1986. Soybean growth and yield response to starter fertilizers. Soil Sci. Soc. Am. J. 50:234–237. Wallace, S.U., T. Whitwell, J.H. Palmer, C.E. Hood, and S.A. Hull. 1992. Growth of relay intercropped soybean. Agron. J. 84:968–973. Weaver, D.B. 1995. Registration of Au86-2397D and Au86-2397I soybean. Crop Sci. 35:1231-1232. Weaver, D.B., R.L. Arkridge, and C.A. Thomas. 1991. Growth habit, planting date, and row spacing effects on late-planted soybean. Crop Sci. 31:805–810. Welch, L.F., L.V. Boone, C.G. Chambliss, A.T. Christiansen, D.L. Mulvaney, M.G. Oldham, and J.W. Pendleton. 1973. Soybean yields with direct and residual nitrogen fertilization. Agron. J. 65:547–550. Wilcox, J.R., and E.M. Frankenberger. 1987. Indeterminate and determinate soybean responses to planting date. Agron. J. 79:1074–1078. Williamson, D.D., and R.A. Graham. 1983. Kentucky agricultural statistics. 1982–1983. Kentucky Crop and Livestock Reporting Service, Louisville. Wood, C.W., H.A. Torbert, and D.B. Weaver. 1993. Nitrogen fertilizer effects on soybean growth, yield, and seed composition. J. Prod. Agric. 6:354–360.
Changes in Soil Chemical Properties Resulting from Organic and Low-Input Farming Practices M. Sean Clark,* William R. Horwath, Carol Shennan, and Kate M. Scow ABSTRACT Soil chemical properties during the transition from conventional to organic and low-input farming practices were studied over 8 yr in California’s Sacramento Valley to document changes in soil fertility status and nutrient storage. Four farming systems differing in crop rotation and external inputs were established on land previously managed conventionally. Fertility in the organic system depended on animal manure applications and winter cover crops; the two conventional systems received synthetic fertilizer inputs; the low-input system used cover crops and animal manure during the first 3 yr and cover crops and synthetic fertilizer for the remaining 5 yr. At 4 and 8 yr after establishment, most changes in soil chemical properties were consistent with predictions based on nutrient budgets. Inputs of C, P, K, Ca, and Mg were higher in the organic and low-input systems as a result of manure applications and cover crop incorporations. After 4 yr, soils in the organic and low-input systems had higher soil organic C, soluble P, exchangeable K, and pH. Ceasing manure applications in the low-input system in Year 4 resulted in declining levels of organic C, soluble P, and exchangeable K. Crop rotation (the presence or absence of corn) also had a significant effect on organic C levels. Differences in total N appeared to be related in part to inputs, but perhaps also to differing efficiency of the farming systems at storing excess N inputs: the low-input system appeared to be most efficient, and the conventional systems were least efficient. Electrical conductivity (EC), soluble Ca, and soluble Mg levels were tightly linked but not consistently different among treatments. Relatively stable EC M.S. Clark, Dep. of Agriculture and Natural Resources, Berea College, Berea, KY 40404; and W.R. Horwath and K.M. Scow, Dep. of Land, Air, and Water Resources, Univ. of California, Davis, CA 95616; C. Shennan, Dep. of Environmental Studies, Univ. of California, Santa Cruz, CA 95064. Received 15 Nov. 1997. *Corresponding author (
[email protected]). Published in Agron. J. 90:662–671 (1998).
levels in the organic system indicate that animal manures did not increase salinity. Overall, our findings indicate that organic and lowinput farming in the Sacramento Valley result in small but important increases in soil organic C and larger pools of stored nutrients, which are critical for long-term fertility maintenance.
T
he transition from conventional to organic and low-input farming is accompanied by changes in an array of soil chemical properties and processes that affect soil fertility. Fundamental differences, both qualitative and quantitative, in the flow and processing of nutrients result from the use of cover crops, manure and compost applications, and reduction or elimination of synthetic fertilizers and pesticides. These changes affect nutrient availability to crops either directly by contributing to nutrient pools or indirectly by influencing the soil chemical and physical environment. Studies comparing soils of organically and conventionally managed farming systems have documented higher soil organic matter (OM) and total N with the use of organic practices (Lockeretz et al., 1981; Alvarez et al., 1988, 1993; Reganold, 1988; Reganold et al., 1993; Drinkwater et al., 1995). Increases in soil OM following the transition to organic management occur slowly, generally taking several years to detect (Wander et al., 1994; Drinkwater et al., 1995; Werner, 1997), yet can have a dramatic effect on long-term productivity (Tiessen et Abbreviations: EC, electrical conductivity; IPM, integrated pest management; OM, organic matter; SAFS, Sustainable Agriculture Farming Systems [Project].
CLARK ET AL.: SOIL CHEMICAL PROPERTIES WITH ORGANIC AND LOW-INPUT FARMING
663
temperatures average 30 to 35⬚C during the growing season. The major crops of the region, based on area planted, are rice (Oryza sativa L.), wheat, processing tomato [Lycopersicon esculentum Mill.], corn (Zea mays L.), and safflower (Carthamus tinctorius L.) (Calif. Dep. of Food and Agric., 1996).
al., 1994). Changes in other soil properties have been found to be more variable, perhaps due to differences in climate, crop rotation, soil type, or length of time a soil has been under organic management (Lockeretz et al., 1981; Drinkwater et al., 1995; Werner, 1997). Generally, soil pH is higher and plant-available nutrients, particularly K, may be greater under organic management (Reganold, 1988; Garcı´a et al., 1989; Drinkwater et al., 1995). Because these soil properties are critical in determining the fertility of agricultural soils, the ability to predict and manage their dynamics and intensity in time and space will facilitate the transition to organic and low-input farming practices. This paper summarizes findings from the first 8 yr of the Sustainable Agriculture Farming Systems (SAFS) Project, a replicated comparison of conventional, lowinput, and organic systems (Temple et al., 1994). The farming systems in this study are representative of those in the semiarid, irrigated environment of California’s Sacramento Valley. Our specific objectives were to (i) document changes in soil chemical properties and nutrient status during the transition from conventional to low-input and organic production methods and (ii) relate observed soil chemical and fertility measurements to calculated nutrient budgets and particular management practices.
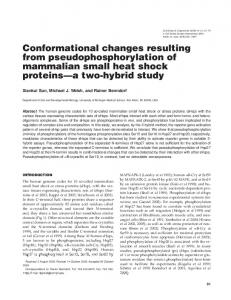
Farming System Descriptions The SAFS project consists of four farming system treatments that differ in crop rotation and use of external inputs (Table 1). These include 4-yr rotations under conventional (Conv-4), low-input, and organic management and a conventionally managed 2-yr rotation (Conv-2). All three 4-yr rotations include processing tomato, safflower, bean, and corn. In the Conv-4 treatment, bean is double-cropped with winter wheat; in the low-input and organic treatments, bean follows a biculture of oat (Avena sativa L.) and vetch (Vicia spp.) that is either harvested for seed, cut as hay, or incorporated as green manure. Vetch cover crops have been grown during the winter preceding all other cash crops in the low-input and organic systems. The Conv-2 treatment is a tomato and wheat rotation. There are four replications of each treatment, and all possible crop rotation entry points are represented each year within each farming system replicate, resulting in a total of 56 subplots. The subplots measure 68 by 18 m (0.12 ha) each and are arranged in a randomized block, split-plot design (Fig. 1). The blocking pattern was chosen to accommodate spatial differences in the management history of the site. All farming systems used best farmer management practices, which are determined through consultation with area farmers and University of California Cooperative Extension Farm Advisors participating on the project (Table 1). In all of the farming systems, the ground is prepared prior to planting with disking followed by bed formation. All crops except tomato are grown on 0.76-m beds; tomato is grown on 1.52-m beds. In the conventional systems, preparing the ground is usually done in fall, while in the organic and low-input systems it is done in spring, to incorporate cover crops. The conventional treatments are managed with practices typical of the surrounding area, which include the use of synthetic fertilizers such as urea, NH4NO3, (NH4)2SO4, superphosphate, and mixtures containing N, P, and K. Fertilizer N applications to the tomato and corn crops are split between a starter and sidedressing with most applied during the latter application. Decisions to use pesticides in these treatments are based on common practices in the area, as well as on University of California integrated pest management (IPM) guidelines (Univ. of Calif., 1996). Nonchemical weed management is used in conjunction
MATERIALS AND METHODS Study Site The Sustainable Agriculture Farming Systems (SAFS) Project was established in 1988 at the Agronomy Farm of the University of California at Davis (38⬚32⬘ N, 121⬚47⬘ W; 18 m elevation). The soil at the 8.1-ha site is classified as Reiff loam (coarse-loamy, mixed, nonacid, thermic Mollic Xerofluvents) and Yolo silt loam (fine-silty, mixed, nonacid, thermic Typic Xerorthents). Prior to initiation of this experiment, the site consisted of small research plots in wheat (Triticum aestivum L.), bean (Phaseolus vulgaris L.), and alfalfa (Medicago sativa L.) under conventional management. The Sacramento Valley of California has a Mediterranean climate, with most rainfall occurring during the winter months (December–March) and relatively little during the growing season. Furrow irrigation is used for most crop production. Total annual rainfall is typically 400 to 500 mm, and daytime
Table 1. Farming system treatments at the Sustainable Agriculture Farming Systems Project at the University of California, Davis (begun in 1988). Farming system Organic
Low-input
Conv-4†
Conv-2†
Year
Crop rotation
Description
1 2 3 4 1 2 3 4
tomato safflower corn oats ⫹ vetch; bean tomato safflower corn oats ⫹ vetch; bean
4-yr, five-crop rotation relying on composted and aged (partially composted) animal manures, legume and grass cover crops, and some organic supplements; no synthetic pesticides or fertilizers are used.
1 2 3 4 1 2
tomato safflower corn wheat; bean tomato wheat
4-yr, five-crop rotation relying on legume and grass cover crops and synthetic fertilizer applied at about one-half the recommended rate; pesticide use is reduced through cultivation and some hand hoeing.
4-yr, five-crop rotation relying on synthetic fertilizer and pesticides used at conventionally recommended rates.
2-yr, two-crop rotation relying on synthetic fertilizer and pesticides used at conventionally recommended rates.
† Conv-4 and Conv-2, Conventional 4-year and 2-year systems, respectively.
664
AGRONOMY JOURNAL, VOL. 90, SEPTEMBER–OCTOBER 1998
analysis. In 1992 and 1996, the soil cores were split into the 0- to 15-cm and 15- to 30-cm depths and processed separately. Soil samples were submitted to the University of California’s Division of Agriculture and Natural Resources (UC DANR) Analytical Laboratory for the following analyses: organic C, pH, electrical conductivity (EC), exchangeable K, and soluble P, Ca, and Mg. Organic C was determined using the modified Walkley–Black method described in Nelson and Sommers (1982) with a correction factor of 1.3. Electrical conductivity and pH were measured in a saturated paste, using a conductivity meter and pH meter, respectively (Rhoades, 1982). Exchangeable K was determined using NH4OAc extraction followed by absorption–emission spectrometry (Knudsen et al., 1982). Soluble P was determined with the Olsen extraction method followed by spectrophotometry (Olsen et al., 1954). Soluble Ca and Mg were determined with atomic emission spectrometry of a saturated paste extract (Lanyon and Heald, 1982). In addition to the aforementioned analyses, soil samples taken in 1996 were also analyzed for total N and C using a combustion gas analyzer (Pella, 1990a,b), and for exchangeable Ca and Mg (Lanyon and Heald, 1982). Archived samples from 1988 and 1992 were unavailable for these additional analyses.
Data Analysis
Fig. 1. Diagram of the Sustainable Agriculture Farming Systems (SAFS) Project at Davis, CA, showing the field layout and experimental design for four farming systems (organic, low-input, and conventionally managed 4- or 2-yr rotations).
with herbicides and is generally accomplished with rolling (rotary) cultivators. In tomato, a cultivator equipped with knives, shovels, and rolling baskets and hand hoeing are also used. In the low-input system, synthetic fertilizer and pesticide inputs are reduced primarily by using legume cover crops to improve soil fertility and mechanical cultivation for weed management. Manure was applied in the low-input system to tomato in 1989, to corn in 1989 and 1991, and to safflower in 1989 and 1992. The organic treatment is managed according to the regulations of California Certified Organic Farmers (CCOF), which do not allow the use of synthetic chemical pesticides or fertilizers. Instead, management includes the use of legume and grass cover crops and mixtures, aged and composted animal manure, mechanical cultivation, and limited use of CCOF-approved products such as Bacillus thuringiensis (Bt ) and insecticidal soap (CCOF, 1995). The organic tomato and corn crops receive 4 to 7 Mg (dry wt.) ha⫺1 of composted poultry (Gallus and Meleagris spp.) manure several weeks prior to planting, which generally supplies 150 to 200 kg ha⫺1 of N. Cultivation tools and practices used in the low-input and organic farming systems are similar to those described for the conventional system, but are used with greater frequency.
Soil Sampling and Analysis Initial soil sampling was conducted at the time of plot establishment in September 1988. Subsequent soil samplings were conducted in September 1992, after completion of the first 4-yr rotation, and in September 1996, after completion of the second 4-yr rotation. At each sampling, 30 soil cores (2.5 cm diam., 30 cm depth) were taken from each subplot of a farming system replicate. The soil was mixed thoroughly in a bucket, sieved through a 2-mm-mesh screen, and air-dried prior to
Data were analyzed at the farming system level. Thus, data from all individual crop subplots within a farming system replicate were pooled before analysis. Soil measurements were compared across the farming system treatments in each of the three years (1988, 1992, and 1996), using two-way analysis of variance (ANOVA) followed by the Student–Newman–Keuls test when P ⬍ 0.05. When variance heterogeneity and/or lack of normality were encountered the data were analyzed using ranks. Changes in soil properties within treatments over the course of the experiment were analyzed using repeated-measures ANOVA and Student–Newman–Keuls tests. Nutrient budgets for each farming system were calculated for the period from 1989 to 1996, based on estimated elemental inputs and outputs. Cumulative elemental inputs of P, K, Ca, and Mg were determined from fertilizer and manure applications. Total N inputs were calculated from fertilizer and manure applications and estimates of symbiotic N fixation from legumes. The amount of N fixed by vetch cover crops and bean crops was estimated from total aboveground biomass and N concentrations prior to incorporation or harvest. Nitrogen fixation was assumed to be relatively high in legumes planted after safflower and bean, because manure and synthetic N fertilizer were generally not applied and residual mineral N levels were expected to be low. By contrast, N fixation was assumed to be low in legumes planted after corn and tomato because of the heavy manure or fertilizer applications, which would result in high soil mineral N levels. Based on N input levels associated with the crop rotation sequence and values derived from the literature, it was assumed that the amount of fixed N was equivalent to 50% of N in the aboveground biomass (Rennie and Kemp, 1983; Yagodina and Trepachev, 1990; Stivers and Shennan, 1991; Papastylianou and Danso, 1991). Total C inputs for each cash crop were based on manure applications, preceding cover crop biomass, and previous cash crop residue following harvest. Belowground biomass was assumed to be equal to 50% of aboveground biomass. The C content of the manure was determined using combustion gas analysis, and that of any plant biomass was conservatively assumed to be 40%. Nutrient outputs were derived from cash crop yields and their nutrient concentrations, which were determined by the UC DANR Analytical Laboratory. Losses
CLARK ET AL.: SOIL CHEMICAL PROPERTIES WITH ORGANIC AND LOW-INPUT FARMING
665
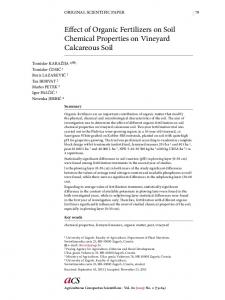
Fig. 2. Soil property measurements (organic matter, pH, electrical conductivity [E.C.], soluble P, exchangeable K, soluble Ca, and soluble Mg) taken in 1988, 1992, and 1996 at three sampling depths (0–30, 0–15, and 15–30 cm) in the four farming system treatments of the SAFS project (organic, low-input, and conventionally managed 4- or 2-yr rotations). Within a year and depth, property means accompanied by the same letter or no letter do not differ significantly among treatments (P ⬎ 0.05).
due to leaching, respiration, volatilization, and/or denitrification were not accounted for in the balances. The calculated nutrient budgets were compared with measured soil properties, using descriptive data and using correlation and regression analysis to confirm or explain observed patterns or differences across farming system treatments. All statistical procedures were performed using SigmaStat (Jandel Scientific, San Rafael, CA).
RESULTS Soil samples taken in September 1988, prior to planting the first cash crops, showed that organic C, pH, soluble P, and exchangeable K were similar across the four farming system treatments (Fig. 2). However, EC and soluble Ca and Mg, the two cations largely determining EC, showed significant differences across treatments (Fig. 2) and blocks (data not shown), indicating that there was some degree of variability in soluble Ca and Mg across the study site and that the blocking pattern used was not entirely effective in accommodat-
ing this heterogeneity. Electrical conductivity, soluble Ca, and soluble Mg were highest in the Conv-2 system and lowest in the organic and Conv-4 systems. Ratios of soluble Ca to Mg did not differ across the treatments (data not shown). In 1992, treatment differences were found in organic C and pH in the 0- to 30-cm soil depth (Fig. 2). Organic C levels increased in the organic, low-input, and Conv-4 systems between 1988 and 1992 by 19, 19, and 10%, respectively, but remained unchanged in the Conv-2 system (Table 2). This resulted in significantly higher organic C levels in the organic and low-input systems than in the two conventional systems. Organic C patterns observed in the 0- to 30-cm depth were largely due to differences in the 15- to 30-cm soil layer, which was significant with ANOVA (P ⫽ 0.04) but not with the Student–Newman–Keuls test. Similar patterns were observed in the 0- to 15-cm depth but these were not statistically significant (P ⫽ 0.55). The pH levels of all four systems increased from 1988 to 1992 (Table 2).
666
AGRONOMY JOURNAL, VOL. 90, SEPTEMBER–OCTOBER 1998
Table 2. Results of ANOVA and Student–Newman–Keuls (SNK) tests showing statistically significant (P ⱕ 0.05) changes in soil properties within the four farming systems between 1988 and 1996. Soil property† OM
pH
EC
Farming system Organic Low-input Conv-4 Organic Low-input Conv-4 Conv-2 Low-input Conv-2
Soluble P
Organic Low-input Conv-4 Conv-2
Exchangeable K
Organic Low-input Conv-4
Soluble Ca
Conv-4 Conv-2
Soluble Mg
Conv-4 Conv-2
Depth cm 0–30 0–30 15–30 0–30 0–30 0–30 0–30 0–30 0–30 15–30 0–15 0–30 0–15 15–30 0–30 0–15 15–30 0–30 0–30 0–15 15–30 0–30 15–30 0–30 0–15 0–30 0–30 0–15 0–30 15–30 0–30 15–30 0–30 15–30 0–30 15–30
P-value 0.003 ⬍0.001 0.01 0.01 ⬍0.001 0.001 0.016 0.026 0.01 0.018 0.006 0.007 0.049 0.001 0.001 0.0288 0.032 0.004 0.012 0.026 0.002 0.01 0.021 ⬍0.001 0.029 0.003 0.008 0.035 0.042 0.034 0.003 ⬍0.001 0.014 0.04 0.002 ⬍0.001
SNK test 1988 ⬍ 1992, 1996 1988, 1996 ⬍ 1992 1992 ⬎ 1996 1988 ⬍ 1992, 1996 1988 ⬍ 1992, 1996 1988 ⬍ 1992, 1996 1988 ⬍1992, 1996 1988 ⬍ 1992, 1996 1988, 1992 ⬎ 1996 1992 ⬎ 1996 1992 ⬎ 1996 1988 ⬎ 1996 ⬎ 1992 1992 ⬎ 1996 1992 ⬍ 1996 1988 ⬍ 1992 ⬍ 1996 1992 ⬍ 1996 1992 ⬍ 1996 1992 ⬎ 1988, 1996 1988 ⬍ 1992, 1996 1992 ⬎ 1996 1992 ⬍ 1996 1988 ⬍ 1992, 1996 1992 ⬍ 1996 1988 ⬍ 1992, 1996 1992 ⬍ 1996 1992 ⬎ 1988, 1996 1988 ⬍ 1992, 1996 1992 ⬎ 1996 1988 ⬍ 1996 1992 ⬍ 1996 1992 ⬍ 1988 ⬍ 1996 1992 ⬍ 1996 1988, 1992 ⬍ 1996 1992 ⬎ 1996 1992 ⬍ 1988 ⬍ 1996 1992 ⬍ 1996
† OM, organic matter; EC, electrical conductivity.
Soil pH was significantly higher in the organic than the conventional systems in the 0- to 30-cm soil depth and was higher than all three other treatments in the 15- to 30-cm soil depth (Fig. 2). Additional treatment differences in 1992 were found in EC, soluble Ca, and soluble Mg within the 15- to 30-cm soil layer (Fig. 2). Although the cause of these differences is not clear, the relative trends between these variables were nearly identical. However, in contrast to data from 1988, the organic and low-input systems had the highest values, while the Conv-2 system had the lowest values at 0 to 30 cm. Soluble P was also significantly greater in the organic system than in the Conv2 and low-input systems at 15 to 30 cm (Fig. 2). In 1996, all soil variables measured except soil OM differed among treatments within the 0- to 30-cm soil depth (Fig. 2). Soluble P and pH were significantly greater in the organic and low-input systems than in the conventional systems. By contrast, EC, soluble Ca, and soluble Mg were significantly greater in conventional systems. Exchangeable K was significantly higher in the organic system compared with all others. Changes observed in pH, soluble P, and exchangeable K in the 0- to 30-cm soil depth were paralleled in the
Table 3. Total carbon, total nitrogen, and carbon:nitrogen ratios as determined by combustion gas analysis in soils from the four farming system treatments, September, 1996. Farming system Soil variable Total C
Total N
C:N
Depth cm 0–30 0–15 15–30 0–30 0–15 15–30 0–30 0–15 15–30
Organic 10.21a† 11.96a 8.46 1.18a 1.35a 1.00 8.67 8.83 8.45
Low-input g 9.72ab 11.01b 8.44 1.13ab 1.26b 1.00 8.62 8.77 8.43
Conv-4
Conv-2
9.42b 9.77c 9.08 1.08b 1.11c 1.06 8.69 8.78 8.59
9.11b 9.72c 8.50 1.06b 1.11c 1.02 8.57 8.76 8.37
kg⫺1
† Means followed by different letters within a row are significantly different (ANOVA, Student–Newman–Keuls, P ⱕ 0.05)
0- to 15-cm depth but not necessarily at 15 to 30 cm. In contrast, patterns of EC, soluble Ca, and soluble Mg observed at 0 to 30 cm appeared to be due largely to dynamics in the 15- to 30-cm depth, as these variables showed no significant differences at 0 to 15 cm (Fig. 2). Only pH showed relatively similar patterns in the two soil depth levels. Differences in organic C levels in the 0- to 15-cm soil layer were significant at P ⫽ 0.06 in 1996. Although mean organic C levels declined slightly in the organic, low-input, and Conv-4 systems between 1992 and 1996, these changes were statistically significant only in the low-input system, which no longer received manure applications after 1991 (Table 2). Interestingly, the Conv-4 system had significantly higher organic C compared with the other three systems in the 15- to 30-cm soil depth. Total C levels as determined by combustion gas analysis in 1996 were only slightly greater than levels determined by the Walkley–Black method, but indicated greater differences among treatments. Many studies have shown that the Walkley–Black method provides variable recovery of organic C, ranging from 57 to 122%, due to inconsistent conversion of organic C to CO2 (Nelson and Sommers, 1982). Correction factors, usually 1.3, are derived from comparison with other methods, such as combustion gas analysis. Depending on the correction factor used, the Walkley–Black method can over- or underestimate organic C. According to the combustion gas analysis results of 1996, the organic system had significantly greater total soil C compared with the conventional systems at 0 to 30 cm (Table 3). Similarly, in the 0- to 15-cm depth the organic system had the highest total C levels, followed by the low-input system, with the conventional systems showing the lowest levels. No significant differences in total C were found in the 15- to 30-cm depth, though the Conv-4 system had the highest levels (as was indicated by the Walkley–Black method). Total N showed almost identical patterns relative to total C in all three soil depths, with the organic system containing the highest levels and the Conv-2 the lowest (Table 3). No significant difference was found in soil C:N ratios across the treatments. Organic C levels in the Conv-2 system were stable
667
CLARK ET AL.: SOIL CHEMICAL PROPERTIES WITH ORGANIC AND LOW-INPUT FARMING
Table 4. Average annual inputs (from fertilizer, manure, and atmospheric fixation from previous cash crop and/or cover crop) outputs (in harvested crop), and balances of C, N, P, K, Ca, and Mg (in kg ha⫺1 yr⫺1) for tomato. corn, safflower, bean, wheat (Wht), and oats ⫹ vetch (O⫹V) in the four farming system treatments, 1989–1996. Organic Crop
Input
Output
Low-input Balance
Input
Output
Conv-4 Balance ha⫺1
Input
Conv-2
Output
Balance
Input
Output
Balance
1670 3860 980 690 2010
430 430 1880 5540 8180
6950
1540
5410
3100
2010
109
137 226 64 121 156
116 166 85 51 102
21 60 ⫺21 70 54
137
107
30
139
90
49
24 21 13 0 27
16 27 16 8 17
8 ⫺6 ⫺3 ⫺8 10
24
13
11
27
17
10
17 28 0 0 2
277 38 17 26 22
⫺260 ⫺10 ⫺17 ⫺26 ⫺20
17
256
⫺239
2
22
⫺20
0 0 0 0 0
4 0 5 4 2
⫺4 0 ⫺5 ⫺4 ⫺2
0
3
⫺3
0
2
⫺2
0 0 0 0 0
11 15 9 4 7
⫺11 ⫺15 ⫺9 ⫺4 ⫺7
0
10
⫺10
0
7
⫺7
yr⫺1
kg Carbon Tomato Corn Safflower Bean Wht, O⫹V
6 230† 8 030 4 950 17 540 12 150
1360 3650 860 700 720
4 870 4 380 4 090 16 840 11 430
4 390 6 520 5 080 17 430 11 970
1530 4240 830 740 1190
2 860 2 280 4 250 16 690 10 780
2 100 4 290 2 860 6 230 10 110
Nitrogen Tomato Corn Safflower Bean Wht, O⫹V
162 259 98 73 66
91 130 74 52 22
71 129 24 21 44
114 176 97 77 97
112 169 70 55 54
2 7 27 22 43 Phosphorus
Tomato Corn Safflower Bean Wht, O⫹V
95 142 27 0 0
20 25 14 8 6
75 117 13 ⫺8 ⫺6
29 34 27 0 0
23 29 14 8 8
6 5 13 ⫺8 ⫺8 Potassium
Tomato Corn Safflower Bean Wht, O⫹V
113 166 33 0 0
226 36 15 26 21
⫺113 130 18 ⫺26 ⫺21
21 36 33 0 0
253 42 15 28 48
⫺232 ⫺6 18 ⫺28 ⫺48 Calcium
Tomato Corn Safflower Bean Wht, O⫹V
159 235 50 0 0
5 0 5 4 3
154 235 46 ⫺4 ⫺3
16 34 50 0 0
3 0 5 4 11
13 34 46 ⫺4 ⫺11 Magnesium
Tomato Corn Safflower Bean Wht, O⫹V
21 31 7 0 0
12 17 8 4 3
9 14 ⫺1 ⫺4 ⫺3
2 5 7 0 0
8 17 8 4 6
⫺6 ⫺12 ⫺1 ⫺4 ⫺6
† Carbon inputs include carbon in manure applications, cover crop residue, and previous crop residue
over the 8 yr of the study. From this it can be assumed that the Conv-2 system represents unchanged, baseline levels in total C and N. Using this assumption, measurements taken with combustion gas analysis in 1996 indicate that total C in the 0- to 15-cm depth had increased by 23, 13, and 0.5% in the organic, low-input, and Conv-4 systems, respectively, since 1988 (Table 3). The slight increase in total C in the Conv-4 system can probably be attributed to the rotation, as corn residue contributes substantially to C inputs preceding wheat in that rotation (Table 4; corn residue calculated as an input to the wheat or oat–vetch systems). No significant differences in bulk density have been found among treatments (D. Friedman, personal communication, 1997). Thus, using a bulk density of 1.3 Mg m⫺3 in the 0- to 15-cm soil depth for all farming systems, increases in total C over the 8-yr period were 546, 314, and 12 kg C ha⫺1 yr⫺1 in the organic, low-input, and Conv-4 systems, respectively. These increases in total C are highly correlated with C balance values calculated as the difference between inputs and outputs (r ⫽ 0.94, n ⫽ 4, P ⫽ 0.03).
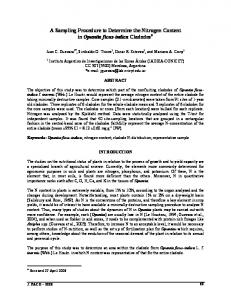
The slope of the linear regression equation for actual vs. calculated annual C increases (total C increase ⫽ ⫺261 ⫹ [0.07 C balance value]) indicates that 7% of the net C inputs from organic sources (plant residues and manures) remain in the soil as organic matter. Using the Conv-2 system as baseline data for total N in the 0- to 15-cm soil depth indicates increases of 22, 14, and 0% in the organic, low-input, and Conv-4 systems, respectively (Table 3). In contrast to total C, the total N balance values were not correlated significantly with actual N increases in the soil (r ⫽ 0.46, n ⫽ 4, P ⫽ 0.89). Using the bulk density of 1.3 Mg m⫺3 for the 0- to 15cm soil depth, a 22% increase in total N in the organic system equals the addition of 58.5 kg N ha⫺1 yr⫺1. This value is somewhat lower than 73 kg N ha⫺1 yr⫺1 balance estimated in the nutrient budgets (Fig. 3), indicating a loss of about 20% of N inputs. By contrast, the 14% increase in total N in the low-input system equals 36.5 kg N ha⫺1 yr⫺1; thus, the N balance value of 25 kg N ha⫺1 yr⫺1 underestimates the actual increase in total N (Fig. 3). The differences in predicted and actual in-
668
AGRONOMY JOURNAL, VOL. 90, SEPTEMBER–OCTOBER 1998
Table 5. Exchangeable calcium and exchangeable magnesium (cmol kg⫺1) of soils from the four farming system treatments in September, 1996. Farming system treatment Soil variable Exchangeable Ca
Exchangeable Mg
Exch. Ca:Mg ratio
Soluble Ca:Mg ratio
Depth cm 0–30 0–15 15–30 0–30 0–15 15–30 0–30 0–15 15–30 0–30 0–15 15–30
Organic 7.94a† 8.12a 7.77 9.58b 9.81 9.37b 0.83a 0.83a 0.83a 0.56a 0.56a 0.58a
Low-input cmol 7.85a 7.96ab 7.75 9.99ab 10.15 9.84a 0.79b 0.79b 0.89ab 0.55a 0.54a 0.58a
Conv-4
Conv-2
kg⫺1 7.47b 7.43b 7.52 10.05ab 10.17 9.93a 0.75c 0.73c 0.76b 0.52b 0.50b 0.53b
7.52b 7.44b 7.61 10.23a 10.24 10.23a 0.74c 0.73c 0.75b 0.52b 0.51b 0.54b
† Means followed by different letters within a row are significantly different (ANOVA, Student–Newman–Keuls, P ⱕ 0.05).
Fig. 3. Farm-level nutrient budget estimates (inputs, outputs, and balances) of C, N, P, K, Ca, and Mg for the four farming system treatments of the SAFS project, 1989 to 1996 (organic, low-input, and conventionally managed 4- or 2-yr rotations). Cumulative elemental inputs of P, K, Ca, and Mg were determined from fertilizer and manure applications. Total N inputs were calculated from fertilizer and manure applications and assumed symbiotic N fixation from legumes equivalent to 50% of N in the aboveground biomass. Total C inputs were based on manure applications, preceding cover crop biomass, and previous cash crop residue following harvest. Outputs were determined from content in harvested crops. Losses due to leaching, respiration, volatilization, and/or denitrification were not accounted for in the balances.
creases in total N in the organic and low-input systems may be due to differences in N fixation rates, root production, and/or losses via leaching or denitrification, none of which are accounted for in the budgets. Nitrogen fixation rates would be expected to be higher in the low-input system, because N inputs were lower than in
the organic system. The calculated N balance value for the Conv-4 system is 46 kg N ha⫺1 yr⫺1, which is higher than that of the low-input system, yet the Conv-4 system showed no increase in total N over the Conv-2 system. This analysis suggests that all of the N applied in excess of harvested outputs has been lost from the Conv-4 system. The relative levels of soluble P and exchangeable K found in the four farming system soils in 1996 were consistent with nutrient budgets (Fig. 2 and 3). Soluble P levels in the 0- to 15-cm soil depth were highly correlated with P balance estimates (r ⫽ 0.99, P ⫽ 0.007). Similarly, exchangeable K levels in the 0- to 15-cm soil depth were highly correlated with K balance estimates (r ⫽ 0.97, P ⫽ 0.026). These correlations were not statistically significant at 0 to 30 cm or at 15 to 30 cm (P ⬎ 0.05), indicating that the balance estimates are most indicative of nutrient dynamics in the upper 15 cm of soil. Nutrient budgets showed that P was applied in excess of removal by the organic and Conv-2 systems, while P inputs in the low-input and Conv-4 systems more closely matched outputs (Fig. 3). Manure applications to the tomato and corn crops account for the high P inputs to the organic system, while P fertilizer applications to the tomato and wheat crops in the Conv-2 only slightly exceeded outputs (Table 4). Inputs of K were also highest in the organic system due to manure inputs; however, K outputs exceeded inputs in all farming systems (Fig. 3). Harvested tomato fruit, which typically contains 5 to 7% K as dry weight, accounted for most of the total K output of each system (Table 4). Measurements of soluble Ca and Mg did not show consistent patterns over the 8 yr of the study; however, clear treatment differences in soluble Ca and Mg, exchangeable Ca and Mg, and Ca:Mg ratios were evident in 1996 (Fig. 2; Table 5). Although soluble Ca and soluble Mg levels were greater in the Conv-4 and Conv-2 systems compared with the low-input and organic systems, exchangeable Ca and Ca:Mg ratios (exchangeable and soluble) were significantly greater in the organic and low-input systems (Table 5). Exchangeable Mg was greater in the conventional systems than in the organic
CLARK ET AL.: SOIL CHEMICAL PROPERTIES WITH ORGANIC AND LOW-INPUT FARMING
system (Table 5). The observed patterns in exchangeable Ca were not significantly correlated with Ca balance estimates (r ⫽ 0.82, n ⫽ 4, P ⫽ 0.18), but appear to be at least partially related to Ca inputs and outputs. The organic and low-input systems received Ca inputs in manure applications, but the conventional systems did not (Fig. 3). In contrast, Mg concentrations in the applied manure and compost were low and resulted in relatively low Mg inputs.
DISCUSSION Most of the changes in soil chemical properties observed over the 8-yr period of this study are largely explained by differences in inputs. Higher inputs of C, N, P, and K resulted in increased soil organic C and N, soluble P, and exchangeable K in the organic farming system. Total N appeared to be related partially to inputs; however, differences in N fixation, leaching, and/ or denitrification were not considered in the N budgets and may account for some the inconsistencies between predicted and measured total N levels. Differences in the efficiency of the farming systems to store excess N inputs are also suggested by the findings of this study. The low-input system seemed to be most efficient in storing excess N, and the conventional systems were least efficient. Changes observed in soluble Ca and Mg did not appear to be the direct result of Ca and Mg inputs. Long-term changes in soil pH occur largely as a result of displacing cations or adding sources of acidity such as H⫹ and Al3⫹ on the cation exchange complex of soils (Tisdale et al., 1993). All treatments experienced an increase in soil pH from 1988 to 1992, which may be attributable to factors such as changes in fertilizer practices, rotation effect, and plant residue management. A reduction in NH4 fertilizer use at this site following the initiation of the SAFS project is the most likely explanation of an increase in soil pH in all systems. In the conventional treatments, the soil pH stabilized from 1992 to 1996. In the low-input and organic treatments, there has been a consistent increase in soil pH since the inception of the SAFS project. Besides the reduction or elimination of NH4 fertilizers, the addition of cations via manure applications has resulted in higher pH levels in the organic and low-input systems, The rise in soil pH in the low-input system has been similar to the organic system, even though manure inputs stopped following 1992. The addition of cover crops in these systems may provide an additional source of cations, possibly from lower soil depths, that are released at the soil surface through leaching and decomposition activities. This may explain observed changes in surface (0–15 cm) soil pH compared with subsurface soil (15–30 cm) in the low-input and organic treatments. Though changes in soil pH were attributable to cropping system management, the soil pH values in all systems remained within the range for optimal nutrient availability. Increases in soil C were expected to result from the use of manure and cover crops in the organic and lowinput systems. These increases were evident after 4 yr
669
of crop production, but appeared to stabilize or even decline slightly during the second 4 yr of the study. The most pronounced change during this period was the decline in organic C in the low-input system, which apparently resulted from the discontinuance of manure applications after 1991 in that treatment. These findings indicate that the manure inputs were important in increasing organic C. Other studies have shown that soil OM responds linearly to changes in the rates of organic matter inputs (Rasmussen and Collins, 1991). The importance of organic input composition is considered secondary to the amount added (Larson et al., 1972; Campbell and Zentner, 1993). Higher soil OM levels are typically found in soils managed with organic inputs, including animal manure and cover crops, than in soils managed without such inputs (Lockeretz et al., 1981; Alvarez et al., 1988; Reganold, 1988; Sommerfeldt et al., 1988; Drinkwater et al., 1995). However, studies on the transition from conventional to organic or low-input practices show that increases in soil OM occur slowly and can take several years to detect. For example, Wander et al. (1994) reported soil OM increases of only a few tenths of a percent after 10 yr of organic management at the Rodale Institute Research Center’s Farming Systems Trial in Pennsylvania. Werner (1997) found no significant differences in organic C after 2 yr of organic orchard management in central California. Based on a literature review of studies in semiarid regions, Rasmussen and Collins (1991) reported that soil organic C levels typically increase at a rate of 10 to 25% of the amount of C added and that greater C retention rates are expected with increasing precipitation and decreasing cropping intensity. The soil organic C accumulation rate determined in this study was somewhat lower than most values in the literature. About 7% of the C added could be accounted for by increases in soil organic C. Given the high temperatures, water availability, and use of tillage in this study, high turnover rates would be expected, leading to smaller net increases in soil OM. Changes in soil OM quality may be more important than soil OM quantity in influencing soil quality and fertility status (Rasmussen and Collins, 1991; Wander et al., 1994; Werner, 1997). Microbial biomass C constitutes one of the more labile pools of C in soil OM and is considered to be more sensitive than total soil OM to changes in agricultural management (Smith and Paul, 1989). Even small increases in soil OM, if associated with biologically active soil OM, may provide substantial fertility benefits (Rasmussen and Parton, 1994; Tiessen et al., 1994; Agbenin and Goladi, 1997). By 1992, microbial biomass C measured by fumigation extraction was significantly higher in both the organic and low-input than conventional systems throughout most of the growing season (Scow et al., 1994; Gunapala and Scow, 1998), and potentially mineralizable N (Drinkwater et al., 1996) has been consistently highest in the organic, intermediate in the low-input, and lowest in the conventional cropping systems at the SAFS site (M.S. Clark, unpublished data, 1998).
670
AGRONOMY JOURNAL, VOL. 90, SEPTEMBER–OCTOBER 1998
Most studies of soils in organic and conventional farming systems have found higher K levels in organic systems (Alvarez et al., 1988; Reganold, 1988; Drinkwater et al., 1995). Many comparisons show that P levels do not necessarily increase as a result of organic practices (Lockeretz et al., 1981; Reganold et al., 1993; Drinkwater et al., 1995; Werner, 1997). In this study, the observed changes in soluble P and exchangeable K appear to be the direct result of inputs. The greatest amounts of P and K were applied to the organic system as constituents of the manure. Applications of P over the 8 yr of the study met or exceeded outputs in crop yields in all systems; however, the discontinuance of manure applications in the low-input system appeared to result in a significant decline in soluble P levels in that system between 1992 and 1996. This system may require P inputs in the future to maintain crop productivity. In contrast to P, outputs of K have exceeded inputs in all farming systems. Nevertheless, exchangeable K levels in the organic and Conv-4 systems were higher in 1996 than in 1988 and remained constant in the low-input and Conv-2 systems. This indicates that the available K pools removed through crop harvest have been replenished by the weathering of soil minerals or redistribution from lower depths and that inputs from manure and fertilizer simply increased K levels. Soluble Ca and Mg and EC showed significant treatment effects; however, patterns were not consistent over the study period. Electrical conductivity is a measure of total cations and anions in solution and is usually determined largely by Ca and Mg ions. Electrical conductivity levels have been found to be tightly linked to NO3 concentrations in the soil (Patriquin et al., 1993). Nitrification (oxidation of NH4 to NO3) acidifies soil, bringing cations into solution. Thus, Ca and Mg concentrations in solution and EC levels are highly dependent on N fertility practices and would be expected to vary throughout the year. Consequently, the soil samples taken for this study provide only snapshots of these variables, rather than detailed descriptions of their dynamics over the study period. Although significant differences in EC were found, EC values in all treatments remained below levels considered to be potentially problematic for crop growth (Calif. Fertilizer Assoc., 1995). The relatively low and stable EC levels in the organic system indicate that the use of animal manures has not resulted in increased salinity. Exchangeable pools of Ca and Mg are the primary reserves of these cations for solution and are more stable than soluble pools over time. Measurements taken in 1996 showed higher exchangeable Ca and lower exchangeable Mg in the organic compared with the conventional systems. This pattern is consistent with the Ca and Mg budgets, as substantially more Ca than Mg has been applied to the organic system in the manure. Ratios of Ca:Mg were quite low in all treatments, but were somewhat higher in the organic and low-input systems compared with the conventional systems. Although optimal ranges for soil Ca:Mg ratios have been proposed for improved crop growth, studies indicate that soil Ca:Mg ratios are not important determinants
of yield (Eckert and McLean, 1981; Liebhardt, 1981; Haby et al., 1990; Reid, 1996). However, adequate base cation pools, largely comprised of Ca and Mg, are necessary to maintain soil pH within the optimal range of nutrient uptake. In addition, increases in exchangeable Mg levels may influence water infiltration rates negatively in arid and semiarid regions by causing the soil surface to seal (Keren, 1991). In summary, the use of organic farming practices in California’s Sacramento Valley over an 8-yr period resulted in higher soil organic C, soluble P, exchangeable K, and pH. These changes were also apparent in the low-input system at the 1992 sampling. However, the discontinuance of manure applications in that system resulted in some decline in organic C and soluble P and, to a lesser extent, exchangeable K, between 1992 and 1996. After 8 yr, soil total C in the organic and lowinput systems was 23 and 13% higher, respectively, than that of the Conv-2 system used as the baseline. Similarly, soil total N in those systems was 22 and 14% higher, respectively. Based on nutrient budgets and soil total N levels, the low-input and organic farming systems appeared to be more efficient than the conventional systems in storing excess N inputs. As expected, soluble Ca and Mg and EC were tightly linked and although significant treatment differences were found, the absolute differences in these variables were relatively minor. Exchangeable Ca was higher and exchangeable Mg was lower in the organic and low-input systems than in the conventional systems, apparently as a result of high Ca concentrations in the manure. This study indicates that the use of animal manure and cover crops and the reduction or elimination of synthetic N fertilizer results in increased soil OM and the storage of nutrients, which can provide long-term fertility benefits. ACKNOWLEDGMENTS The authors acknowledge the work of Diana Friedman, Oscar Somasco, and Mary Kirk Wyland, former research managers on the SAFS project, and William Cruickshank and Don Stewart, SAFS crop production managers. Many faculty, staff, and students from the University of California at Davis have also contributed to the project over the years. We acknowledge the University of California’s Division of Agriculture and Natural Resources (UC DANR) Analytical Laboratory for conducting the soil and plant analyses. Support for the SAFS project has been provided by USDA/EPA SARE/ACE, University of California Sustainable Agriculture and Education (UC SAREP) Program, California Department of Food and Agriculture (CDFA) Fertilizer Research and Education Program (FREP), and University of California Division of Agriculture and Natural Resources (UC DANR).
REFERENCES Agbenin, J.O., and J.T. Goladi. 1997. Carbon, nitrogen, and phosphorus dynamics under continuous cultivation as influenced by farmyard manure and inorganic fertilizers in the savanna of northern Nigeria. Agric. Ecosyst. Environ. 63:17–24. Alvarez, C.E., C. Garcı´a, and A.E. Carracedo. 1988. Soil fertility and mineral nutrition of an organic banana plantation in Tenerife. Biol. Agric. Hortic. 5:313–323. Alvarez, C.E., A.E. Carracedo, E. Iglesias, and M.C. Martinez. 1993. Pineapples cultivated by conventional and organic methods in a
CLARK ET AL.: SOIL CHEMICAL PROPERTIES WITH ORGANIC AND LOW-INPUT FARMING
soil from a banana plantation: A comparative study of soil fertility, plant nutrition, and yields. Biol. Agric. Hortic. 9:161–171. California Certified Organic Farmers (CCOF). 1995. California Certified Organic Farmers certification handbook. CCOF, Santa Cruz. California Department of Food and Agriculture. 1996. California agricultural resource directory including agricultural production and export statistics for 1995. Calif. Dep. of Food and Agric., Sacramento. California Fertilizer Association. 1995. Western fertilizer handbook. Interstate Publ., Danville, IL. Campbell, C.A., and R.P. Zentner. 1993. Soil organic matter as influenced by crop rotations and fertilization. Soil Sci. Soc. Am. J. 57:1034–1040. Drinkwater, L.E., D.K. Letourneau, F. Workneh, A.H.C. van Bruggen, and C. Shennan. 1995. Fundamental difference between conventional and organic tomato agroecosystems in California. Ecol. Appl. 5:1098–1112. Drinkwater, L.E., C.A. Cambardella, J.D. Reeder, and C.W. Rice. 1996. Potentially mineralizable nitrogen as an indicator of biologically active soil nitrogen. p. 217–229. In J.D. Doran and A.J. Jones (ed.) Methods for assessing soil quality. SSSA Spec. Publ. 49. SSSA, Madison, WI. Eckert, D.J., and E.O. McLean. 1981. Basic cation saturation ratios as a basis for fertilizing and liming agronomic crops: I. Growth chamber studies. Agron. J. 73:795–799. Garcı´a, C., C.E. Alvarez, A. Carracedo, and E. Iglesias. 1989. Soil fertility and mineral nutrition of a biodynamic avocado plantation in Tenerife. Biol. Agric. Hortic. 6:1–10. Gunapala, N., and K.M. Scow. 1998. Dynamics of soil microbial biomass and activity in conventional and organic farming systems. Soil Biol. Biochem. 30:805–816. Haby, V.A., M.P. Russelle, and E.O. Skogley. 1990. Testing soils for potassium, calcium, and magnesium. p. 181–227. In R.L. Westerman (ed.) Soil testing and plant analysis. 3rd ed. SSSA Book Ser. No. 3. SSSA, Madison, WI. Keren, R. 1991. Specific effect of magnesium on soil erosion and water infiltration. Soil Sci. Soc. Am. J. 55:783–787. Knudsen, D., G.A. Peterson, and P.F. Pratt. 1982. Lithium, sodium, and potassium. p. 225–246. In A.L. Page et al. (ed.) Methods of soil analysis. Part 2. Chemical and microbial methods. 2nd ed. Agron. Monogr. 9. ASA and SSSA, Madison, WI. Lanyon, L.E., and W.R. Heald. 1982. Magnesium, calcium, strontium, and barium. p. 247–262. In A.L. Page et al. (ed.) Methods of soil analysis. Part 2. Chemical and microbial methods. 2nd ed. Agron. Monogr. 9. ASA and SSSA, Madison, WI. Larson, W.E., C.E. Clapp, W.H. Pierre, and Y.B. Morachan. 1972. Effects of increasing amounts of organic residues on continuous corn: II. organic carbon, nitrogen, phosphorus, and sulfur. Agron. J. 64:204–208. Liebhardt, W.C. 1981. The basic cation saturation ratio concept and lime and potassium recommendations on Delaware’s Coastal Plain soils. Soil Sci. Soc. Am. J. 45:544–549. Lockeretz, W., G. Shearer, and D.H. Kohl. 1981. Organic farming in the corn belt. Science (Washington, DC) 211:540–547. Nelson, D.W., and L.E. Sommers. 1982. Total carbon, organic carbon, and organic matter. p. 539–580. In A.L. Page et al. (ed.) Methods of soil analysis. Part 2. Chemical and microbial methods. 2nd ed. Agron. Monogr. 9. ASA and SSSA, Madison, WI. Olsen, S.R., C.V. Cole, F.S. Watanabe, and L.A. Dean. 1954. Estimation of available phosphorus in soils by extraction with sodium bicarbonate. USDA Circ. 939:1–19. Papastylianou, I., and S.K.A. Danso. 1991. Nitrogen fixation and trans-
671
fer in vetch and vetch–oats mixtures. Soil Biol. Biochem. 23: 447–452. Patriquin, D.G., H. Blaikie, M.J. Patriquin, and C. Yang. 1993. Onfarm measurements of pH, electrical conductivity, and nitrate in soil extracts for monitoring coupling and decoupling of nutrient cycles. Biol. Agric. Hortic. 9:231–272. Pella, E. 1990a. Elemental organic analysis. Part 1: Historical developments. Am. Lab. 22(3):116–125. Pella, E. 1990b. Elemental organic analysis. Part 2: State of the art. Am. Lab. 22(12):28–32. Rasmussen, P.E., and H.P. Collins. 1991. Long-term impacts of tillage, fertilizer, and crop residue on soil organic matter in temperate semiarid regions. Adv. Agron. 45:93–134. Rasmussen, P.E., and W.J. Parton. 1994. Long-term effects of residue management in wheat–fallow: I. Inputs, yield, and soil organic matter. Soil Sci. Soc. Am. J. 58:523–530. Reganold, J.P. 1988. Comparison of soil properties as influenced by organic and conventional farming systems. Am. J. Altern. Agric. 3:144–155. Reganold, J.P., A.S. Palmer, J.P. Lockhart, and A.N. Macgregor. 1993. Soil quality and financial performance of biodynamic and conventional farms in New Zealand. Science (Washington, DC) 260:344–349. Reid, W.S. 1996. Influence of lime and calcium:magnesium ratio on alfalfa and birdsfoot trefoil yields. Commun. Soil Sci. Plant Anal. 27:1885–1900. Rennie, R.J., and G.A. Kemp. 1983. N2–fixation in field beans quantified by 15N isotope dilution: I. Effect of strains of Rhizobium phaseoli. Agron. J. 75:640–644. Rhoades, J.D. 1982. Soluble salts. p. 167–180. In A.L. Page et al. (ed.) Methods of soil analysis. Part 2. Chemical and microbial methods. 2nd ed. Agron. Monogr. 9. ASA and SSSA, Madison, WI. Scow, K.M., O. Somasco, N. Gunapala, S. Lau, R. Venette, H. Ferris, R. Miller, and C. Shennan. 1994. Transition from conventional to low-input agriculture changes soil fertility and biology. Calif. Agric. 48(5):20–26. Smith, J.L., and E.A. Paul. 1989. The significance of soil microbial biomass estimates in soil. Soil Biochem. 6:357–396. Sommerfeldt, T.G., C. Chang, and T. Entz. 1988. Long-term annual manure applications increase soil organic matter and nitrogen, and decrease carbon to nitrogen ratio. Soil Sci. Soc. Am. J. 52: 1668–1672. Stivers, L.J., and C. Shennan. 1991. Meeting the nitrogen needs of processing tomatoes through winter cover cropping. J. Prod. Agric. 4:330–335. Temple, S.R., D.B. Friedman, O. Somasco, H. Ferris, K. Scow, and K. Klonsky. 1994. An interdisciplinary experiment station-based participatory comparison of alternative crop management systems for California’s Sacramento Valley. Am. J. Altern. Agric. 9:64–71. Tisdale, S.L., W.L. Nelson, J.D. Beaton, and J.L. Havlin. 1993. Soil fertility and fertilizers. 5th ed. Macmillan Publ. Co., New York. Tiessen, H., E. Cuevas, and P. Chacon. 1994. The role of soil organic matter in sustaining soil fertility. Nature (London) 371:783–785. University of California. 1996. UC IPM pest management guidelines: Tomato. IC-DANR Publ. 3339. (Available on-line with updates at http://ipm.ucdavis.edu/PMG/selectnewpest.tomatoes.html.) Wander, M.M., S.J. Traina, B.R. Stinner, and S.E. Peters. 1994. Organic and conventional management effects on biologically active organic matter pools. Soil Sci. Soc. Am. J. 58:1130–1139. Werner, M.W. 1997. Soil quality characteristics during conversion to organic orchard management. Appl. Soil Ecol. 5:151–167. Yagodina, M.S., and E.P. Trepachev. 1990. Nitrogen-fixing capabilities and yields of vetch and vetch–oat mixture at various phosphate levels of soil. Biol. Bull. Acad. USSR 16:184–193.