e, θ0, θ1, and skating v were determined every lap during a 5000-m World Cup. Second, the ..... laps 7â9 and 10â12) results in a final drop in v of 0.056 m/s.
International Journal of Sports Physiology and Performance, 2013, 8, 188-194 © 2013 Human Kinetics, Inc.
www.IJSPP-Journal.com ORIGINAL INVESTIGATION
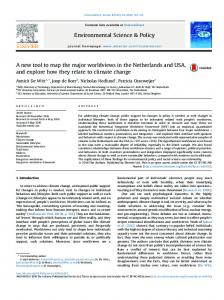
Changes in Speed Skating Velocity in Relation to Push-Off Effectiveness Dionne A. Noordhof, Carl Foster, Marco J.M. Hoozemans, and Jos J. de Koning Speed skating posture, or technique, is characterized by the push-off angle or effectiveness (e), determined as the angle between the push-off leg and the ice; the preextension knee angle (θ0); and the trunk angle (θ1). Together with muscle-power output and environmental conditions, skating posture, or technique, determines velocity (v). Purpose: To gain insight into technical variables that are important to skate efficiently and perform well, e, θ0, θ1, and skating v were determined every lap during a 5000-m World Cup. Second, the authors evaluated if changes (Δ) in e, θ0, and θ1 are associated with Δv. Methods: One camera filmed the skaters from a frontal view, from which e was determined. Another camera filmed the skaters from a sagittal view, from which θ0 and θ1 were determined. Radio-frequency identification tags around the ankles of the skaters measured v. Results: During the race, e progressively increased and v progressively decreased, while θ0 and θ1 showed a less consistent pattern of change. Generalized estimating equations showed that Δe is significantly associated with Δv over the midsection of the race (β = –0.10, P < .001) and that Δθ0 and Δθ1 are not significantly associated with Δv. Conclusions: The decrease in skating v over the race is not due to increases in power losses to air friction, as knee and trunk angle were not significantly associated with changes in velocity. The decrease in velocity can be partly ascribed to the decrease in effectiveness, which reflects a decrease in power production associated with fatigue. Keywords: gross efficiency, fatigue, kinematics, performance Speed skating performance depends on the mechanical power output (PO) that can be delivered by the skater and the amount of power that is necessary to overcome frictional forces (PF; eg, ice and air friction). The balance between PO and PF determines the change in momentary skating velocity (v). Because of the cyclic nature of speed skating, PO is defined by the external work per stroke (A) that can be produced by the athlete times stroke frequency (f).1 Analyses of different speed skating events by van Ingen Schenau et al2 and de Boer et al3 have shown that differences in PO within a skater, between different speed skating distances, are achieved by changing f, while differences between skaters are mainly due to differences in A. In addition, van Ingen Schenau et al4 showed that A decreases during a race and that the decrease is smaller in elite than in trained speed skaters. Producing a high A and maintaining this during the race is thus important to deliver a high PO and to perform well. Power production in speed skaters has been associated with kinematic characteristics of the skating technique. A small preextension knee angle (θ0, Figure 1[A]) and an effective directed push-off, reflected by a Noordhof, Hoozemans, and de Koning are with MOVE Research Institute Amsterdam, the Faculty of Human Movement Sciences, VU University Amsterdam, Amsterdam, The Netherlands. Foster is with the Dept of Exercise and Sport Science, University of Wisconsin-La Crosse, La Crosse, WI.
188
small e (effectiveness), the angle between the push-off leg and the horizontal (Figure 1[B]), have been identified as important for delivering a high A.2,3 De Koning et al5 studied the differences in push-off force between 3 male skaters of different performance levels. They showed that push-off force and performance were not related but that A and performance were, which suggests that the skaters with high values for A are likely pushing off more effectively instead of harder. Another sport in which technique is important for performance is cross-country skiing.6 Sandbakk et al7 investigated the relationship between physical and kinematic variables and gross efficiency (GE) in cross-country skiers and found that world-class cross-country skiers had a higher GE during submaximal skating (G3 technique) than did national-level skiers. GE can be defined as the ratio between mechanical PO and metabolic power input.8 Since aerobic and anaerobic capacity did not seem to differ between skiers of different levels,7 it appears that it is important to have a high GE to be able to deliver a high mechanical PO and become a world-class skier. The world-class and national-level cross-country skiers also differed in cycle length and cycle rate (eg, conceptually similar to A and f in the analysis of speed skating1,2), with the world-class skiers having a longer cycle length and lower cycle rate.7 By defining the relationship between kinematic (eg, technical) variables and performance outcomes it might be possible to get more insight into
Speed Skating Technique and Performance 189
Figure 1 — Kinematic characteristics of the speed skating technique. (A) Preextension knee angle (θ0) and trunk angle (θ1) in the y–z plane. (B) Effectiveness (e) in the x–z plane.
variables that are important to ski or skate efficiently and perform well. Speed skating, in the specific skating posture, has some major effects on muscle physiology.9 The large intramuscular forces resulting from the crouched position appear to compromise blood flow, resulting in muscle O2 desaturation and increased blood lactate accumulation.9 Accordingly, the specific skating posture may result in local muscle fatigue, which might affect skating technique. Logically, this may compromise skating GE and exacerbate the loss of muscle-power production, which most likely reduces A and contributes to reductions in skating v. As e is probably the most related to efficiency, studying e will give us insight into changes in GE during the race. A decrease in skating GE during the course of skating events will result in a lower delivered PO, even when one assumes that the actual muscle PO stays the same, with a resulting decrease in v. Alternatively, it is also possible that the amount of power lost to air friction increases during the race due to an increase in θ0 and trunk angle (θ1; Figure 1[A]), also resulting in decreases in v. Changes in kinematic (eg, technical) variables may thus influence power production (PO) and/or power dissipation (PF). Thus far, a constant GE has been assumed during highintensity speed skating events,10 and changes in θ0 and θ1 during races have only been reported for the 1500-m in an experimental setting.10 To get more insight into the cause of variations in v10 during speed skating races, the magnitude of changes in kinematic variables within a race needs to be determined. Previous studies on speed skating and cross-country skiing determined differences in technique and performance between athletes2,3,7,11 or within athletes between different racing distances.2,10 The current study will, however, focus on changes in technique and v within individual athletes during a race. A 5000-m speed skating event was chosen, as there are many complete laps (12) during which kinematic variables and v can be analyzed, and we expected that these variables would change substantially over the course of this event.
The first purpose of this study was to determine e, θ0, θ1, and v during the course of a 5000-m World Cup event. The second purpose was to evaluate whether changes in e and changes in θ0 and θ1 are associated with changes in v. In this way, more insight will be gained into how changes in kinematic (ie, technical) variables affect changes in v.
Methods Subjects Two-dimensional video recordings of 34 male elite speed skaters were made during an ISU (International Skating Union) 5000-m World Cup race held on November 15, 2008, in Thialf, Heerenveen (the Netherlands). The study was sanctioned by the ISU.
Data Acquisition Frontal Cameras. Two JVC GR-DX317E mini digitalvideo cameras (JVC USA, Wayne, NY) were placed at the end of the straight part of the 400-m ice rink, one filming the inner lane and the other filming the outer lane (Figure 2). These 2 video cameras filmed the skaters from a frontal view, which made it possible to determine e. To increase the time resolution of both cameras, images were split by deinterlacing, which resulted in a frame rate of 50 Hz. Every lap e was determined from 1 stroke in the analyzing section (Figure 2), independent of the right or left leg. The 2 frames just before the moment the hinge of the klapskate of the push-off leg opened were used to determine the average e of each lap, because this moment can be determined the most objectively. Twodimensional pixel coordinates of the middle of the pushoff leg at the height of the hip (Figure 1[B]) and the tip of the skate blade were determined.12 The angle between the push-off leg and the ice represented e. A correction for a slightly skewed camera position was made to the calculated e using the vertical coordinates of 2 markers that were placed at both sides of the individual lanes in the analyzing section.
190 Noordhof et al
Figure 2 — Overview of Thialf, the 400-m ice rink in Heerenveen (The Netherlands). The dots represent the 4 cameras. Kinematic characteristics and skating velocity were determined in the analyzing section using the radio-frequency identification tags around the ankles.
Sagittal Cameras. Another set of cameras was placed on the infield of the 400-m ice rink perpendicular to the skating direction, filming from a sagittal view (Figure 2), from which θ0 and θ1 could be determined. One of the 2 panning Canon XM2 digital-video cameras (Canon USA, Lake Success, NY) filmed the skater who started in the inner lane every lap, and the other camera filmed the skater who started in the outer lane every lap. Skaters were filmed during almost the entire straight part of the lap, where they do not switch between inner and outer lane. However, only the stroke where the camera was most perpendicular to the gliding direction of the skater, independent of the right or left leg, was used for kinematic analysis. After deinterlacing, 2-dimensional pixel coordinates of the middle of the neck, hip joint, knee, and ankle were determined for 2 frames during the midsection of the gliding phase, as θ0 and θ1, determined at this instant are part of the equation for air friction in speed skating.13 During the gliding phase the trunk moves over the skate from the lateral to the medial side1; the midsection of the gliding phase was therefore defined as the moment at which the trunk is exactly above the skate. Immediately after this moment the push-off starts. The y-coordinates (left–right direction) were corrected for not being filmed completely perpendicular to the gliding direction, due to the fixed camera location (Figure 3). The average θ0 and θ1 of each lap were determined by averaging both angles over these 2 successive frames.
Skating Velocity Each skater was equipped with radio-frequency identification tags around the ankles, which were used to measure v on each section of the ice rink (Figure 2). The average v was determined over sections 5 and 6, which corresponds to the analyzing section, where e, θ0, and θ1 were determined.
Figure 3 — Representation of the correction for filming not completely perpendicular to the gliding direction. Distance d1 was determined based on number of frames from completely perpendicular skating velocity, and distance d2 was known. The corrected y-coordinates were calculated using y′ = (1/cos α)y.
Speed Skating Technique and Performance 191
Data Analysis and Statistics The start of a speed skating race is significantly different from the remaining part of the race, so the first 200 m of the race were excluded. To get a general idea of the changes in skating technique over the race, e, θ0, θ1, and v were averaged over 3 successive 400-m laps, which resulted in 4 averaged values representing laps 1 to 3, 4 to 6, 7 to 9, and 10 to 12. The differences in kinematic variables and v between different race sections were tested using repeated-measures ANOVA (PASW statistics 18.0, IBM Corp). If the assumption of sphericity was met, post hoc comparisons were tested using contrasts, and when the assumption of sphericity was violated, the degrees of freedom were adapted using the Greenhouse Geisser correction, and post hoc comparisons were tested using the Bonferroni method. Changes (Δ) were determined between these averaged values. The change between race sections was described as Δlap, the change between laps 1 to 3 and laps 4 to 6 is described as Δlap = 1, the change between laps 4 to 6 and 7 to 9 as Δlap = 2, and the change between laps 7 to 9 and 10 to 12 as Δlap = 3. The relationship between Δe and Δv and between Δθ0 and Δθ1 and Δv, with part of the race as covariate, was established using generalized estimating equations (GEE), a regression-analysis technique that accounts for the dependency of the repeated measurements. There was no perfect multicollinearity between Δθ0 and Δθ1, which
allowed the use of both Δθ0 and Δθ1 in the regression equation. An independent working correlation matrix was chosen. Interaction terms were included when significant. Residuals were checked for normality, and a significance level of P < .05 was used.
Results Over the course of a 5000-m race, e increased significantly (F2.2,71.4 = 16.6, P < .001; Figure 4[A]). The difference in e was significant between all race sections, except between laps 1 to 3 and 4 to 6 and between laps 7 to 9 and 10 to 12. A significant increase was also seen in θ0 (F3,99 = 8.3, P < .001; Figure 4[B]); the difference in θ0 between laps 1 to 3 and all other race sections was significant. A significant decrease was seen in θ1 (F2.2,74.0) = 10.2, P < .001; Figure 4[C]); θ1 was significantly lower over laps 10 to 12 than in all other race sections. Skating v showed a significant decrease from the beginning to the end of the race (F1.6,51.2 = 28.6, P < .001); all differences were significant (Figure 4[D]). The results of the GEE analyses between Δe and Δv are summarized in Table 1. To understand the meaning of the significant interaction effect between Δlap = 2 and Δe, the GEE analysis was repeated with Δlap = 2 (Table 1B) and Δlap = 3 (Table 1C) also as references. The GEE results indicate that Δe is associated with Δv.
Figure 4 — Kinematic characteristics of the speed skating technique and skating velocity over the course of an official 5000-m event, mean ± SD. (A) Effectiveness (e). (B) Preextension knee angle (θ0). (C) Trunk angle (θ1). (D) Skating velocity (v). 1Significantly different from laps 1–3. 2Significantly different from laps 4–6. 3Significantly different from laps 7–9. 4Significantly different from laps 10–12.
192 Noordhof et al
Table 1 GEE Results of the Relationship Between Changes in Effectiveness and Changes in Velocity Reference
Parameter
Δlap = 1
Δlap = 2
Intercept Δe Δlap = 3 Δlap = 2 Δlap = 1 [Δlap = 3] × Δe [Δlap = 2] × Δe [Δlap = 1] × Δe Intercept
Δlap = 3
Δe Δlap = 1 Δlap = 3 Δlap = 2 [Δlap = 1] × Δe [Δlap = 3] × Δe [Δlap = 2] × Δe Intercept Δe Δlap = 1 Δlap = 2 Δlap = 3 [Δlap = 1] × Δe [Δlap = 2] × Δe [Δlap = 3] × Δe
β
P
–0.10 –0.036 –0.031 –0.020 0 –0.020 –0.066 0 –0.12 –0.10 0.020 –0.011 0 0.066 0.046 0 –0.13 –0.056 –0.031 –0.011 0 –0.020 –0.046 0