volcanomagnetic observation on Mount St. Helens, Washington, Geophys. ... M.J. S. and F.D. STACEY, Volcano-magnetic effect observed on Mt. Ruapehu, New.
J. Geomag.Geoelectr., 42,277-290,1990
Changes
in the Geomagnetic Total Intensity Observed the Eruption of Oshima Volcano in 1986
before
T. YUKUTAKE, H. UTADA,T. YOSHINO, H. WATANABE, Y. HAMANO, Y. SASAI, E. KIMOTO, K. OTANI,and T. SHIMOMURA EarthquakeResearchInstitute,University of Tokyo,Bunkyo-ku,Tokyo113,Japan (ReceivedOctober4,1989;RevisedDecember5, 1989) Before the eruption of Oshima Volcano on November 15, 1986, 5 proton magnetometers were operating on the volcano. One of them, installed about 500 m south from the center of the central crater, recorded anomalous changesin the total intensity preceding the eruption. The anomalous variation began around 1981.The total intensity decreased gradually at a rate of -5.3 nT/year (-0.44 nT/month), amounting to a 27 nT decrease in 5 years. The decrease of the total intensity accelerated about six months before the eruption. The rate of decrease was estimated to be about -2.2 nT/ month. At the time of the eruption, a very fast and significantvariation was observed. The total intensitydecreased 4 nT in one minute. Following the eruption from the central cone, fissure eruptions took place on November 21. A decrease in the total intensity of about 7 nT was also observed at this time at a site 2 km southeast of the central cone. The observed magnetic changes preceding the eruption are supposed to have been caused by the volcanicbody being heated during the intrusion of magma, at the initial stage through the main vent, and at the later stage through a new path toward the newly formed crater, called A crater. The variation at the time of eruption is considered due to the disorientation of magnetic materials by the catastrophic outflow of gases and liquids through pores and cracks inside the volcano.
1. Introduction It has been a long sought answer in volcanology: whether or not the magnetic field changes in association with volcanic activity. Particularly regarding a basaltic volcano that contains large amounts of magnetic minerals, a significant change in the magnetic field has been expected to occur, since the magnetic minerals change their magnetization either when they are subjected to heating or cooling or when they are placed in a stress field. In 1936, TAKAHASIand NAGATA(1937) measured the three components of the magnetic field in Oshima Volcano to initiate its geomagnetic study. Associated with the eruption of Miyakezima Volcano in 1940, conspicuous changes in the magnetic field are reported to have occurred, the maximum change in the vertical component amounting to 500nT after the eruption (TAKAHASI and HIRANO, 1941a, b), and 16-30 minutes of arc in inclination (NAGATA,1941a; MINAKAMI,1941a, b). Since then, measurements of the magnetic field have been conducted on various volcanoes (NAGATA,1941b; JOHNSTONand STACEY,1969; TANAKA,1976; TANAKAet al.,1978; DAVIS et al., 1984; ZLOTNICKI 277
278
T. YUKUTAKE et al.
and LEM0UEL,1988). On Oshima Volcano, remarkable changes in the magnetic field were observed in association with eruptions from the central cone, Mihara-yama, in 1950 and 1951. RIKITAKE(1951a, b) repeated measurements of inclination after the eruption, and found large changes of inclination in the area surrounding the central cone immediately after the eruption in 1951. He reports a maximum decrease of 30 minutes of arc over 2 months near the central cone on the caldera floor. This change has been ascribed to thermal demagnetization of the interior of the volcano. When a spherical shape is assumed as the source of the demagnetization, Rikitake estimates that a sphere of 2 km radius located at a depth of 5 km has lost its magnetization of 3×10⁻²
emu/cc.
YOKOYAMA(1954a,
b)repeated
measurements
and
found
a
maximum decrease of 4 minutes of arc in inclination after a moderate eruption in 1953. He interprets this as being due to demagnetization by a thermal process, equivalent to the decrease in the moment of a dipole located at 1.6km depth, amounting
to
1.2×10¹³
emu(YOKOYAMA,1956).
In
order
to
monitor
the
magnetic
changes associated with volcanic activity, continuous observation of declination was conducted at two sites on Oshima Island, one at the west coast since 1951 and the other at the east coast from 1955 (YOKOYAMA, 1954a, 1957b, 1958, 1969; YUKUTAKE and YABU,1962). At the recovery stage from the eruption in 1951, a gradual increase in declination amounting to 7 minutes of arc was observed at the west coast station (NOM) for 6 years from 1951 to 1957. This has been interpreted as being caused by remagnetization of the volcano by cooling (RIKITAKE and YOKOYAMA,1955; YOKOYAMA,1969). The declination observation system has been replaced since around 1968 by a network of proton magnetometers to measure the total intensity. The new system has revealed deviation of the total intensity over Oshima Island from the normal trends of the secular change in the central part of Japan (FUJITA,1973; SUMITOMO, 1976; YUKUTAKEet al., 1978, 1990). When compared with other sites, such as Kakioka, Kanozan or Hatizyozima Island, the deviation is a decreasing trend at a rate of about 1.3 nT/year. This anomalous trend is likely to have changed to the normal tendency sometime around 1980. However, there was an exception to this general feature of the secular change. At a site about 500 m south of the center of the central cone, the total intensitybegan to decreasein 1981,which approximately corresponds to the time when the anomalous secular change recovered to the normal trend at other sites on Oshima Island. This decreasing tendency continued until the eruption of the central cone in November 1986, accelerated since about six months before the eruption. Observation added about 200m south of this site did not show such a remarkable decrease, indicating that this anomalous change preceding the eruption was a very local phenomenon. In this paper, we report the changes in the total intensity observed during a period from about 5 years before the eruption until the time of eruption. 2.
Observation
Observation of the total intensity by a proton magnetometer was initiated at the west coast, NOM in Fig. 1, in 1968, where the observation of the declination had continued. This place is suitable for detecting changes in the declination caused by
Changes
in the Geomagnetic
Total
Intensity
279
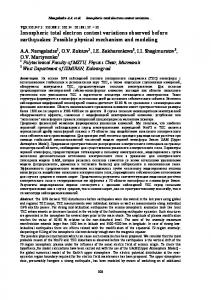
Fig. 1. (a) Location of observation sites. Solid circles represent continuous observation sites, and open circles repeat stations. (b) Observation sites near the central cone. Double circle denotes the crater A from which the eruption in November, 1986, took place.
280
T. YUKUTAKE et al.
decreases or increases in the magnetization of the volcano, but is not ideal for the change in the total intensity, because it is located close to the nodal line of the magnetic anomaly of the total intensity which is caused by magnetization of the volcano. On Oshima Island, distribution of the magnetic field has been investigated repeatedly, in the early periods on the surface (RIKITAKEet al., 1951; YOKOYAMA, 1954a, b, 1957a) and lately by aircraft (UTASHIROet al., 1972). Related to the eruption in 1986, airborne magnetic surveys with proton magnetometers were extensively conducted on the volcano (VEDA et al.,1990; NAKATSUKAet al.,1990). All these surveys indicate that a positive anomaly extends to the south of the central crater, and a negative to the north (see, for example, Figs. 1 and 2 in VEDA et al. (1990), Fig. 4 in NAKATSUKAet al. (1990)). If the volcano partially loses its magnetization by heating of the materials beneath the central crater, the total intensity is expected to decrease in the south of the crater, and to increase in the north. If demagnetization of the volcano is caused by an increase of pressure inside the volcano, a decrease of the total intensity is expected in the area surrounding the central crater with its maximum slightly south of the center (SAsAI, 1979). From these consideration, two proton magnetometers were installed, one in the south (FUT), and the other in the north (WST). At FUT, repeated measurements were conducted at irregular intervals between 1974 and 1976. Since 1976, measurements have been continued at one minute intervals. At WST, measurements at one minute intervals have been conducted since 1978. In 1977, a proton magnetometer was installed inside the caldera (MI*) at the foot of the central cone about 500 m south from its center. Another magnetometer was deployed about 200 m south (MI2*) of the site MI* in June of 1986. 3.
Variations Related to the Eruption from the Central Cone in 1986
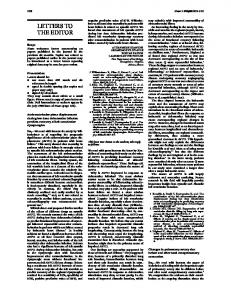
Among the 5 sites described in the previous section, the total intensity at MI* showed a remarkable change before the November 16, 1986 eruption from the A crater (double circle in Fig. 1(b)), which was newly formed at the southern rim of the central crater. Figure 2 shows the total intensity variations at 4 sites reproduced from YUKUTAKEet al. (1990). In the figure, differences in the monthly means between each site and the Kakioka Magnetic Observatory of the Japan Meteorological Agency, located about 150 km north-northeast of the Oshima Island, are shown. As reported in YUKUTAKEet al. (1990) the difference between NOM and KAK (Kakioka) was almost constant from 1968 to 1978 and started to increase around 1980, whereas the differences continued to increase in the area outside Oshima Island. This implies that, when the normal trend of the secular change in this region is removed, the total intensity was subjected to an anomalous decrease and recovered to the normal trend around 1980. The differences between WST and KAK and those between FUT and KAK also show similar changes, from a constant to an increasing trend, around 1980-81. This indicates that the anomalous decrease and recovery to the normal is not a phenomenon characteristic of site NOM but one commonly observed in a wider region. In contrast to these regional variations, the total intensity at MI* began to decrease rapidly around 1981. This is a phenomenon tightly related to the activity of the central cone.
Changes
in the Geomagnetic
Total
Intensity
281
Fig. 2. Totalintensitydifferences betweenrespective stationsinOshimaIslandand KakiokaMagnetic Observatory (KAK). Taking NOM as the reference station, we have plotted monthly means of nighttime values of the total intensity at MI* in Fig. 3. The decreasing trend that started in 1981 is clearly seen in this figure also. The average decreasing rate from the beginning of 1982 to the end of 1985 is -5.3 nT/ year (-0.44 nT/ month). The decreasing variation was accelerated in 1986 to a rate of about -2.2 nT/month for the last 6 months before the eruption, from May to November, 1986. Superposed on the gradual decrease from 1982 to 1985, seasonal variations are seen with minima around July and maxima around February. They are plotted in Fig. 4 after the general decreasing trend was subtracted. The peak-to-trough amplitude of the seasonal variation ranges from 5 to 10 nT. The anomalous decrease of the total intensity was found to be a very localized phenomenon. A new observation site was added about 200 m south of site MI* in June 1986. Monthly means of the difference between this new site MI2* and NOM are plotted in Fig. 5 together with those at MI*. In comparison with the variations at MI*, no notable variation is discernible at MI2*. Even if there were a decreasing trend, the magnitude of decrease would not be more than 3 nT for 5 months. This implies that the source which produced the anomalous decrease at MI* is shallow
282
T. YUKUTAKEet al.
Fig. 3.
Time variation
Fig.
Fig.
5.
Time
4.
variations
in total intensity difference
Seasonal
in total
variations
intensity
in total
at MI2*
between MI* and NOM.
intensity
at MI*.
in comparison
with
those
at MI*.
Changesin the Geomagnetic TotalIntensity
283
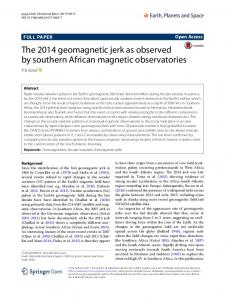
and close to MI*. A rapid variation was observed at the time of eruption at site MI*. Figure 6 shows the time variation in hourly means of the total intensity difference between MI* and NOM. The eruption occurred from the A crater of the central cone around 17 h 25 m on November 15, 1986. A rapid decrease of the total intensity was observed between 17 h 30 m and 18 h 30 m, superposed on a few nT fluctuations of several hours caused by external field disturbances. The difference of the hourly values between 17 h and 18 h amounts to 5.8 nT. When examined in detail, the change is likely to have taken place by two steps, 4.0 nT within a minute between 17 h 45 m and 17 h 46 m and 3.1 nT for about 20 minutes from 18 h 10 m to 18 h 30 m (SASAI et al., 1990). The total change from 17 h 30m to 18 h 30 m reaches 7.9 nT. About a 2 nT change can be traced in the record of MI2*.
Fig. 6. Variationintotal intensityat MI*at thetimeof eruptionfromthe centralconeon November 15,1986.Hourlymeanvaluesof differences betweenMI*and NOMareplotted.Thearrowindicates the timeof outbreakof the eruption. 4.
Magnetic Variations Associated with Fissure Eruptions on November 21
On November 21, a large amount of lava erupted from newly formed fissures, which ran in the north-northwest direction from the northeastern rim of the central cone (for location, see Fig. 1 in YUKUTAKE(1990)). Since many instruments had been destroyed by eruptions from the central crater that began on November 15, only a few magnetometers far from the crater were operating at the time of the fissure eruptions. One of these is the proton magnetometer at FUT, about 2 km southeast of the central cone. In association with the fissure eruptions, about a 7 nT decrease in the total intensity was observed. The lower diagram of Fig. 7 shows the time variation in the daily means of the total intensity difference between FUT and NOM. This phenomenon was not as rapid as that observed at the time of the
284
Fig.
T. YUKUTAKE et al.
7.
Variations
November
21,
in total 1986.
intensity
Daily
means
at
FUT
and
of differences
WST
before
between
and the
after
respective
the
fissure
stations
eruptions and
NOM
on are
plotted.
eruption from the central crater, but the total intensity decreased 5 nT during 2 hours after the eruptions and continued to decrease (SASAI et al., 1990). It took about one and a half days for the total intensity to complete its decrease by 7 nT. On the other hand, at a northern site WST, no data was available at the time of the eruption, but an increase of about 8 nT is seen in the upper diagram of Fig. 7 during the 12 days before and after the eruption. Although a question is raised about the quality of the data for November 5 to 13, there is no doubt an increasing change in total intensity when the data after the eruption are compared with those in August and September (SASAI et al., 1990). At both sites, the total intensity after the eruption recovered gradually. At these sites no such appreciable variations were observed preceding the eruptions as in the case of the variations at MI* before and after the eruption from
Changes in the GeomagneticTotal Intensity
285
the central crater. Long-term trends are seen in Fig. 2, which shows time variations in the total intensity difference between the observation sites and Kakioka Magnetic Observatory. At both sites FUT and WST, the total intensity began to increase around 1981, as already mentioned. In 1984 the increasing trend seems to have stopped at FUT, whereas the total intensity still continued to increase at WST. The deviation from the normal trend at FUT is about -8 nT for 2.5 years in this case. It is not known whether or not this change of the trend is related to the volcanic activity. 5.
Discussions
Although noticeable variations in the magnetic field were observed before and at the time of eruption, it is not easy to elucidate the processes by which these variations were caused at every stage of the volcanic activity. The first step is to identify the location and the size of the sources which caused the observed variations, and then to consider the physical processes capable of producing the magnetic variations. The variations preceding the eruption were observed at only one site (MI*) very close to the central cone. Even with the fissure eruption on November 21, 1986, which would be supposed to have an effect on a wider area, variations were recorded at only two sites. The distribution of observation sites before the eruption was unfortunately too sparse to identify the details of the source. Until a proton magnetometer was installed at MI2* about 200m south of MI*, the nearest point to MI* was FUT, about 2 km south-southeast, where no appreciable change was observed before the eruption. Based on the data from these sites, and making the simplest assumption as to the source, that it is a spherical source, we attempt to infer the source parameters. If a sphere is uniformly demagnetized, the field caused by the demagnetization becomes equivalent to that of a dipole situated at the center of the sphere with its axis anti-parallel to the direction of the original magnetization. If we assume that the original magnetization was in parallel with the present geomagnetic field, the parameters to be determined are the depth to the dipole oriented in the opposite direction to the geomagnetic field and its magnetic moment. For simplicity, we assume that the central cone and the observation sites, MI*, MI2* and FUT, are on a line in the north-south direction. The change in the total intensity(△F)caused
by
a change
in the
of which the direction is anti-parallel HAMANO et al.,1990):
where the
z0 is the
depth
observation
we
determine
we
can
1990).
to
site, and zo and
determine
the zo
and
the
center
x the
△J
of
the
horizontal
magnetic for
magnetization(△J)of
a sphere
to the geomagnetic
sphere, projection
r is the
distance
of r. From
moment[(4π/3)△Ja3]. a specific
sphere
If △F with
of radius
a
field is given as follows (see
a
radius
from data
the △F
is known a(HAMANO
center
at two at two
to
sites, sites, et al.,
286
T. YUKUTAKE et al.
For the last 5 years preceding the eruption, about a 27 nT decrease of total intensity was observed at MI*, while no significant change was recognized at FUT. If there had been a change of more than 5 nT at FUT during this period, it would have been detected. Therefore if we assume this to be an upper bound for the possible change at FUT, and compare it with the change at MI*, we obtain the depth to be shallower than 1.2 km, provided the source is located below the central crater. The depth 1.2km is too deep to be a strong constraint on the source information. In 1974, there was small eruption from the central crater. Before this eruption, the top of the magma in the vent was confirmed to have remained at a depth of about 300m from the crater surface (KIMURA and TOYODA, 1975). During the eruptive activity, magma rose up to the depth of about 200 m and solidified. From that time, the top surface of molten lava became unobservable, but magma is presumed to have receded to depths leaving solid lava at the shallower parts. Accordingly, it is not unreasonable to suppose that magma had risen up again before the eruption in 1986 to a depth of a few hundred meters from a deeper part. We therefore assume the depth of the center of the demagnetized source that caused the decrease of total intensity at MI* to be 400m, and take the radius of the demagnetized sphere to be 200 m. Since the diameter of the crater rim of the central cone is about 700 m (TSUYAet al.,1956), and the diameter of the vent was about 80 m at a depth of 300 m in 1972 (KIMURAand TOYODA,1975), this figure may not be unreasonable for the dimension of the demagnetized region, which is supposed to be the region heated by high-temperature liquids and gases originating from magma. Then the change in magnetization of 0.99x10.3 emu/cc for 5 years causes a 27 nT decrease at MI*. The expected change in total intensity at FUT is 0.4 nT for this depth. If we assume 100 m for the radius, the required change in magnetization is 0.8×10⁻²
emu/cc.
Basaltic
rocks
of
Oshima
Volcano
have
very
intense
magnetiza一
tion, ranging from 10-2 to 10-1 emu/cc. Even the effective magnetization of the volcano, which is the magnetization of a volcano causing an observed magnetic anomaly
when
a
uniform
magnetization
is
assumed,
is as
intense
as
7-12×10-5
emu/cc. Therefore, magnetization of 10-3emu/ cc will be easily lost by heating up to a few hundred degrees. We prefer the spherical model at 400m depth with a radius of 200m in which magnetization of 10-3emu/ cc was lost. Magnetic changes during the several months before the eruption were more pronounced. At MI*, a 12 nT decrease of total intensity was observed for 5 months. On the other hand, at MI2*, no appreciable change was recorded. Even though the total intensity had decreased at MI2*, the amount of the decrease is supposedly less than 3nT for the last 5 months. This implies that the source must be shallow and very close to MI*. If we assume the source to be located below the central crater, the distances to the observation sites become too long to create the observed difference in the total intensity decrease between MI* and MI2*. The change at MI2* should have been large enough to be observable. Therefore we assume that the source should be closer to MI* and located below the A crater, from which lava was ejected on November 15, 1986. In this case, the depth to the center of the demagnetized sphere is obtained to be shallower than 190m. We take 100 m depth. Then the total intensity decrease to be expected at MI2* is 2.4 nT for 5 months, which is below the detection level. If the radius of the sphere is taken to be 50 m, the decrease of
Changes
magnetization
should
be
in the Geomagnetic
5.2×10⁻³
emu/cc
Total
to
Intensity
cause
a
287
12
nT
decrease
of
total
intensity at MI* for 5 months. Since the diameter of the A crater is about 100m, the size of the demagnetized region assumed here does not seem unreasonable. The magnetic change can again be interpreted by the thermal process. The magnetic change observed at the time of eruption was large and fast, 4nT in a minute and 3 nT in half an hour. The total change amounted to 8nT in an hour at MI*. At MI2*, on the other hand, no appreciable change more than 2nT was detected. Since the observations were made on the caldera floor, the A crater was at higher altitude than the magnetometer level. The source of the magnetic change which was directly related to the explosion was likely located at a place higher than the observation sites. In order to give the observed relative magnitude of magnetic changes, the source is required to be 30 to 40m higher than the observation sites. If we assume a demagnetized sphere located in the A crater at 30 m higher than the observation
site with
a radius
of 50
m,
magnetization
of
1.5×10⁻²
emu/cc
should
be
lost. Since this change was so fast and the amount of magnetization lost is so large, the observed magnetic change cannot be interpreted by a simple thermal process; some other mechanism should be sought (HAMANOet al., 1990; SASAIet al.,1990). An explosive outflow of gas and liquid is supposed to have caused almost complete disordering of magnetic materials of large volume which composed the A crater cone. The rotation and displacement of magnetic materials provoked by rapid movement of highly pressurized gas and thermal water through cracks and fissures could cause such a drastic change. In contrast to this catastrophic case, the long-term change before the eruption is considered to be of thermal origin. Even in this case, however, the heating process does not seem simple. As far as we assume a thermal conduction mechanism, the efficiency of heating the surrounding rocks is not sufficient. If we take the thermal diffusivity of volcanic rocks to be 10-2cm2/sec (YOKOYAMA,1956), the region effectively heated by conduction cannot extend beyond 15 m distance from the magma-filled vent during 5 years. On the other hand, our preferred estimate of the source region is one of a spherical size of radius 200 m. A more efficient process of conveying heat must be considered, which might have such a large effective diffusivity as 2.5 cm2/ sec. The possibility is heat transfer by fluids through pores and cracks in the rocks. The volcano is supposed to have a large number of cracks and fissures inside, and this mechanism of transferring heat is considered to work very effectively. Eruption increases the number of cracks and fissures, and the volcano becomes more porous. Once eruption occurs, heat can be transferred very efficiently, and an extremely large volume can be demagnetized very quickly. This may be the reason why the magnetic change observed after the eruption was so large and fast (HAMANOet al.,1990). The magnetic changes related to the fissure eruptions on November 21, 1986, are surmised to have been caused by a stress effect. The magnetic field decreased about 5 nT within 2 hours at FUT, and continued to decrease gradually. The changes are too rapid to explain by the normal thermal process. A large-scale vertical dike is presumed to have intruded with a strike in the northwest to southeast direction. As discussed in detail in SAsAI et al. (1990), the stress field generated by this intrusion is likely to have caused the observed magnetic change.
288
6.
T. YUKUTAKE et al.
Concluding
Remarks
Remarkable changes of the geomagnetic field were observed in association with the activity of Oshima Volcano which erupted in November, 1986. At the southern foot of the central cone, diverse changes in the total intensity were recorded related to the evolution of the volcanic activity, namely a not very large but significant decrease over 5 years (-5.3nT/ year) before the eruption of the central cone, acceleration of the change about six months before the eruption (-2.2nT/ month), a very fast decrease at the time of eruption (-4nT/ minute), and extremely large variations after the eruption (-15nT/ month). These variations were very local, and directly related to the activity of the central cone, Mihara-yama. Associated with the fissure eruption that followed the eruptions from the central cone, observed variations were of such large scale that they could be observed at a site about 2 km southeast. This paper has mostly concentrated on reporting and discussing the magnetic variations observed before the eruption of the central cone. Although conspicuous changes in the magnetic field have been observed, the distribution of observation sites was not dense enough to identify the source parameters. Therefore our preferred scenario still has great room for improvement. Anomalous magnetic changes directly related to the volcanic activity began around 1981, when the anomalous secular change lasting more than 13 years all over Oshima Island ceased. This is interpreted as due to changes in the regional stress field. It is conceivable that the change of the regional stress field triggered the volcanic activity by activating the volatilization of magma. The decrease of total intensity continued for 5 years at a rate of -5.3nT/year at MI*, located at the south of the central crater. The change was supposedly caused by the intrusion of magma through the vent of the central cone heating the surroundings. Volatile materials from magma and high-temperature groundwater are likely to have penetrated outwards through cracks and pores to efficiently raise the temperature of the magnetic minerals. Magma possibly reached a depth of 200m, where the vent was blocked by old solidified lava. The demagnetized region is equivalent to a spherical body of 200 m radius with its center at a depth of 400m, losing its magnetization 10-3 emu/cc for 5 years. Since around May of 1986, the decrease of the magnetic field accelerated to -2 .2nT/ month. This change is difficult to interpret by assuming a source in the main vent of the central crater. It is supposed to correspond to the period when magma, blocked by the solid lava cap in the main vent, formed a bypass toward the A crater. The demagnetized region was supposedly located below the A crater, with its center at a depth of 100m and a radius of 50 m by a spherical model which lost its magnetization
5×10⁻³
emu/cc
for
5 months.
On November 15 the eruption started. The magnetic change at this time was very fast, 4nT decrease for one minute, and 8nT in total for an hour. This was presumably caused by the catastrophic disorientation of magnetic materials by the explosive ejection of gases and liquids through cracks and pores near the surface. The source region was estimated to be at a level about 30m higher than the magnetometers, with a radius of 50m by a spherical model losing its magnetization of 10-2emu/cc.
Changes in the Geomagnetic Total Intensity
289
REFERENCES DAvls, P.M., D.R. PIERCE,R.L. MCPHERRON,D. DZURISIN,T. MURRAY,and M.J.S. JOHNSTON, A volcanomagnetic observation on Mount St. Helens, Washington, Geophys. Res. Lett.,11, 225-228, 1984. FUJITA,N., Secular change of the geomagnetic total force in Japan for 1970.0, J. Geomag. Geoelectr., 25, 181-194, 1973. HAMANO,Y., H. UTADA,T. SHIMOMURA, Y. TANAKA,Y. SASAI,I. NAKAGAWA, Y. YOKOYAMA, M. OHNO, T. YOSHINO,S. KOYAMA,T. YUKUTAKE, and H. WATANABE, Geomagnetic variations observed after the 1986 eruption of Izu-Oshima Volcano, J. Geomag. Geoelectr., this issue, 319-335, 1990. JOHNSTON,M.J. S. and F.D. STACEY,Volcano-magnetic effect observed on Mt. Ruapehu, New Zealand, J. Geophys. Res., 75, 6541-6544,1969. KIMURA,M. and J. TOYODA,Recent level change of the bottom-floor in the summit crater of Miharayama, Oshima island, Japan, Bull. Volc. Soc. Japan, 20, 65-78, 1975 (in Japanese). MINAKAMI,T., A magnetic dip survey of Miyakesima Island, Bull. Earthq. Res. Inst., 19, 356-362,1941a. MINAKAMI,T., Time variations in the magnetic dip, and their topographical distribution in Miyakesima Island (Preliminary note), Bull. Earthq. Res. Inst., 19, 363-366, 1941b. NAGATA,T., Anomalous change in geomagnetism accompanying volcanic activity, Bull. Earthq. Res. Inst., 19, 337-355, 1941a. NAGATA,T., A geomagnetic study of the minor activities of Volcano Mihara, Oosima Island, August 1940, Bull. Earthq. Res. Inst., 19, 402-410, 1941b. NAKATSUKA,T., M. MAKING,S. OKUMA,and T. KANEKO,Aeromagnetic surveys over Izu-Oshima Volcano before and soon after the 1986 eruption, J. Geomag. Geoelectr., this issue, 337-353, 1990. RIKITAKE,T., Changes in magnetic dip that accompanied the activities of Volcano Mihara (The second report), Bull. Earthq. Res. Inst., 24, 499-502,1951 a. RIKITAKE,T., The distribution of magnetic dip in Ooshima (Oo-sima) Island and its change that accompanied the eruption of Volcano Mihara, 1950, Bull. Earthq. Res. Inst., 29, 161-181, 1951b. RIKITAKE,T. and I. YOKOYAMA, Volcanic activity and changes in geomagnetism, J. Geophys. Res., 60, 165-172, 1955. RIKITAKE,T., I. YOKOYAMA, A. OKADA,and Y. HISHIYAMA,Geomagnetic studies of Volcano Mihara. The 3rd paper (Magnetic survey and continuous observation of changes in geomagnetic declination), Bull. Earthq. Res. Inst., 29, 583-604, 1951. SASAI,Y., The piezomagnetic field associated with the Mogi model, Bull. Earthq. Res. Inst., 54, 1-29, 1979. SASAI, Y., T. SHIMOMURA,Y. HAMANO,H. UTADA, T. YOSHINO,S. KOYAMA,Y. ISHIKAWA,I. NAKAGAWA, Y. YOKOYAMA, M. OHNO,H. WATANABE, T. YUKUTAKE, Y. TANAKA,T. YAMAMOTO, K. NAKAYA,S. TSUNOMURA, F. MUROMATSU, and R. MURAKAMI,Volcanomagnetic effect observed during the 1986 eruption of Izu-Oshima Volcano, J. Geomag. Geoelectr., this issue, 291-317, 1990. SUMITOMO,N., Geomagnetic secular change anomaly associated with crustal activity, Proc. Earthq. Predict. Symp., pp. 145-155, 1976 (in Japanese). TAKAHASI,R. and K. HIRANO,Changes in the vertical intensity of geomagnetism that accompanied the eruption of Miyakezima, in 1940, Bull. Earthq. Res. Inst., 19, 82-103,1941a. TAKAHASI,R. and K. HIRANO,Changes in the vertical intensity of geomagnetism that accompanied the eruption, Bull. Earthq. Res. Inst., 19, 373-380, 1941b. TAKAHASI,R. and T. NAGATA,Geophysical studies of Volcano Mihara, Oosima Island; Topographic survey of Mihara and the magnetic survey of Oosima, Bull. Earthq. Res. Inst., 15, 441-462, 1937. TANAKA,Y., Observations of geomagnetic total intensity with a proton precession magnetometer on Sakurazima (1), Bull. Disaster Prev. Res. Inst., Kyoto Univ., 19B, 81-89, 1976. TANAKA,Y., H. MASUDA,M. KAWAMURA, K. OHCHI,Y. KATO,K. BABA,and T. YOSHINO,Surveys of geomagnetic total intensity with proton magnetometers on Aso Volcano (1977), Rep. Geophys. Geochem. Observations of Aso Volcano (Aug.-Dec., 1977), pp. 31-39, 1978 (in Japanese). TsUYA, H., A. OKADA,and T. WATANABE,Evolution of Mihara crater, Volcano Oshima, Izu, in the course of its activities since 1874, Bull. Earthq. Res. Inst., 34, 33-59, 1956. VEDA, Y., H. NAKAGAWA,and K. KUMAGAWA, Aeromagnetic anomaly and derived structure of Izu Osima Volcano after the eruption in November, 1986, J. Geomag. Geoelectr., this issue, 355-363, 1990. .
290
T. YUKUTAKE et al.
UTASHIRO,S., U. TAKIGAWA,S. OSHIMA,and T. KONDO,Aeromagnetic and marine magnetic survey around Japan, in Researches in Hydrography and Oceanography Commemoration Publication of the Centenary of the Hydrographic Department of Japan, pp. 75-111,1972. YOKOYAMA, 1., Geomagnetic studies of Volcano Mihara. The 4th paper (A series of geomagnetic dipsurveys and continuous observation of changes in geomagnetic declination), Bull. Earthq. Res. Inst., 32, 17-33, 1954a. YOKOYAMA, 1., Geomagnetic studies of Volcano Mihara. The 5th paper (Changes in three geomagnetic components during the period from May 1951to August 1953), Bull. Earthq. Res. Inst., 32,169-188, 1954b. YOKOYAMA, I., Geomagnetic studies of Volcano Mihara. The 7th paper (Possible thermal process related to changes in the geomagnetic field), Bull. Earthq. Res. Inst., 34, 21-32,1956. YOKOYAMA, I., Geomagnetic anomaly on volcanoes with relation to their subterranean structure, Bull. Earthq. Res. Inst., 35, 327-357,1957a. YOKOYAMA, I., Geomagnetic studies of Volcano Mihara. The 8th paper (Continuous observation of changes in geomagnetic declination during the period 1955-56), Bull. Earthq. Res. Inst., 35, 567-572, 1957b. YOKOYAMA, I., Review of geophysical researches on Volcano 0-sima, Kazan, Ser. 2, 3, 39-69, 1958 (in Japanese). YOKOYAMA, I., Anomalous changes in geomagnetic field on Oosima Volcano related with its activities in the decade of 1950, J. Phys. Earth, 17, 69-76,1969. YUKUTAKE, T., An overview of the eruptions of Oshima Volcano, Izu,1986-1987, from the geomagnetic and geoelectric standpoints, J. Geomag. Geoelectr., this issue, 141-150, 1990. YUKUTAKE, T. and T. YABU,Geomagnetic studies on Volcano Mihara, the 9th paper, Bull. Earthq. Res. Inst., 40, 511-522,1962. YUKUTAKE, T., T. YOSHINO,K. OTANI,E. KIMOTO,T. SHIMOMURA,and Y. ISHIKAWA,Anomalous secular variation in the geomagnetic total intensity on Oshima Volcano, Bull. Earthq. Res. Inst., 53, 881-892, 1978 (in Japanese). YUKUTAKE, T., H. UTADA,T. YOSHINO,E. KIMOTO,K. OTANI,and T. SHIMOMURA,Regional secular change in the geomagnetic field in the Oshima Island area during a tectonically active period, J. Geomag. Geoelectr., this issue, 257-275, 1990. ZLOTNICKI, J. and J. L. LEMOUEL,Volcanomagnetic effects observed on Piton de la Fournaise Volcano (Reunion Island): 1985-1987, J. Geophys. Res., 93, 9157-9171, 1988.