Measurement of the evoked compound action potential (ECAP) has considerable theoretical and practical advantages over the measurement of the force of ...
Br. J. Anaesth. (1987), 59, 200-205
CHANGES IN THE POWER SPECTRUM OF THE EVOKED COMPOUND ACTION POTENTIAL OF THE ADDUCTOR POLLICIS WITH THE ONSET OF NEUROMUSCULAR BLOCKADE N. J. N. HARPER, N. D. PUGH, T. E. J. HEALY AND H. V. PETTS Measurement of the evoked compound action potential (ECAP) has considerable theoretical and practical advantages over the measurement of the force of muscular contraction (Calvey, 1984) as a monitor of neuromuscular transmission. The ECAP may also yield information about the action of neuromuscular blocking drugs at receptor level. It has been observed that, during the onset of neuromuscular blockade by atracurium or vecuronium, the decrease in amplitude of the ECAP is associated with an increase in the duration of the negative deflection of the waveform (Pugh et al., 1985). The mechanism responsible for this change is, as yet, unexplained. Fourier analysis may be used to reveal the relative power of the harmonics of the fundamental frequency which, in combination, comprise the recorded signal. A shift in the component harmonics of the signal towards lower frequencies may be expected to increase the duration of the ECAP. It would be instructive to investigate the power spectrum of the ECAP by Fourier analysis during blockade by atracurium or vecuronium, and to establish the relation between the increase in duration of the compound action potential and any change in frequency components.
SUMMARY The effects of neuromuscular blockade by atracurium and vecuronium on the power spectrum of the evoked compound action potential (ECAP) of the adductor pollicis were investigated in 30 adult patients undergoing elective surgery. The changes in amplitude and mean power frequency (MPF) of the ECAP were measured. Ten patients received an EDth (0.23 mg kg*1) of atracurium and 10 received an EDtb (0.055 mg kg'1) of vecuronium. The remaining 10 patients did not receive any neuromuscular blocking drug, and were monitored for 6 min to exclude any time-related changes in the ECAP. Neuromuscular blockade produced a decrease in total power and a shift towards lower frequencies. This was reflected in a decrease in the MPF in those patients receiving atracurium or vecuronium. There was no significant difference (P < 0.05) between the atracurium and vecuronium groups in the magnitude of the change in MPF. These findings suggest that the previously reported increase in the duration of the negative deflection of the ECAP is predominantly the result of a change in its frequency components.
PATIENTS AND METHODS
N. J. N. HARPER, M J . , C H J . , F.F.A.R.CS., Department
of
Anaesthesia, Manchester Royal Infirmary, Oxford Road, Manchester. N. D . PUGH, B.SC, M.SC. (Regional Department of Medical Physics and Bio-Engineering); T. E. J. HEALY, M.SC., MJ)., FJ.A.R.C.S., H . V. PETTS, M.B., B.S., F.F.A.R.C.S.
(University Department of Anaesthesia); University Hospital of South Manchester, Withington, Manchester. Accepted for Publication: August 7, 1986. Correspondence to T. E. J. H. (Univ. Dept. Anaesth.).
Thirty adult patients (ASA I or II) aged 18-65 yr undergoing elective surgical procedures were investigated after they had given informed consent to the study, which had been approved by the Hospital Ethical Committee. All the patients had normal renal and hepatic function and were not taking any medication known to affect neuromuscular transmission. Patients were randomly allocated to three equal groups.
ATRACURIUM OR VECURONIUM AND THE POWER SPECTRUM Premedication with papaveretum 10-15 mg and hyoscine 0.2-0.3 mg was given i.m. approximately 90 min before the induction of anaesthesia. Anaesthesia was induced with thiopentone 4-6 mg kg"1 and maintained with fentanyl l.Sugkg" 1 and 70% nitrous oxide in oxygen. Ventilation was assisted, when necessary, to maintain normocapnia. The majority of patients received additional supplements of thiopentone up to 2 mg kg"1 to maintain anaesthesia during the period of measurement. Following the induction of anaesthesia, neuromuscular transmission was investigated as follows. The ulnar nerve at the right wrist was stimulated with single supramaximal square wave pulses of 0.2 ms duration at 20-s intervals. ECG-type electrodes were used for stimulating and recording (Medicotest Q.00.S). The ECAP of the adductor pollicis was recorded using standard electrode geometry (Pugh et al., 1985). The skin was carefully prepared with acetone using mild abrasion. The active electrode was positioned over the motor point of the adductor pollicis and the inactive electrode over the head of the second metacarpal. An indifferent electrode was placed on the dorsal aspect of the hand. The signal was detected and recorded using a diagnostic electromyograph (Medelec MS.91) and an Apple He computer. The amplitude of the ECAP was measured from the negative peak to the iso-electric line and the extent of blockade was expressed as the percentage depression of the amplitude compared with the mean of three control (preblockade) readings. This apparatus enabled the signal to be band-pass filtered between 2 Hz and 10 kHz, amplified and displayed on an oscilloscope. The output of the amplifier was passed through an analogue-to-digital converter (ADC) and stored in a digital buffer for subsequent computer analysis. A permanent record (on heat sensitive paper) was also obtained via the ADC (Medelec MS.91). The system was able to reproduce faithfully a sine wave of higher frequency than those encountered within the ECAP signal. After an initial period to allow electrode settling, the ECAP amplitude became stable and was observed for 1 min, after which three consecutive compound action potentials were recorded (pre-blockade controls). Patients in groups 1 and 2 then received atracurium 0.23 mg kg"1 or vecuronium 0.055 mg kg"1 i.v. These doses were expected to produce 95%
201
depression of the amplitude of the ECAP (Black et al., 1985). The third group of patients did not receive any neuromuscular blocking drug. The ECAP was recorded until the amplitude was depressed maximally, or for 6 min in the control group. An Apple He microcomputer was used to calculate the power spectrum of each ECAP by Fourier analysis. In order to obtain discrimination of approximately 2 Hz, a trace duration of 500 ms was chosen. The number of data points was constrained to an exact power of 2 and 1024 (210) data points were used in the transformation. Since the MS.91 produces 1000 bytes of information for each trace, the last 24 data points were assigned a value of zero. The signal was digitized at a rate of 2 kHz and the stimulus artefact and baseline drift removed digitally. The frequency spectrum of the ECAP was calculated using a fast Fourier transform technique (Bergland, 1972). This produced estimates of the power at 1.95-Hz intervals within a 0-500 Hz band width. The upper limit of 500 Hz was sufficient to contain the entire frequency content of the ECAP measured from the adductor pollicis (Mills, 1982). The mean power frequency (MPF) of the spectrum (that is, the frequency at which one-half the total power is at frequencies greater than the MPF, and one-half at frequencies less than the MPF) was then calculated (Mills, 1982). RESULTS
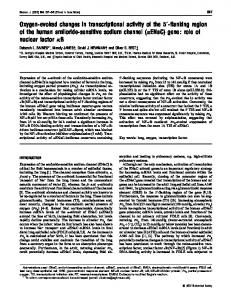
There were no significant differences (analysis of variance) between the three groups of patients with respect to mean age or weight. A typical ECAP is shown in figure 1. In the control group there appeared to be a small decrease in ECAP amplitude and MPF (table I). However, during the period of measurement (6 min) this was not significant (analysis of variance). Neuromuscular blockade produced a decrease in total power
FIG. 1. A typical ECAP of the adductor pollicis illustrating the latency and negative deflection time (NDT).
BRITISH JOURNAL OF ANAESTHESIA
202 TABLE I. Changes in ECAP amplitude and MPF with time in the control group
Time (min)
Mean% depression of ECAP amplitude
Mean% depression of
(±SEM)
MPF(±SEM)
-0.1 (0.69) 1.1 (0.55) 1.6(0.70) 2.4 (0.68) 1.0(0.74) 1.4(0.74)
-0.4(0.40) 1.3(0.47) 2.3 (0.63) 2.3(1.63) 2.8(1.30) 3.0(1.19)
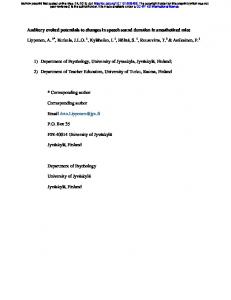
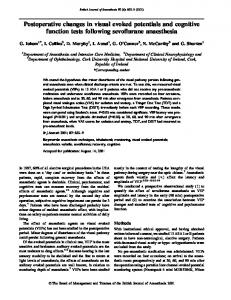
accompanied by a shift towards lower frequencies (fig. 2). The scattergram of all the measurements of percentage change of ECAP amplitude and MPF following the administration of atracunum is shown in figure 3. An initial small increase in MPF was followed by a marked decrease in the presence of profound blockade. Similar changes in MPF were observed in association with blockade by vecuronium (fig. 4). In order to examine any differences between the effects of atracurium and vecuronium, all the measurements included in each group were divided into ranks, each spanning an arbitrary 10% of ECAP
100|80-
£6040200100
200
300
400
500
Frequency (Hz)
FIG. 2. Decrease in total power and shift towards lower frequencies produced by neuromuscular blockade.
75-i Atracurium
50-
£
u a>
•o
B
•25 *
71 . .50
75
100
-25- 1 Percentage depression in ECAP
FIG. 3. Percentage change of ECAP amplitude and MPF following the administration of atracurium.
ATRACURIUM OR VECURONIUM AND THE POWER SPECTRUM
203
\fecuronium
75-
St 50-
I 25H
'25
'
.
50
75
100
Percentage depression in ECAP
-25J
FIG. 4. Percentage change of ECAP amplitude and MPF following the administration of vecuronium.
TABLE II. Changes in ECAP amplitude and MPF after thein the 70-80%, 80-90% and 90-100% intervals administration of vecuronium and atracurium. **P < 0.05;(P < 0.01). In those patients who received vecur**P < 0.01 onium, significant differences were observed when Percentage depression in FPAP amplitude 0-10 10-20 20-30 30-40 40-50 50-60 60-70 70-80 80-90 90-100
Mean % depression in Mean Poweir Frequency
(±SEM) Vecuronium
Atracurium
-1.78(0.29) -6.56(2.01)* -4.85(2.01) -3.50(4.63) -4.28(1.58) 0.12(3.26) -2.37(2.66) 2.58(3.30) 9.03(2.43)** 25.36(4.42)**
-2.68(0.44) -4.60(1.37) -3.83(3.52) -1.55(1.94) -0.20(1.36) -1.91(2.72) 1.75(2.95) 3.17(2.69)** 8.71(1.79)** 16.72(4.00)**
amplitude depression (table II). The differences in mean MPF change were analysed using Student's unpaired t test. Patients who received atracurium exhibited significant differences between the percentage MPF change in the 0—10% blockade intervals compared with those
the MPF of the 0-10% blockade interval was compared with those of the 10-20% (P < 0.05), 80-90% and 90-100% (P < 0.01) intervals. When the atracurium and vecuronium groups were compared, there were no significant differences between the mean changes in MPF at each level of amplitude depression (Student's t test, P > 0.05). DISCUSSION
In the present study we have demonstrated that neuromuscular blockade by atracurium and vecuronium is associated with a shift in the frequency spectrum of the ECAP of the adductor pollicis towards lower frequencies. In a previous investigation of the changes in the waveform of the ECAP during the onset of blockade, Pugh and colleagues (1985) demonstrated an increase in the duration of the negative deflection (negative deflection time: NDT). This was defined as the
204
time from the stimulus artefact to the point at which the signal crossed the iso-electric line. The latency component of this measurement (fig. 1) was significantly reduced by atracurium and was unchanged by vecuronium. It is, therefore, unlikely that the increase in NDT was simply the result of a uniform increase in the delay between nerve stimulation and the generation of each motor unit potential. This suggests that, as neuromuscular blockade proceeds, there is a change in the pattern in which motor units are activated. A possible explanation would be a non-uniform increase in the latency of motor units. This could be described as desynchronization. A second possible mechanism is a relative increase in the duration of those motor unit action potentials which remain unblocked by the neuromuscular blocker. This may be consequent upon preferential blockade of those motor units with action potentials of short duration. Power spectrum analysis apportions the total power contained within a signal to denned frequency bands; in this study 2-Hz bands within a total band width of 500 Hz. Because of the reciprocal relation between frequency and wavelength, component waveforms with a short wavelength will be represented at the upper end of the frequency spectrum. Power spectrum analysis removes the effect of phase from the constituent harmonic frequencies. Changes in latency of individual muscle fibre action potentials are, therefore, unlikely to affect the power spectrum. Krakau (1956) has demonstrated that the Fourier spectrum of a single pulse is the same as that of a number of identical pulses firing in a manner which may be coherent, random or overlapping. If the assumption is made that motor unit action potentials are similar, their frequency components and those of muscle fibre action potentials may be reflected in the power spectrum of the ECAP. A shift towards lower frequencies demonstrated in the power spectrum of the EMG activity of voluntarily contracting muscle during fatigue studies in man has been ascribed to preferential fatigue of different species of motor unit. This phenomenon has been observed using either needle electrodes or electrodes placed on the surface of the skin (Kogi and Hakamada, 1962; Kaiser and Petersen, 1963; Kadefors, Kaiser and Petersen, 1968). Type 2b (fast twitch, fast fatigue) motor units fatigue less readily than slow, type 1 and type 2a (fast twitch, slow fatigue) motor units and a reduction in the contribution of
BRITISH JOURNAL OF ANAESTHESIA type 2b units to the total frequency spectrum is reflected in a shift towards lower frequencies in addition to a decrease in total power. We suggest that a similar interpretation may be applied to the shift towards the lower frequencies contained in the ECAP during neuromuscular blockade by atracurium and vecuronium. There is good evidence that the different types of muscle fibre are not equally affected by neuromuscular blocking drugs. Day and colleagues (1983) have demonstrated, in the cat, preferential blockade of fast (gastrocnemius) fibres compared with slow (soleus) fibres by tubocurarine. In contrast, in a volunteer study, Secher, Rube and Secher (1982) found that the EMG activity in maximally contracting muscle was reduced by a small dose of tubocurarine to a greater extent in soleus (71% slow fibres) compared with gastrocnemius (54 % slow fibres). Although there were considerable methodological differences between the studies, the apparently opposing findings suggest that there are interspecies differences in the relative susceptibility of fast and slow fibres. Further investigation is necessary to establish the importance of muscle fibre type in the development of neuromuscular blockade in man.
REFERENCES Bergland, G. D. (1972). A guided tour of the fast fourier transform; in Digital Signal Processing (eds L. R. Rabiner and C. M. Rader), p. 228. IEEE. Black, T. E., Healy, T. E. J., Pugh, N. D., Kay, B., Harper, N. J. N., Petts, H. V., and Sivalingam, T. (1985). Atracurium and vecuronium compared and combined. Eur. J. Anaesth., 2, 29. Calvey, T. N. (1984). Assessment of neuromuscular blockade by electromyography: a review. J. R. Soc. Med., 77, 56. Day, N. S., Blake, G. J., Standaert, F. G., and Dretchen, K. L. (1983). Characterization of the train-of-four response in fast and slow muscles: Effect of d-tubocurarine, pancuronium, and vecuronium. Anesthesiology, 58, 414. Kadefors, R., Kaiser, E., and Petersen, I. (1968). Dynamic spectrum analysis of myo-potentials with special reference to muscle fatigue. Electromyography, 8, 39. Kaiser, E., and Petersen, I. (1963). Frequency analysis of muscle action potentials during tetanic contraction. Electromyography, 3, 5. Kogi, K., and Hakamada, T. (1962). Slowing of surface electromyogram and muscle strength in muscle fatigue. Rep. Inst. Sci. Lab. KurashUa, 60, 27. Krakau, C. E. T. (1956). Frequency analysis of neuronal time series. Kungl. jysiograf. saUsk. Lund Fordhandlingar, University of Lund, 26, 151. Mills, K. R. (1982). Power spectral analysis of electromyogram and compound muscle action potential during muscle fatigue and recovery. J. Physiol. (Land.), 326, 401.
ATRACURIUM OR VECURONIUM AND THE POWER SPECTRUM Pugh, N. D., Harper, N. J. N., Healy, T. E. J., and Pens, H. V. (1985). The effects of atracurium and vecuronium on the depolarization phase of the evoked compound action potential of the adductor pollicis. Br. J. Anaesth., 57, 830P.
205
Secher, N. H., Rube, N., and Scchcr, O. (1982). Effect of tubocurarine on human soleus *nd gastrocnemius muscles, Ada Anaathesiol. Scand., 26, 231.