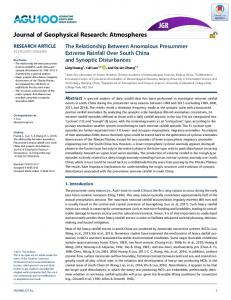
JOURNAL OF GEOPHYSICAL RESEARCH, VOL. 115, D21107, doi:10.1029/2010JD014422, 2010
Changes in the relationship between Northeast China summer temperature and ENSO Renguang Wu,1 Song Yang,2 Shi Liu,3 Li Sun,3 Yi Lian,3 and Zongting Gao3 Received 27 April 2010; revised 13 July 2010; accepted 28 July 2010; published 4 November 2010.
[1] Northeast China (NEC) summer temperature tends to be lower (higher) than normal in El Niño (La Niña) developing years during 1950s through mid‐1970s. The relationship between the NEC summer temperature and El Niño‐Southern Oscillation (ENSO) is weakened or even becomes opposite in 1980s and 1990s. The present study documents this interdecadal change and investigates plausible reasons for this change. Before the late 1970s, ENSO affects the NEC summer temperature through modulating the South Asian heating and consequently the midlatitude Asian circulation. After the late 1970s, the connection between ENSO and the Indian summer monsoon and that between the South Asian heating and the midlatitude Asian circulation have been weakened. This leads to a weakening of ENSO impacts on the NEC summer temperature. It is found that the NEC summer temperature variations are closely related to the North Atlantic sea surface temperature (SST) and circulation changes in 1980s and 1990s. In particular, a tripole North Atlantic SST anomaly pattern in boreal spring is a good precursory for the NEC summer temperature anomalies. The NEC summer temperature displays a negative correlation with the summer SST surrounding the Maritime Continent in 1980s and 1990s. In many years, the tropical North Pacific and the North Atlantic SST anomalies can contribute in concert to the midlatitude Asian circulation changes and the NEC summer temperature anomalies. These effects overcome those of the central and eastern equatorial Pacific SST anomalies, leading to a same‐sign relationship between the NEC summer temperature and the central and eastern equatorial Pacific SST anomalies. Citation: Wu, R., S. Yang, S. Liu, L. Sun, Y. Lian, and Z. Gao (2010), Changes in the relationship between Northeast China summer temperature and ENSO, J. Geophys. Res., 115, D21107, doi:10.1029/2010JD014422.
1. Introduction [2] The Northeast China (NEC) crop yield is highly dependent on the summer temperature [Ding, 1980; Sun et al., 1983]. Summer low temperature in NEC has serious impacts on the regional agriculture, ecosystem, economy, and lives of the inhabitants. The cold damage caused by low summer temperature is a major hazard in NEC [Yao, 1995]. Thus understanding the causes and improving the forecasts of the NEC summer temperature will have great benefits for the society and economy. [3] El Niño‐Southern Oscillation (ENSO) is one important factor for the summer climate anomalies in China [e.g., Fu and Teng, 1988; Zhang et al., 1999; Wang et al., 2000; Wu et al., 2003; Yang and Lau, 2006; Wang et al., 2008]. ENSO affects the atmospheric circulation and climate over midlatitude China through its influence on the western 1 Center for Ocean‐Land‐Atmosphere Studies, Institute of Global Environment and Society, Calverton, Maryland, USA. 2 NOAA Climate Prediction Center, Camp Springs, Maryland, USA. 3 Institute of Meteorological Sciences of Jilin Province, Changchun, Jilin, China.
Copyright 2010 by the American Geophysical Union. 0148‐0227/10/2010JD014422
North Pacific heating and the South Asian heating [Wang et al., 2000; Wu and Wang, 2002; Wu et al., 2003]. Anomalous heating over the western North Pacific induces a meridional wave pattern with alternatively positive and negative height anomalies emanating from the tropical western North Pacific to the midlatitude East Asia [Nitta, 1987; Huang and Wu, 1989; Wang et al., 2001; Wu and Wang, 2002; Wu et al., 2003]. Anomalous heating over South Asia contributes to a zonal wave pattern over the midlatitude Asia with alternatively positive and negative height anomalies [Kripalani et al., 1997; Krishnan and Sugi, 2001; Wu, 2002; Wu and Wang, 2002; Wu et al., 2003]. Impacts of ENSO on the NEC summer temperature have been identified in previous studies [Wang and Wu, 1997; Lian and An, 1998; Liu and Wang, 2001; Zhu et al., 2004; Sun and Wang, 2006; Zhu et al., 2007; Guan and Li, 2008]. Cold summers tend to occur in the El Niño developing years and summer temperature in NEC tends to be warmer than normal in La Niña developing years [Guan and Li, 2008]. [4] The relationship between ENSO and the NEC summer temperature has changed since the late 1970s. Cold summers occurred frequently in NEC during the El Niño developing years before the late 1970s, whereas the NEC temperature displayed a tendency for higher than normal in
D21107
1 of 15
D21107
WU ET AL.: ENSO‐CHINA SUMMER TEMPERATURE RELATION
El Niño developing summers after the late 1970s [Zhu et al., 2007]. Our analysis confirms that the relationship between the NEC summer temperature and central and eastern equatorial Pacific sea surface temperature (SST) after the late 1970s is weak or even opposite to that before the late 1970s. Then, why has the relationship between the NEC summer temperature and ENSO changed since the late 1970s? What are the factors for the NEC cold summers after the late 1970s given the weak ENSO impact? What are the circulation features associated with the NEC cold summers before and after the late 1970s, respectively? Is there any precursory signal for the cold summers in NEC? [5] The present study indicates that the weakening of ENSO influence on the NEC summer temperature after the late 1970s is related to the weakening of the relationship between the Indian summer monsoon and ENSO. In the 1980s and 1990s, the NEC summer temperature anomalies have a close relationship with a tripole North Atlantic SST anomaly pattern and the SST anomalies surrounding the Maritime Continent. Present study shows that the NEC summer temperature and the central and eastern equatorial Pacific SST anomalies can have either the same or opposite signs, depending on the effects of regional SST anomalies outside the central and eastern equatorial Pacific. [6] In the following, we introduce the data sets and methods used in the present study in section 2. In section 3, we document the interdecadal change in the relationship between the NEC summer temperature and ENSO and investigate the plausible reasons for the change. In section 4, we contrast SST and circulation anomalies associated with NEC summer temperature anomalies before and after the late 1970s to understand the differences in the factors leading to cold summers in NEC. In section 5, we compare two opposite types of relationship between the NEC summer temperature and ENSO. A summary and discussions are given in section 6.
2. Data Sets and Methods [7] The present study uses the monthly mean surface air temperature of 160 stations in China from 1951 to 2008, which is provided by the National Climate Center of the China Meteorological Administration. The gridded monthly mean terrestrial air temperature from the University of Delaware [Matsuura and Willmott, 2009] for the period 1900–2008 is also used. The resolution of this temperature data set is 0.5° × 0.5°. [8] The SST used in the present study is the NOAA Extended Reconstruction SST, version 3 [Smith et al., 2008], which is provided by NOAA/OAR/ESRL Physical Science Division (PSD), Boulder, Colorado, USA, from its Web site at http://www.cdc.noaa.gov/. This SST data set has a resolution of 2.0° × 2.0° and is available from 1854 to present. The all‐India summer rainfall (AISR) data [Parthasarathy et al., 1994] for the period of 1847–2006 is obtained from the Web page of the Indian Institute of Tropical Meteorology (http://www.tropmet.ernet.in/). [9] The present study uses the geopotential heights at 200 hPa, 500 hPa, and 850 hPa; winds at 200 hPa and 850 hPa; and surface air temperature at 2 m from the National Centers for Environmental Prediction‐National Center for Atmospheric Research (NCEP‐NCAR) [Kalnay et al., 1996]. The
D21107
heights and winds are available on 2.5° × 2.5° grids and the surface air temperatures are on T62 grids from 1948 to present. [10] Throughout this study, the analysis is performed for interannual variations on timescales shorter than 8 years. Variations longer than 8 years have been removed using a harmonic analysis. This is to exclude the plausible contamination of interannual relationship by interdecadal changes and to avoid the impact of plausible unrealistic interdecadal variability in the NCEP‐NCAR reanalysis [Yang et al., 2002; Inoue and Matsumoto, 2004; Wu et al., 2005; Greatbatch and Rong, 2006]. [11] In the present study, area‐mean June–August (JJA) NEC temperature is obtained by averaging temperature at stations to the east of 120°E and to the north of 42.5°N (Figure 1b). The NINO3.4 (5°S–5°N, 170°–120°W) SST in December–February (DJF) is used as an index for ENSO. In the correlation analysis, we calculate the correlation of preceding JJA temperature and circulation with respect to DJF NINO3.4 SST. For convenience, we denote these seasons as JJA(0) and DJF(1), respectively, and use a similar notation for other seasons. Here, DJF(1) NINO3.4 SST is used as a reference time series in obtaining the SST and circulation anomalies associated with ENSO. Although JJA (0) NINO3.4 SST can be used as an alternative reference in calculating the regression and correlation, it cannot distinguish the ENSO developing and decaying years.
3. Interdecadal Change in the Relationship Between the NEC Summer Temperature and ENSO [12] Figures 1a–1b show the correlation of China station temperature in JJA(0) with DJF(1) NINO3.4 SST for the period 1955–1975 and 1978–1998, respectively. The selection of the above two periods will be justified later (Figure 2). Very different features appear between the two periods. During 1955–1975, significant negative correlation is seen in NEC and the eastern part of central China. During 1978–1998, the correlation is positive in NEC and North China and negative in southern China. The pronounced contrast in NEC between the two periods is consistent with the results of previous studies [e.g., Zhu et al., 2007], which will be the focus of the present study. [13] The negative correlation in NEC based on station observations is part of a broad region as seen in the correlation of gridded air temperature from the University of Delaware (Figures 1c–1d). The negative correlation extends from the Korean Peninsula through NEC to central Russia during 1955–1975 (Figure 1c). During 1978–1998, the correlation is generally weak in Russia (Figure 1d). Figures 1c–1d also confirm the negative correlation in eastern part of central China during 1955–1975 and positive and negative correlation in North China and southern China, respectively, during 1978–1998. [14] We have also examined the correlation for temperature in September–November (SON(0)) (figures not shown). During 1955–1975, negative correlation is seen in NEC with slightly weaker magnitude compared to JJA(0). During 1978–1998, the correlation in NEC is weak. Thus there is an obvious weakening of the correlation around the late 1970s. In the present study, we focus on the JJA(0) correlation that
2 of 15
D21107
WU ET AL.: ENSO‐CHINA SUMMER TEMPERATURE RELATION
D21107
Figure 1. Correlation of JJA(0) China station temperature with DJF(1) NINO3.4 SST in (a) 1955–1975 and (b) 1978–1998. (c and d) Same as Figures 1a and 1b, respectively, except for gridded air temperature from the University of Delaware. The contour values are ±0.1, ±0.3, ±0.5, and ±0.7. Shading denotes regions where the absolute values of correlation are larger than 0.433, which is significant at the 95% confidence level. The black dots in Figure 1a show locations of stations and those in Figure 1b indicate the 15 stations east of 120°E and north of 42.5°N used in obtaining area‐mean temperature for NEC. displays relatively more pronounced changes than the SON (0) correlation. [15] Figure 2a shows the time series of normalized JJA(0) NEC temperature and DJF(1) NINO3.4 SST anomalies. A 0.5 standard deviation is used as the criterion to determine an anomalous year. Use of a different criterion leads to a change in the number of anomalous years but does not affect the statistical relationship described below. From Figure 2a, the NEC temperature and NINO3.4 SST anomalies are of opposite signs during most years before 1977, whereas they display both same‐sign and opposite‐sign values in 1980s and 1990s. Table 1 presents the statistics of their relationship. During 1951–1977, there are two same‐sign and nine opposite‐sign years. During 1978–2007, there are seven same‐sign and five opposite‐sign years. These statistical results are consistent with the correlation difference between the two periods seen in Figure 1. [16] The above change is further demonstrated in Figure 2b, which shows the sliding correlation between JJA(0) NEC temperature and DJF(1) NINO3.4 SST with a window of 21 years. Apparently, the correlation is significant and negative during 1960–1971 and weak or positive after 1972. The weakening of correlation from 1971 to 1972 is due to the replacement of the opposite‐sign and large NEC temperature and NINO3.4 SST anomalies in 1961 by the same‐ sign and large anomalies in 1982 in the 21‐year sliding correlation. The switch of correlation from negative to positive around 1983 is due to the same‐sign anomalies
during 1993–1994 replacing the opposite‐sign anomalies during 1972–1973. The tendency for opposite‐sign anomalies since 2000 weakens the positive sliding correlation after 1992. Years 1965 and 1988 approximately represent the central years of the 21‐year window when the negative and positive correlations are the largest. As such, the contrasts between these two 21‐year periods are most prominent. Therefore we select 1955–1975 and 1978–1998 in the contrasting analysis throughout this study. [17] To understand why the relationship between the NEC summer temperature and ENSO has changed, we contrast the distribution of SST and circulation anomalies in the developing years of ENSO between 1955 and 1975 and 1978–1998. Figure 3 displays the anomalies of JJA(0) SST as obtained by regression on DJF(1) NINO3.4 SST. Figures 4–5 show the anomalies of JJA(0) geopotential heights at 200 hPa and 850 hPa, respectively, by the same regression. [18] The JJA(0) SST anomalies are positive in the central and eastern tropical Pacific and negative in the western tropical Pacific. This feature is seen in both 1955–1975 and 1978–1998 (Figures 3a–3b). There are several important differences between the two periods. First, positive SST anomalies in the tropical central North Pacific along 10°– 20°N shift westward in 1978–1998 compared to those in 1955–1975. Second, negative SST anomalies surrounding the Maritime Continent are larger in 1978–1998 than in 1955–1975. Third, in the tropical Atlantic, large negative
3 of 15
D21107
D21107
WU ET AL.: ENSO‐CHINA SUMMER TEMPERATURE RELATION
Figure 2. (a) Time series of normalized DJF(1) NINO3.4 SST (°C, solid line) and JJA(0) NEC temperature (°C, dashed line); (b) sliding correlation between DJF(1) NINO3.4 SST and JJA(0) NEC temperature displayed at the central year of the 21‐year window. The horizontal lines denote the 0.5 standard deviation in Figure 2a and the correlation coefficient at the 95% confidence level in Figure 2b. SST anomalies are present in 1978–1998, whereas SST anomalies are weak there in 1955–1975. The implications of these differences will be discussed shortly. [19] The JJA(0) height anomalies at 200 hPa display notable differences in both the tropics and the midlatitudes. In 1955–1975, significant and large anomalies cover the global tropics (Figure 4a). In 1978–1998, tropical height anomalies are weaker and significant anomalies are limited to the tropical Pacific (Figure 4b). We speculated that this difference is related to the difference in SST anomalies. Previous studies showed that El Niño‐related warm SST anomalies in the central and eastern tropical Pacific induce tropical‐wide warming in the troposphere [Pan and Oort, 1983; Newell and Wu, 1992; Yuleva and Wallace, 1994; Sobel et al., 2002; Chiang and Sobel, 2002] with the maximum warming at about 4 months after the mature phase of El Niño [Chiang and Sobel, 2002]. This warming explains the positive height anomalies at upper troposphere in 1955–1975 (Figure 4a) during which SST anomalies are large and positive in the central and eastern tropical Pacific but relatively small elsewhere (Figure 3a). In 1978–1998, large and negative SST anomalies exist around the Maritime Continent and in the tropical Atlantic Ocean (Figure 3b).
Following the same mechanism as the influence of tropical Pacific warming/cooling, these negative SST anomalies induce tropospheric cooling and negative height anomalies at upper troposphere, which offsets the effects of warm SST anomalies in the central and eastern tropical Pacific. This explains the small height anomalies over the tropics except for the tropical Pacific in 1978–1998 (Figure 4b). This is consistent with Hu and Huang [2010] whose numerical experiments with the Community Atmosphere Model Version 3 (CAM3) showed that the upper tropospheric warming in response to ENSO SST anomalies in 1979–2000 is limited to the tropical Pacific in the summer of developing El Niño years. [20] Over the midlatitudes of Asia, there is an anomaly pattern with negative height anomalies over East Asia and West Asia and positive height anomalies in between, which is seen in both 1955–1975 and 1978–1998 (Figure 4). This pattern, which is considered to be part of the circumglobal teleconnection pattern [Ding and Wang, 2005], may be contributed by the anomalous cooling over South Asia [Wu, 2002; Wu et al., 2003]. As shown by previous observational analysis and numerical experiments with imposed atmospheric heating over South Asia, a strong Indian summer
Table 1. Years When the JJA(0) NEC Temperature and DJF(1) NINO3.4 SST Anomalies Have the Same and Opposite Signs
Same sign years Opposite sign years
1951–1977
1978–2007
1964, 1968 1951, 1955, 1957, 1967, 1970, 1972, 1973, 1975, 1976
1982, 1983, 1993, 1994, 1997, 1998, 1999 1980, 1988, 2002, 2006, 2007
4 of 15
D21107
WU ET AL.: ENSO‐CHINA SUMMER TEMPERATURE RELATION
D21107
Figure 3. Anomalies of JJA(0) SST (°C) in (a) 1955–1975 and (b) 1978–1998 obtained by regression on DJF(1) NINO3.4 SST. The contour values are ±0.1°C, ±0.2°C, ±0.4°C, ±0.6°C, and ±0.8°C. Shading denotes regions where the absolute values of the corresponding correlation are larger than 0.433, which is significant at the 95% confidence level. monsoon or anomalous South Asian heating induce a low‐ level cyclone over the Arabian Sea and an upper‐level anticyclone to the west of the Tibetan Plateau [Rodwell and
Hoskins, 1996; Wu, 2002]. Further, an anomalous wave pattern extends downstream along the midlatitudes to East Asia [Wu et al., 2003]. In comparison, the anomalous cir-
Figure 4. Anomalies of JJA(0) 200 hPa geopotential height in (a) 1955–1975 and (b) 1978–1998 obtained by regression on DJF(1) NINO3.4 SST. The contour values are ±2 m, ±4 m, ±8 m, ±12 m, ±16 m, and ±20 m. Shading denotes regions where the absolute values of the corresponding correlation are larger than 0.433, which is significant at the 95% confidence level. 5 of 15
D21107
WU ET AL.: ENSO‐CHINA SUMMER TEMPERATURE RELATION
D21107
Figure 5. Anomalies of JJA(0) 850 hPa geopotential height in (a) 1955–1975 and (b) 1978–1998 obtained by regression on DJF(1) NINO3.4 SST. The contour values are ±1 m, ±2 m, ±4 m, ±6 m, ±8 m, and ±10 m. Shading denotes regions where the absolute values of the corresponding correlation are larger than 0.433, which is significant at the 95% confidence level. culation pattern over the midlatitude Asia is more pronounced in 1955–1975 than in 1978–1998. In particular, the negative height anomalies over East Asia are centered over NEC in 1955–1975 (Figure 4a) but are weaker and located at lower latitudes in 1978–1998 (Figure 4b). Also, there appears no connection with ENSO in 1978–1998. [21] Notable differences are also seen in the 850 hPa height anomalies. A pronounced difference appears over the tropical North Pacific. In 1978–1998, large negative anomalies are seen over tropical western North Pacific (Figure 5b). These height anomalies appear to be a Rossby wave type response to warm SST anomalies in the tropical central North Pacific along 10°–20°N (Figure 3a). In 1955–1975, negative anomalies are only seen around Hawaii (Figure 5a). [22] Over the tropical Atlantic, there are larger and more significant positive anomalies in 1978–1998 (Figure 5b) than in 1955–1975 (Figure 5a). This is related to the difference in local SST anomalies (Figure 3). Negative SST anomalies induce higher pressure or height at low‐level through modulating surface heat fluxes [Lindzen and Nigam, 1987]. This effect is apparently larger in 1978–1998 than in 1955–1975. [23] Over the tropical Indian Ocean, positive anomalies are larger and extend northward to higher latitudes in 1955– 1975 (Figure 5a) than in 1978–1998 (Figure 5b). The difference indicates that the anomalous tropical heating is stronger and is located at higher latitudes in 1955–1975 than in 1978–1998. Anomalous tropical heating at higher latitudes is more effective in inducing anomalous circulation over the midlatitudes [Rodwell and Hoskins, 1996; Wu, 2002; Wu and Wang, 2002]. This explains why the upper‐
level anomalous circulation pattern over the midlatitude Asia is more pronounced in 1955–1975 (Figure 4a) than in 1978–1998 (Figure 4b). [24] Over NEC, significant negative height anomalies are seen in 1955–1975 (Figure 5a) but not in 1978–1998 (Figure 5b). This difference is similar to that seen at 200 hPa, indicating anomalous southward flow from the high‐latitudes during the summers of El Niño developing years in 1955–1975. These anomalous northerly flow brings more than normal cold air from the high‐latitudes to NEC [Northeast China Cold Summer Research Group, 1979; Wang and Wu, 1997; Sun et al., 2000], leading to cold summers in NEC in El Niño developing years (Figures 1a and 1c). Owing to the advection of mean westerly winds, the cold anomalies extend eastward. In addition, the low temperature may be contributed by the reduction of incoming shortwave radiation due to increase in cloudiness associated with the anomalous cyclone. In 1978–1998, the weak height and wind anomalies around NEC indicate that the impact of ENSO on the NEC summer temperature is relatively weak (Figures 1b and 1d). [25] Overall, the circulation anomalies indicate that the connection from ENSO to the midlatitude Asian circulation is weaker in 1978–1998 compared to 1955–1975. Why is this connection weakened after the late 1970s? The weakened connection can be explained by changes in the following two links. One is the link between ENSO and the South Asian heating. The other is the link between the South Asian heating and the midlatitude Asian circulation. There is evidence that the above two links are both weakened since the late 1970s, which is elaborated below.
6 of 15
D21107
WU ET AL.: ENSO‐CHINA SUMMER TEMPERATURE RELATION
D21107
Figure 6. Correlation of JJA 200 hPa v‐wind with AISR in (a) 1955–1975 and (b) 1978–1998. The contour values are ±0.1, ±0.3, ±0.5, and ±0.7. Shading denotes regions where the absolute values of correlation are larger than 0.433, which is significant at the 95% confidence level. [26] ENSO can induce anomalous vertical motion over India through an anomalous Walker circulation and thus affect the Indian summer monsoon. Previous studies have shown that the correlation between the Indian summer monsoon and ENSO has weakened after the late 1970s [Krishna Kumar et al., 1999; Krishnamurthy and Goswami, 2000; Wang et al., 2001; Wu and Wang, 2002]. The correlation coefficient between the AISR and DJF(1) NINO3.4 SST is −0.68 for 1955–1975 and −0.29 for 1978–1998, respectively. This confirms a weakened link between ENSO and the South Asian heating. This weakening is confirmed by the change in the anomalous vertical velocity at 500 hPa between the two periods (figures not shown). Anomalous descent over South Asia during the summers of El Niño developing years is larger in 1955–1975 than in 1978–1998. The area‐mean anomalies of vertical velocity at 500 hPa over 10°–25°N and 60°–90°E based on regression on DJF (1) NINO3.4 SST are 0.27 × 10⁻² Pa s−1 in 1955–1975 and 0.09 × 10⁻² Pa s−1 in 1978–1998. Consistently, the ENSO‐ related low‐level height anomalies over India are weaker in 1978–1998 (Figure 5b) compared to 1955–1975 (Figure 5a). [27] The reason for the above weakening of the Indian summer monsoon‐ENSO relationship has been discussed in previous studies [e.g., Krishna Kumar et al., 1999; Ashok et al., 2001; Kinter et al., 2002]. Ashok et al. [2004] indicated the impact of the Indian Ocean Dipole (IOD) on the Indian summer monsoon. Ashok et al. [2001] suggested that the frequent occurrence of the IOD may be the cause for the weakening of the Indian summer monsoon‐ENSO relationship after the late 1970s. This difference is consistent with the appearance of large negative SST anomalies in the tropical southeast Indian Ocean in JJA(0) of 1978–1998 (Figure 3b).
[28] Previous studies showed a connection between the Indian and East Asian summer monsoons. For example, the summer rainfall in India and North China displays a positive correlation [e.g., Kripalani et al., 1997; Wu, 2002]. One way connecting the two summer monsoons is through a zonal wave pattern over the midlatitude Asia [e.g., Krishnan and Sugi, 2001; Wu, 2002], which is contributed by anomalous heating induced by Indian rainfall anomalies [Wu et al., 2003]. Wu [2002] and Wu and Wang [2002] showed that the connection between the midlatitude Asian circulation and the Indian summer monsoon experienced an obvious weakening after the late 1970s. One plausible explanation for this weakening, as proposed by Wu [2002] and Wu and Wang [2002], is the change in the distribution of summer rainfall variability in India. Analysis of observed Indian district rainfall showed that, after the late 1970s, the summer rainfall variability increases in the peninsular and central northeast India, whereas it decreases in both the northwest and west‐central India [Wu, 2002; Wu and Wang, 2002]. Since anomalous tropical heating at the higher latitudes (northwest and west‐central India) is more efficient than that at the lower latitudes (peninsular India) in modulating the midlatitude circulation [Rodwell and Hoskins, 1996], the redistribution of summer rainfall variability in India indicates that the impact of the Indian summer monsoon on the midlatitude Asian circulation is reduced after the late 1970s. [29] Here, as a further support for this argument, we show in Figure 6 the correlation of 200 hPa v‐wind with the AISR. In 1955–1975, large correlation is seen over the midlatitude Asia, extending from the Caspian Sea to the Japan Sea (Figure 6a). This result suggests that La Niña induced above‐normal AISR perturbs the meridional winds over
7 of 15
D21107
WU ET AL.: ENSO‐CHINA SUMMER TEMPERATURE RELATION
D21107
Figure 7. Anomalies of SST (°C) in (a, b) DJF(0), (c, d) MAM(0), and (e, f ) JJA(0) in (left) 1955–1975 and (right) 1978–1998 obtained by regression on JJA(0) NEC temperature. The contour values are ±0.1°C, ±0.2°C, ±0.4°C, ±0.6°C, and ±0.8°C. Shading denotes regions where the absolute values of the corresponding correlation are larger than 0.433, which is significant at the 95% confidence level. midlatitude Asia, which then propagate eastward along the westerly jet waveguide to East Asia. In 1978–1998, the negative correlation over South Asia has a limited northward extension and the correlation over west Asia is weak (Figure 6b). As such, the AISR induced midlatitude wind perturbations are weaker. The above difference in the circulation anomalies indicates a weakening in the connection from the South Asian heating to NEC summer temperature. Indeed, the simultaneous correlation coefficients between the NEC JJA temperature and the area‐mean vertical velocity at 500 hPa over 10°–25°N and 60°–90°E are −0.44 in 1955–1975 and −0.23 in 1978–1998.
4. SST and Circulation Anomalies Associated With the NEC Summer Temperature Anomalies [30] As discussed in section 3, ENSO does not have a good relationship with the NEC summer temperature in 1978–1998. Then, what are the plausible factors for NEC temperature anomalies during this period? To address this question, we analyze SST and circulation anomalies associated with the NEC summer temperature anomalies.
Figure 7 shows the SST anomalies in DJF(0), MAM(0), and JJA(0) as obtained by regression on the NEC JJA(0) temperature for 1955–1975 and 1978–1998, respectively. [31] The evolution of tropical Pacific SST anomalies indicates a developing La Niña condition in 1955–1975 (Figures 7a, 7c, and 7e). In 1978–1998, the SST evolution suggests a persisting La Niña state or a mixture of decaying and developing La Niña events (Figures 7b, 7d, and 7f). The eastern equatorial Pacific SST anomalies in DJF(0), however, are not particularly significant (Figure 7b). [32] There are important differences in the eastern Indian Ocean and the western Pacific. Large negative SST anomalies are seen around the Maritime Continent in MAM (0) and JJA(0) during 1978–1998 (Figures 7d and 7f), whereas the local SST anomalies are weak in 1955–1975 (Figures 7c and 7e). [33] Precursory signals can be found in the North Pacific where SST anomalies show a contrast between the central and eastern oceans in both periods. In comparison, the contrast is seen from DJF(0) to MAM(0) in 1955–1975 (Figures 7a and 7c) and from MAM(0) to JJA(0) in 1978– 1998 (Figures 7d and 7f). In addition, the anomalies are of
8 of 15
D21107
WU ET AL.: ENSO‐CHINA SUMMER TEMPERATURE RELATION
D21107
Figure 8. Anomalies of surface air temperature (2 m) (°C) in JJA in (a) 1955–1975 and (b) 1978–1998 obtained by regression on JJA NEC temperature. The contour values are ±0.1°C, ±0.2°C, ±0.4°C, ±0.6°C, and ±0.8°C. Shading denotes regions where the absolute values of the corresponding correlation are larger than 0.433, which is significant at the 95% confidence level. opposite signs between the two epochs. It is unclear at present whether there is a physical connection between the North Pacific SST anomalies in preceding DJF or MAM and the NEC summer temperature anomalies. [34] The positive SST anomalies in the Japan Sea and the midlatitude North Pacific in JJA (Figures 7e and 7f) seem to be linked to warm surface air temperature anomalies extending from NEC to the North Pacific (Figure 8) under mean westerly winds over the midlatitudes. The warm surface air temperature anomalies are expected to reduce the sea‐air temperature difference and the heat loss of the ocean, which would favor warmer SSTs. In comparison, the eastward extension of both surface air temperature and SST anomalies is more pronounced in 1978–1998 compared to 1955–1975. [35] Important difference is seen in the North Atlantic Ocean. In 1955–1975, there are positive SST anomalies in the midlatitude North Atlantic in DJF(0) (Figure 7a) and in eastern North Atlantic in MAM(0) and JJA(0) (Figures 7c and 7e). In 1978–1998, there is clearly a tripole SST anomaly pattern in MAM(0) and JJA(0) (Figures 7d and 7f): negative anomalies in the tropics and midlatitudes and positive anomalies in the subtropics. There are changes from MAM(0) to JJA(0) in both the location and the amplitude of these anomalies. Previous studies have linked the climate variability in China to the North Atlantic SST anomalies and the related North Atlantic Oscillation (NAO) or Arctic Oscillation (AO) [Gong and Ho, 2003; Watanabe, 2004; Ju et al., 2005; Li et al., 2005; Lu et al., 2006; Sung et al., 2006; Gu et al., 2009; Z. Wu et al., 2009]. Z. Wu et al. [2009] indicated that anomalous NAO in spring could induce a tripole SST anomaly pattern in the North Atlantic that persisted into ensuing summer and excited atmospheric teleconnection affecting the East Asian summer monsoon. The present analysis suggests that the North Atlantic SST anomaly pattern that could be linked to the East Asian climate may have changed. [36] Figure 9 shows the JJA(0) height anomalies at 200 hPa, 500 hPa, and 850 hPa obtained by regression on the NEC JJA(0) temperature for 1955–1975 and 1978–1998, respectively. The distribution of height anomalies over Asia and the North Pacific is similar between the two epochs (Figure 9). Positive height anomalies occupy the midlatitudes of East Asia and the North Pacific. The anomalous southerly
flow to the west of the anomalous anticyclone transports more than normal warm air from the low latitudes and thus leads to higher than normal air temperature over NEC. [37] The height anomalies display notable differences over North America, the North Atlantic, and Europe. In 1955– 1975, the height anomalies feature a zonal pattern with positive, negative, and positive values over North America, the North Atlantic, and the eastern North Atlantic and western Europe, respectively (Figures 9a, 9c, and 9e). In 1978–1998, the most prominent feature is a meridional pattern over the North Atlantic: the height anomalies from the tropics to the high‐latitudes are alternatively negative, positive, negative, and positive (Figures 9b, 9d, and 9f). This pattern extends to Eurasia and is connected to the positive height anomalies over NEC although the height anomalies over Europe are weak and not statistically significant. [38] The above contrast in height anomalies tends to be consistent with the difference in the North Atlantic SST anomalies (Figures 7e and 7f). In 1955–1975, the zonal height anomaly pattern is accompanied by a zonal contrast of (weak) SST anomalies. In 1978–1998, the meridonal height anomaly pattern corresponds to the tripole SST anomaly pattern. This feature results from the air‐sea interaction in the North Atlantic Ocean [e.g., Watanabe et al., 1999; Pan, 2005]. In particular, the tripole SST pattern in MAM(0) and JJA(0) in 1978–1998 is similar to that shown by the correlation of SST with the NAO index in spring [Z. Wu et al., 2009, Figure 5]. The relationship of the NEC summer temperature and the North Atlantic SST will be further investigated in a future study. [39] Over the tropical western Pacific, large negative height anomalies are seen at low‐level in 1978–1998 (Figure 9f) but not in 1955–1975 (Figure 9e). This difference may be linked to the negative SST anomalies in the tropical southeast Indian Ocean and the Maritime Continent (Figure 7f). The negative SST anomalies induce anomalous descent, which is confirmed by anomalous vertical velocity at 500 hPa (figure not shown). In consequence, compensating anomalous ascent develops over South Asia and the tropical western North Pacific, inducing low‐level negative height anomalies (Figure 9f). In response to the anomalous heating over the South China Sea and the tropical western Pacific, there is a meridional height anomaly pattern over the western North Pacific and East Asia in 1978–1998
9 of 15
D21107
WU ET AL.: ENSO‐CHINA SUMMER TEMPERATURE RELATION
D21107
Figure 9. Anomalies of JJA geopotential height (m) at (a, b) 200 hPa, (c, d) 500 hPa, and (e, f) 850 hPa in (left) 1955–1975 and (right) 1978–1998 obtained by regression on JJA NEC temperature. The contour values are ±2 m, ±4 m, ±8 m, ±12 m, ±16 m, and ±20 m in Figures 9a and 9b; ±1 m, ±3 m, ±6 m, ±9 m, ±12 m, and ±15 m in Figures 9c and 9d; ±1 m, ±2 m, ±4 m, ±6 m, ±8 m, and ±10 m in Figures 9e and 9f. Shading denotes regions where the absolute values of the corresponding correlation are larger than 0.433, which is significant at the 95% confidence level. (Figures 9d and 9f), which seems to contribute to the positive height anomalies over NEC. [40] The above analysis suggests that the North Atlantic SST may be an important factor for the variations of NEC summer temperature in 1978–1998. In particular, the tripole SST anomaly pattern in the North Atlantic may excite downstream development of a teleconnection pattern across Eurasia and induce atmospheric circulation changes over East Asia, which influence the NEC temperature. In 1978– 1998, the tripole SST pattern appears in spring, and thus it may serve as a precursor for the NEC summer temperature anomalies.
5. Contrast of Two Opposite Types of Relationship Between the NEC Summer Temperature and ENSO [41] As shown in Figure 2a and Table 1, the DJF(1) NINO3.4 SST and JJA(0) NEC temperature anomalies are of the same sign in some years but have opposite signs in
other years. The change in the relative frequency of same‐ sign and opposite‐sign years is reflected in the correlation contrast before and after the late 1970s. Here, we compare the SST and circulation anomalies in the above two types of years to understand why the relationship is positive in some years but negative in other years. [42] Figure 10 shows the composite SST anomalies in DJF(0), MAM (0), and JJA(0) for the same‐sign cases and opposite‐sign cases, respectively. Figure 11 shows the similar composite height anomalies in JJA(0) at 200 hPa, 500 hPa, and 850 hPa. In constructing the composite, we have reversed the anomalies when the NEC temperature anomalies are negative. Shading in Figures 10–11 denotes the magnitude of composite anomalies larger than 0.7 standard deviation of individual anomalies with respect to the composite anomalies in the same type of years, which is used as a measure of the statistical significance of the composite anomalies. As seen from Table 1, there are more same‐sign cases in 1978–2007 (7) than in 1951–1977 (2), and more opposite‐sign cases in 1951–1977 (9) than in
10 of 15
D21107
WU ET AL.: ENSO‐CHINA SUMMER TEMPERATURE RELATION
D21107
Figure 10. Composite anomalies of SST (°C) in (a, b) DJF(0), (c, d) MAM(0), and (e, f ) JJA(0) for (left) the same‐sign cases and (right) the opposite‐sign cases. The contour values are ±0.1°C, ±0.2°C, ±0.4°C, ±0.6°C, ±0.8°C, and ±1.0°C. Shading denotes regions where the absolute anomalies are larger than 0.7 standard deviation of individual anomalies with respect to the composite anomalies.
1978–2007 (5). The results in Figures 10–11 and related discussions in the following correspond to positive NEC summer temperature anomalies but are applicable to opposite anomalies except for a switch in the sign of anomalies. [43] The SST anomalies in the eastern equatorial Pacific display different temporal evolution between the two types of years (Figure 10), which is expected since the DJF(1) SST anomalies are opposite for the two types of cases. One feature to note is that the anomalies develop earlier in the opposite‐sign cases than in the same‐sign cases. This is because there are more opposite‐sign cases from earlier years during which the ENSO transition occurred at an earlier time of the calendar year and there are more same‐ sign cases from recent years during which the ENSO transition tends to occur later. [44] One important difference is seen in the SST anomalies in the tropical central North Pacific. In the same‐sign cases, positive SST anomalies persist from DJF(0) to JJA(0) (Figures 10a, 10c, and 10e), whereas in the opposite‐sign cases, SST anomalies are weak in this region (Figures 10b, 10d, and 10f). Another difference is in the midlatitude central North Pacific where opposite SST anomalies are
seen in DJF(0) and MAM(0) (Figures 10a and 10c and Figures 10b and 10d). [45] Remarkably different SST anomalies are seen in the North Atlantic. In the same‐sign cases, a tripole SST anomaly pattern appears in MAM(0) (Figure 10c). In JJA (0), negative SST anomalies in the midlatitudes become larger, but positive SST anomalies in the subtropics become weaker (Figure 10c). In the opposite‐sign cases, the MAM (0) SST anomalies display an east‐west contrast in the midlatitudes (Figure 10d) and the JJA(0) SST anomalies are weak (Figure 10f). [46] The SST anomaly pattern in the same‐sign and opposite‐sign cases looks similar to that in 1978–1998 and 1955–1975, respectively. However, there are important differences in the magnitude of SST anomalies, in particular, in the tropical Pacific and the North Atlantic in JJA(0). The positive SST anomalies in the tropical central North Pacific are much larger and the SST anomalies in the North Atlantic tend to shift toward negative in the same‐sign cases compared to 1978–1998 (Figure 10e versus Figure 7f). [47] In the opposite‐sign cases, the circulation anomalies resemble those in 1955–1975. Over the midlatitude Asia is
11 of 15
D21107
WU ET AL.: ENSO‐CHINA SUMMER TEMPERATURE RELATION
D21107
Figure 11. Composite anomalies of JJA(0) geopotential height (m) at (a, b) 200 hPa, (c, d) 500 hPa, and (e, f) 850 hPa for (left) the same‐sign cases and (right) the opposite‐sign cases. The contour values are ±2 m, ±4 m, ±8 m, ±12 m, ±16 m, ±20 m, ±24 m, ±28 m, and ±32 m in Figures 11a and 11b; ±1 m, ±3 m, ±6 m, ±9 m, ±12 m, ±15 m, ±18 m, ±21 m, and ±24 m in Figures 11c and 11d; ±1 m, ±2 m, ±4 m, ±6 m, ±8 m, ±10 m, ±12 m, ±14 m, and ±16 m in Figures 11e and 11f. Shading denotes regions where the absolute anomalies are larger than 0.7 standard deviation of individual anomalies with respect to the composite anomalies. an upper‐level zonal pattern, with an anomalous barotropic anticyclone over NEC (Figures 11b, 11d, and 11f). The anomalous southerly flow to the west of the anticyclone transports more than normal warm air from the low‐latitudes, which explains why the NEC summer temperature is higher than normal. The positive height anomalies at 200 hPa over west Asia (Figure 11b) are accompanied by the negative height anomalies at 850 hPa over South Asia (Figure 11f). This features a Gill‐type response to the anomalous heating over South Asia [Wu, 2002; Wu and Wang, 2002], which is induced by the La Niña state in the eastern equatorial Pacific (Figure 10f). Indeed, the composite 500 hPa vertical velocity shows anomalous ascent over South Asia (not shown). The height anomalies over North America through the North Atlantic and Europe feature alternative positive and negative values (Figures 11b, 11d, and 11f). [48] In the composite of the same‐sign cases, an anomalous barotropic anticylone is seen over NEC (Figures 11a, 11c, and 11e), which is similar to the opposite‐sign cases.
Different from the opposite‐sign cases, the anomalous anticyclone is part of a meridional pattern over the western North Pacific and East Asia, which seems to be excited by anomalous heating induced by warm SST anomalies in the tropical central North Pacific (Figure 10e). This is confirmed by the composite 500 hPa vertical velocity that displays anomalous ascent over the South China Sea and the tropical western North Pacific (not shown). A wave pattern is seen to extend from subtropical North Atlantic to northwestern Europe and then turn southeastward to NEC (Figures 11a, 11c, and 11e), which is quite similar to 1978–1998 (Figures 9b, 9d, and 9f). This wave pattern may be linked to the SST anomalies in the North Atlantic, as shown by Z. Wu et al. [2009] from both observational evidence and numerical experiments. For example, positive height anomalies at low‐level (Figure 11e) and negative height anomalies at upper‐level (Figure 11a) over Central America and western North Atlantic feature a Gill‐type response to negative SST anomalies in the Caribbean Sea and tropical North Atlantic (Figure 10e).
12 of 15
D21107
WU ET AL.: ENSO‐CHINA SUMMER TEMPERATURE RELATION
[49] Overall, in the opposite‐sign years, the NEC summer temperature anomalies are mainly due to atmospheric circulation changes in response to the anomalous heating over South Asia induced by the tropical eastern Pacific SST anomalies. In the same‐sign years, the height anomalies over NEC are contributed by both the North Atlantic SST anomalies and the tropical North Pacific SST anomalies. The former generates a wave pattern over the North Atlantic and Eurasia. The latter induces anomalous heating over the tropical western North Pacific that excites a meridional wave pattern over East Asia. Thus it seems that the same‐ sign relationship between the JJA(0) NEC temperature and the DJF(1) NINO3.4 SST occurs because of the North Atlantic SST and tropical North Pacific SST anomalies. The effects of these SST anomalies tend to overcome the impacts of the SST anomalies in the central and eastern equatorial Pacific.
6. Summary and Discussions [50] The relationship of interannual variations of the NEC summer temperature with ENSO experienced an obvious change in the late 1970s. Before the late 1970s, the NEC summer temperature tends to be lower (higher) than normal during the El Niño (La Niña) developing years, whereas after the late 1970s, this relationship is weakened or even becomes opposite. Present analysis shows that the weakening of the relationship is related to a change in the relative frequency of the same‐sign and opposite‐sign years between the NEC summer temperature and central and eastern equatorial Pacific winter SST anomalies. Before the late 1970s, there are more opposite‐sign than same‐sign years, whereas after the later 1970s, the same‐sign years are relatively more than the opposite‐sign years. [51] The weakening of the above relationship is related to changes in the link between the ENSO and the Indian summer monsoon and that between the South Asian heating and the midlatitude Asian circulation. The two links have been both weakened after the late 1970s, leading to a weakening of the influence of ENSO on the East Asian circulation, and thus the NEC summer temperature. The weakened connection between ENSO and the Indian summer monsoon may be associated with a change in the effects of regional SST anomalies outside the central and eastern equatorial Pacific. [52] The present analysis discloses a close relationship of the NEC summer temperature anomalies with the North Atlantic SST in spring and summer in the 1980s and 1990s. It is found that a tripole North Atlantic SST anomaly pattern in boreal spring is a good precursory for the NEC summer temperature anomalies. The North Atlantic SST anomalies induce anomalous circulation over the North Atlantic that extends downstream through Eurasia to NEC. The SST anomalies in the regions surrounding the Maritime Continent may also influence the NEC summer temperature changes through exciting a meridional circulation anomaly pattern over the western North Pacific and East Asia. [53] A composite analysis suggests that in many years the effects of central and eastern equatorial Pacific SST anomalies can be overcome by those of the tropical North Pacific and the North Atlantic SST anomalies, thus leading to the same‐sign relationship between the NEC summer
D21107
temperature and central and eastern equatorial Pacific SST anomalies. This suggests the importance of ENSO‐related regional SST anomalies in determining the relationship between ENSO and the NEC summer temperature. [54] One finding of the present study is that the North Atlantic SST anomalies may have impacts on the NEC summer temperature after the late 1970s. Further analysis will be necessary to compare the statistical relationship before and after the late 1970s. Is this change due to difference in the relative frequency of the same‐sign versus opposite‐sign relationship between the NEC summer temperature and the North Atlantic SST anomalies? What is the factor for the NEC summer temperature in the same‐sign relation years? These will be the topics in a following study. [55] The correlation analysis suggests that the ENSO impact on the NEC summer temperature has been more robust before the late 1970s, whereas the North Atlantic SST impact has become larger after the late 1970s. The correlation reflects a statistical relationship in the whole period for which the correlation is calculated. It is possible that in individual years, either ENSO or the North Atlantic SST contributes individually or both of them contribute coherently or interferently to the NEC summer temperature anomalies. The individual and combined impacts of the ENSO and the North Atlantic SST on the NEC summer temperature will be investigated in a following study as well. [56] Figure 1 suggests that the relationship of southern China summer temperature with ENSO also experienced an obvious change in the late 1970s. The correlation is weak before the late 1970s and significant negative after the 1970s. This calls for a future study to understand this change and to investigate plausible reasons for the change. [57] The present study focuses on the relationship between SST and NEC temperature. The changes in midlatitude circulation are influenced by other external forcing, such as the Eurasian snow cover [e.g., Wu and Kirtman, 2007] and the Arctic sea ice [e.g., B. Wu et al., 2009]. It is possible that the impacts of these factors may have changed and contributed to the interdecadal change in the relationship between ENSO and NEC summer temperature, which deserves future studies. [58] Acknowledgments. The authors appreciate comments of Bohua Huang and three anonymous reviewers. This research was supported by grants from the NSF (ATM‐0830068), NOAA (NA09OAR4310058 and NA09OAR4310186), and NASA (NNX09AN50G). SL, LS, YL, and ZG were supported by the Governor’s Foundation of Jilin Province of China.
References Ashok, K., Z. Guan, and T. Yamagata (2001), Impact of the Indian Ocean Dipole on the relationship between the Indian Monsoon rainfall and ENSO, Geophys. Res. Lett., 28, 4499–4502, doi:10.1029/ 2001GL013294. Ashok, K., Z. Guan, N. H. Saji, and T. Yamagata (2004), Individual and combined influences of ENSO and the Indian Ocean dipole on the Indian summer monsoon, J. Clim., 17, 3141–3155, doi:10.1175/1520-0442 (2004)0172.0.CO;2. Chiang, J. C. H., and A. H. Sobel (2002), Tropical tropospheric temperature variations caused by ENSO and their influence in the remote tropical climate, J. Clim., 15, 2616–2631, doi:10.1175/1520-0442(2002)0152.0.CO;2. Ding, Q., and B. Wang (2005), Circumglobal teleconnection in the Northern Hemisphere summer, J. Clim., 18, 3483–3505, doi:10.1175/ JCLI3473.1.
13 of 15
D21107
WU ET AL.: ENSO‐CHINA SUMMER TEMPERATURE RELATION
Ding, S.‐S. (1980), The climatic analysis of low temperature in summer over the Northeast China and influence for agricultural product, Acta Meteorol. Sin., 38(3), 234–242 (in Chinese). Fu, C.‐B., and X.‐L. Teng (1988), Relationship between summer climate in China and El Niño/Southern Oscillation phenomenon, (in Chinese), Chin. J. Atmos. Sci., 12, 133–141. Gong, D.‐Y., and C.‐H. Ho (2003), Arctic Oscillation signals in the East Asian summer monsoon, J. Geophys. Res., 108(D2), 4066, doi:10.1029/2002JD002193. Greatbatch, R. J., and P.‐P. Rong (2006), Discrepancies between different Northern Hemisphere summer atmospheric data products, J. Clim., 19, 1261–1273, doi:10.1175/JCLI3643.1. Gu, W., C.‐Y. Li, X. Wang, W. Zhou, and W.‐J. Li (2009), Linkage between Mei‐yu precipitation and North Atlantic SST on the decadal timescale, Adv. Atmos. Sci., 26(1), 101–108, doi:10.1007/s00376-0090101-5. Guan, Z., and L.‐P. Li (2008), Interannual variability of summer climate of China in association with ENSO and the Indian Ocean dipole, in Regional Climate Studies of China, edited by C. Fu et al., pp. 119–154, Springer, New York. Hu, K.‐M., and G. Huang (2010), The formation of precipitation anomaly patterns during the developing and decaying phases of ENSO, Atmos. Ocean Sci. Lett., 3, 25–30. Huang, R.‐H., and Y.‐F. Wu (1989), The influence of ENSO on the summer climate change in China and its mechanism, Adv. Atmos. Sci., 6, 21–32, doi:10.1007/BF02656915. Inoue, T., and J. Matsumoto (2004), A comparison of summer sea level pressure over East Eurasia between NCEP‐NCAR reanalysis and ERA‐40 for the period 1960–99, J. Meteorol. Soc. Jpn., 82, 951–958, doi:10.2151/jmsj.2004.951. Ju, J.‐H., J. Cao, and J. Ren (2005), Possible impacts of the Arctic Oscillation on the interdecadal variation of summer monsoon rainfall in East Asia, Adv. Atmos. Sci., 22, 39–48, doi:10.1007/BF02930868. Kalnay, E., et al. (1996), The NCEP/NCAR 40‐year reanalysis project, Bull. Am. Meteorol. Soc., 77, 437–471, doi:10.1175/1520-0477(1996) 0772.0.CO;2. Kinter, J. L., III, K. Miyakoda, and S. Yang (2002), Recent change in the connection from the Asian monsoon to ENSO, J. Clim., 15, 1203–1215, doi:10.1175/1520-0442(2002)0152.0.CO;2. Kripalani, R. H., A. Kulkarni, and S. V. Singh (1997), Association of the Indian summer monsoon with the Northern Hemisphere mid‐latitude circulation, Int. J. Climatol., 17, 1055–1067, doi:10.1002/(SICI)1097-0088 (199708)17:103.0.CO;2-3. Krishna Kumar, K., B. Rajagopolan, and M. A. Cane (1999), On the weakening relationship between the Indian monsoon and ENSO, Science, 284, 2156–2159, doi:10.1126/science.284.5423.2156. Krishnamurthy, V., and B. N. Goswami (2000), Indian monsoon‐ENSO relationship on interdecadal timescales, J. Clim., 13, 579–595, doi:10.1175/1520-0442(2000)0132.0.CO;2. Krishnan, R., and M. Sugi (2001), Baiu rainfall variability and associated monsoon teleconnections, J. Meteorol. Soc. Jpn., 79, 851–860, doi:10.2151/ jmsj.79.851. Li, Q., S. Yang, V. E. Kousky, R. W. Higgins, K.‐M. Lau, and P. Xie (2005), Features of cross‐Pacific climate shown in the variability of China and US precipitation, Int. J. Climatol., 25, 1675–1696, doi:10.1002/joc.1271. Lian, Y., and G. An (1998), The relationship among East Asian summer monsoon, El Niño and low temperature in Songliao Plains of Northeast China, Acta Meteorol. Sin., 56(6), 724–735(in Chinese). Lindzen, R. S., and S. Nigam (1987), On the role of sea surface temperature gradients in forcing low‐level winds and convergence in the Tropics, J. Atmos. Sci., 44, 2418–2436, doi:10.1175/1520-0469(1987)0442.0.CO;2. Liu, S., and N. Wang (2001), The impacts of antecedent ENSO event on air temperature over Northeast China in summer (in Chinese), J. Trop. Meteorol., 17(3), 314–319. Lu, R., B. Dong, and H. Ding (2006), Impact of the Atlantic multidecadal oscillation on the Asian summer monsoon, Geophys. Res. Lett., 33, L24701, doi:10.1029/2006GL027655. Matsuura, K., and C. J. Willmott (2009), Terrestrial air temperature: 1900– 2008 Gridded Monthly Time Series (Version 2.01), Cent. for Clim. Res., Dep. of Geogr., Univ. of Del., Newark. (Available at http://climate.geog.udel.edu/~climate/html_pages//Global2_Ts_2009/README. global_t_ts_2009.html) Newell, R. E., and Z.‐X. Wu (1992), The interrelationships between temperature changes in the free atmosphere and sea surface temperature changes, J. Geophys. Res., 97(D4), 3693–3709. Nitta, T. (1987), Convective activities in the tropical western Pacific and their impacts on the Northern Hemisphere summer circulation, J. Meteorol. Soc. Jpn., 65, 373–390.
D21107
Northeast China Cold Summer Research Group (1979), A preliminary study on the long‐range forecasting of the cold/warm summer in Northeast China (in Chinese), Acta Meteorol. Sin., 37(3), 44–58. Pan, L. (2005), Observed feedback between the NAO and the North Atlantic SSTA tripole, Geophys. Res. Lett., 32, L06707, doi:10.1029/ 2005GL022427. Pan, Y.‐H., and A. H. Oort (1983), Global climate variations connected with sea surface temperature anomalies in the eastern equatorial Pacific Ocean for the 1958–73 period, Mon. Weather Rev., 111, 1244–1258, doi:10.1175/1520-0493(1983)1112.0.CO;2. Parthasarathy, B., A. A. Munot, and D. R. Kothawalen (1994), All‐Indian monthly and seasonal rainfall series: 1871–1993, Theor. Appl. Climatol., 49, 217–224, doi:10.1007/BF00867461. Rodwell, M. J., and B. J. Hoskins (1996), Monsoons and the dynamics of deserts, Q. J. R. Meteorol. Soc., 122, 1385–1404, doi:10.1002/ qj.49712253408. Smith, T. M., R. W. Reynolds, T. C. Peterson, and J. Lawrimore (2008), Improvements to NOAA’s historical merged land‐ocean surface temperature analysis (1880–2006), J. Clim., 21, 2283–2296, doi:10.1175/ 2007JCLI2100.1. Sobel, A. H., I. M. Held, and C. S. Bretherton (2002), The ENSO signal in tropical tropospheric temperature, J. Clim., 15, 2702–2706, doi:10.1175/ 1520-0442(2002)0152.0.CO;2. Sun, J.‐Q., and H.‐J. Wang (2006), Regional difference of summer air temperature anomalies in Northeast China and its relationship to atmospheric general circulation and sea surface temperature (in Chinese), Chin. J. Geophys., 49(3), 588–598. Sun, L., G. An, Y. Lian, B.‐Z. Shen, and X.‐L. Tang (2000), A study of the persistent activity of Northeast cold vortex in summer and its general circulation anomaly characteristics (in Chinese), Acta Meteorol. Sin., 58(6), 704–714. Sun, Y.‐T., S.‐Y. Wang, and Y.‐Q. Yang (1983), Studies on cool summer and crop yield in Northeast China (in Chinese), Acta Meteorol. Sin., 41(3), 313–321. Sung, M.‐K., W. Kwon, H. Back, K. Boo, G. Lim, and J. Kug (2006), A possible impact of the North Atlantic Oscillation on the east Asian summer monsoon precipitation, Geophys. Res. Lett., 33, L21713, doi:10.1029/ 2006GL027253. Wang, B., R. Wu, and X. Fu (2000), Pacific‐East Asian teleconnection: How does ENSO affect East Asian climate? J. Clim., 13, 1517–1536, doi:10.1175/1520-0442(2000)0132.0.CO;2. Wang, B., R. Wu, and K.‐M. Lau (2001), Interannual variability of the Asian summer monsoon: Contrasts between the Indian and the western North Pacific‐east Asian monsoons, J. Clim., 14, 4073–4090, doi:10.1175/1520-0442(2001)0142.0.CO;2. Wang, B., J. Yang, T.‐J. Zhou, and B. Wang (2008), Interdecadal changes in the major modes of Asian‐Australian monsoon variability: Strengthening relationship with ENSO since the late 1970s, J. Clim., 21, 1771–1789, doi:10.1175/2007JCLI1981.1. Wang, J.‐F., and G.‐X. Wu (1997), Evolution and characteristic of the persistent cold summer in Northeast China (in Chinese), Chin. J. Atmos. Sci., 21(5), 523–532. Watanabe, M. (2004), Asian jet waveguide and a downstream extension of the North Atlantic Oscillation, J. Clim., 17, 4674–4691, doi:10.1175/ JCLI-3228.1. Watanabe, M., M. Kimoto, and T. Nitta (1999), A comparison of decadal climate oscillations in the North Atlantic detected in observations and a coupled GCM, J. Clim., 12, 2920–2940, doi:10.1175/1520-0442(1999) 0122.0.CO;2. Wu, B., R.‐H. Zhang, B. Wang, and R. D’Arrigo (2009), On the association between spring Arctic sea ice concentration and Chinese summer rainfall, Geophys. Res. Lett., 36, L09501, doi:10.1029/2009GL037299. Wu, R. (2002), A mid‐latitude Asian circulation anomaly pattern in boreal summer and its connection with the Indian and east Asian summer monsoons, Int. J. Climatol., 22, 1879–1895, doi:10.1002/joc.845. Wu, R., and B. P. Kirtman (2007), Observed relationship of spring and summer East Asian rainfall with winter and spring Eurasian snow, J. Clim., 20, 1285–1304, doi:10.1175/JCLI4068.1. Wu, R., and B. Wang (2002), A contrast of the east Asian summer monsoon‐ENSO relationship between 1962–77 and 1978–93, J. Clim., 15, 3266–3279, doi:10.1175/1520-0442(2002)0152.0. CO;2. Wu, R., Z.‐Z. Hu, and B. P. Kirtman (2003), Evolution of ENSO‐related rainfall anomalies in east Asia, J. Clim., 16, 3742–3758, doi:10.1175/ 1520-0442(2003)0162.0.CO;2. Wu, R., J. L. Kinter III, and B. P. Kirtman (2005), Discrepancy of interdecadal changes in the Asian region among the NCEP‐NCAR reanalysis, objective analyses, and observations, J. Clim., 18, 3048–3067, doi:10.1175/JCLI3465.1.
14 of 15
D21107
WU ET AL.: ENSO‐CHINA SUMMER TEMPERATURE RELATION
Wu, Z., B. Wang, J.‐P. Li, and F.‐F. Jin (2009), An empirical seasonal prediction model of the east Asian summer monsoon using ENSO and NAO, J. Geophys. Res., 114, D18120, doi:10.1029/2009JD011733. Yang, S., and K.‐M. Lau (2006), Interannual variability of the Asian monsoon, in The Asian Monsoon, edited by B. Wang, pp. 259–293, Praxis, Chichester, U. K. Yang, S., K.‐M. Lau, and K.‐M. Kim (2002), Variations of the East Asian jet stream and Asian‐Pacific‐American winter climate anomalies, J. Clim., 15, 306–325, doi:10.1175/1520-0442(2002)0152.0.CO;2. Yao, P.‐Z. (1995), The climate features of summer low temperature cold damage in Northeast China during recent 40 years (in Chinese), J. Catastrophology, 10(1), 51–56. Yuleva, E., and J. M. Wallace (1994), The signature of ENSO in global temperature and precipitation fields derived from the microwave sounding unit, J. Clim., 7, 1719–1736, doi:10.1175/1520-0442(1994) 0072.0.CO;2. Zhang, R.‐H., A. Sumi, and M. Kimoto (1999), A diagnostic study of the impact of El Niño on the precipitation in China, Adv. Atmos. Sci., 16, 229–241, doi:10.1007/BF02973084.
D21107
Zhu, Y.‐F., L.‐X. Chen, and R.‐C. Yu (2004), Anomalous climate variation and ENSO cycle on the quasi‐four‐year scale, J. Trop. Meteorol., 10(1), 1–13. Zhu, Y.‐M., X.‐Q. Yang, X.‐Y. Chen, S.‐S. Zhao, and X.‐G. Sun (2007), Interdecadal variation of the relationship between ENSO and summer interannual climate variability in China, J. Trop. Meteorol., 13(2), 132–136. Z. Gao, Y. Lian, S. Liu, and L. Sun, Institute of Meteorological Sciences of Jilin Province, 6366 Xi’an Rd., Changchun, Jilin 130062, China. R. Wu, Center for Ocean‐Land‐Atmosphere Studies, Institute of Global Environment and Society, 4041 Powder Mill Rd., Suite 302, Calverton, MD 20705, USA. (
[email protected]) S. Yang, NOAA Climate Prediction Center, Camp Springs, MD 20746, USA.
15 of 15