Dr. Venables' present address is Royal Hallamshire Hospital,. Sheffield, U.K.. Abbreviations used: FSO, full-scale deflection; SO, spreading depression. 79.
Journal of Cerebral Blood Flow and Metaholism 8:79-88 © 1988 Raven Press, Ltd., New York
Changes in Vascular and Metabolic Reactivity as Indices of Ischaemia in the Penumbra
A. 1. Strong, G. Gibson, Susan A. Miller, and *G. S. Venables Department of Surgery (Neurosurgery) and *Department of Neurology, University of Newcastle upon Tyne, U.K.
Summary: The reactivities of cerebral cortical blood flow
< 0.01). Hyperaemic responses at anteromedial sites on the marginal gyrus significantly exceeded those at pos terolateral sites. The results are interpreted as indicating early ischaemic metabolic change; however, the presence of residual vasodilator responses to stimulation suggests that flow reduction and early ischaemic change in the ter ritory studied are not simply due to inadequate collateral input, but may also reflect deafferentation or functional suppression. The possible significance of diminished vas cular reactivity in the penumbra as a cause of increased vulnerability to extracellular release of excitatory amino acids is discussed. Key Words: Diaschisis-Local cere bral blood flow-Middle cerebral artery occlusion NADH fluorescence-Vasoregulation.
(hydrogen clearance) and of compensated NADH fluo rescence to local cortical electrical stimulation were ex amined on the marginal gyrus before and after transor bital occlusion of the middle cerebral artery in cats. Pre stimulus cerebral blood flow (CBF) was 38.2 ± 12.9 (SD) ml 100 g-I min -I and fell to 19.8 ± 11.1 following occlu sion (p < 0.02). Peak hydrogen clearance rate (percent increase above prestimulus clearance) was 81.6 ± 53.6 and fell to 19.9 ± 29.8 after middle cerebral artery occlu sion (p < 0.01). Steady-state NADH fluorescence rose from 33. 5 ± 10.7 to 40.5 ± 17.6% full-scale deflection following MCAO (p < 0.01). Latency from stimulus to maximal fluorescence depression in response to cortical stimulation increased from 12.2 ± 8.2 to 22.1 ± 11.9 s (p
The nature and extent of the cortical ischaemic penumbra associated with acute focal cerebral isch aemia remain unclear. The initial definition was based on the finding of evoked potential amplitude suppression in association with substantial preser vation of extracellular cation homeostasis in ba boons undergoing occlusion of the middle cerebral artery (MeA) (Astrup et aI., 1977). In cats sub jected to MeA occlusion, a combination of flow re duction to 60-70% of control with electroencepha logram (EEG) amplitude reduction and substantial preservation of pial surface potassium activity is demonstrable on the marginal gyrus (syn., antero lateral gyrus) ( Strong et aI., 1983a). Histological studies suggest that the penumbra, as represented on this gyrus in the cat 2 h after onset of ischaemia, comprises a medial area with little if any histolog-
ical abnormality (referred to here as "type 1") and a more lateral zone containing either scattered mul tiple microfoci of ischaemic change affecting all components or restricted neuronal loss in a laminar distribution ( "type 2") ( Strong et aI., 1983b). Hypotheses to explain penumbral functional sup pression in the absence of histological changes may be summarised as those based on (1) early, possibly compartmented, ischaemic metabolic change (for example, impairment of neurotransmitter syn thesis, release, or reuptake) that is insufficient to endanger neuronal viability, and (2) primary sup pression of neuronal activity (diaschisis) resulting from loss of normal input to neurones in the terri tory being studied. Sources of normal input that might be affected directly or indirectly during isch aemia are (1) ipsilateral cortex located within the infarct core, (2) microfoci of ischaemic cell change in the same gyrus, and (3) deep nuclei or diffuse systems with reciprocal connections with both core and penumbra. In the present experiments, we examined blood flow and nicotinamide adenine dinucleotide (NAD) redox potential in the cat MeA occlusion prepara tion. These variables were studied both in the
Received March 25, 1987; accepted August 21, 1987. Address correspondence and reprint requests to Dr. A. 1. Strong at institute of P sychiatry, De Crespigny Park, London, SE5 8AF, U.K. Dr. Venables' present address is Royal Hallamshire Hospital, Sheffield, U.K. Abbreviations used: FSO, full-scale deflection; SO, spreading depression.
79
80
A.
1.
STRONG ET AL.
steady state and following cortical stimulation. Spe cifically, we reasoned that in a territory in which flow and function remain coupled and are sup pressed only by diaschisis following MCA occlu sion, the focal vasodilator effects of cortical stimu lation would "override" those of diaschisis, and flow reactivity to stimulation would be preserved: the N AD couple would not be reduced. Con versely, if mild flow reductions in marginal gyrus in the steady state were to represent early ischaemia, vasoregulatory sites in the microcirculation would be expected to be fully dilated, with flow being de termined by the adequacy of collateral perfusion, and the NAD couple would now be reduced. Under these latter circumstances, little or no flow reac tivity to a stimulus normally associated with hyper aemia would be expected. Spontaneous, transient increases in extracellular (Ke) or pial surface potassium (Kp) are a prominent feature of the penumbra (Branston et aI., 1977; Strong et aI., 1983a). It is likely that such transients are associated with glutamate release into the ex tracellular space (van Harreveld and Fifkova, 1970). Elevations of Ke are associated with hyper aemia (Branston et aI., 1978) and increased glucose utilization (Shinohara et aI., 1979; Nedergaard and Astrup, 1986). A knowledge of vascular reactivity in penumbral zones is therefore important in rela tion to a potential pathogenic effect of glutamate (Simon et aI., 1984), as well as offering an approach to the examination of diaschisis. An increase in hydrogen clearance rate in re sponse to local cortical stimulation was taken as an index of hyperaemia, and a microcomputer routine was evolved to provide a semiquantitative assess ment of transient changes in hydrogen clearance rate and an indication of the dynamic pattern of flow transients. Reduction of the NAD/NADH couple is a recog nised feature of ischaemic metabolism; NAD redox potential was examined in these experiments using a compensated fluorometer that was coupled to the cortical surface with a light guide. Transient de pression of fluorescence, indicating oxidation of the couple, and hence implying "adequate" hyper aemia, has frequently been observed in normal cortex subjected to local stimulation (Rosenthal and J6bsis, 1971). We therefore compared patterns of fluorescence change in response to stimulation of marginal gyrus before and after MCA occlusion. MATERIALS AND METHODS Experimental preparation
Adult mongrel cats, of either sex and in the weight range 2.7-4.4 kg, were used. Anaesthesia was induced J Cereb Blood Flow Metab, Vol. 8, No. I, 1988
by inhalation of 4% halothane. After endotracheal intu bation, neuromuscular paralysis was induced with galla mine triethiodide. Anaesthesia was maintained with a single intravenous dose of chloralose (50 mg/kg), and the cats were ventilated to physiological Paco2 with 60/40 N20/02 and 0.5% halothane, which was increased if mean arterial pressure rose above 135 mm Hg: this was re quired only occasionally. Arterial pressure was moni tored continuously (femoral catheter), and arterial blood gases were checked regularly. Body temperature was maintained by a heated pad servocontrolled by a rectal temperature probe. The right middle cerebral artery was exposed by the transorbital route and occluded by a mi croanastomosis clip where the vessel lies at its closest point to the optic nerve. The right marginal and suprasyl vian gyri were exposed by craniectomy and the dura re moved. After placement of hydrogen clearance elec trodes and the fluorometer probe tip (Fig. I) on the seg ment of marginal gyrus lying between 5 and 15 mm behind the coronal suture, the exposed cortex was cov ered with a pool of warm mineral oil (37°C) , and pool temperature was maintained with an overhead infrared lamp. Measurement and analysis of local cerebral blood flow
CBF was measured by hydrogen clearance using polar ised platinum electrodes of 125 f.Lm diameter implanted in the cortex to a depth of 1-1.5 mm. Prestimulus flows were measured manually by initial slope (IS) analysis over the available prestimulus epoch and by a microcom puter-based procedure in which electrode currents were digitized and sampled at 3-s (control conditions) or 5-s (ischaemia) intervals. tY2 (min) was computed and CBF then calculated for each interval from the equation: CBF (ml 100 g-I min-I)
0.693 =
x
100
tY2 (min)
(I)
Mean prestimulus flow was calculated as the mean of all 3-s flow values, taken over the period from the end of hydrogen recirculation (A in Fig. 2) to the time of stimu lation (S, Fig. 2) . This period averaged 107 ± 37 s (n 21; first available electrode and preocclusion clearance in each experiment). The value of CBF obtained was de=
Fluorometer
4 3
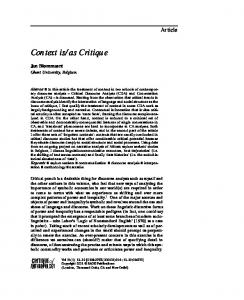
FIG. 1. Diagram illustrating montage of recording electrodes on marginal gyrus. The tip of the light guide was placed in light contact with the centre of the gyrus, approximately 8 mm behind the coronal suture. Two stimulation (S) and 4-5 hydrogen clearance electrodes were arranged circumferen tially around the fluorometer as shown.
81
FLOW AND NAD REACTIVITY IN PENUMBRA Clearance rate
0112-1: min-1)
12 1.0 08 0.6 A .•
� �
percentage change in prestimulus clearance. Transients were analysed retrospectively using a cursor-based, in teractive routine providing for measurement of peak transient clearance rate.
t
NAD redox potential
I
0.2
Time (minutes)
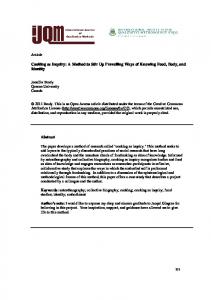
FIG. 2. Example of microcomputer-derived plot of "flow" against time at one electrode during a single clearance of hydrogen. Electrode current was sampled in 3-s intervals, di gitised, and Eq. 1 (see text) solved for each interval. Each value plotted is the mean of the current, previous, and sub sequent values of flow. The gradual decline in calculated value of flow reflects bi- or multicompartmental clearance, and CBFis was calculated as the mean of individual flow values over 2 min from A, or over the maximum available interval between A and S. Cortical stimulation for 5 s was begun at S, and the resulting increase in clearance rate is shown.
noted by the abbreviation CBFis, to distinguish it from the treatment of flow transients described below. Flow transients
Transient increases in blood flow were induced by bi polar cortical stimulation for 5 s (60 Hz, I ms square wave, 20 V through 10 K resistor), with electrodes im planted 8-10 mm apart, with 2-4 hydrogen electrodes interposed so that the electrode system encircled the fluorometer probe (Fig. I). Stimulation was carried out during clearance of hydrogen. beginning when electrode current at one electrode had fallen to 50% of its preclear ance value. This fixed percentage was adopted to secure broadly comparable compartmental weighting at elec trode sites, which, at least before occlusion, usually cleared biexponentially. Unless otherwise stated. data from other electrodes were not used for CBF transient studies unless H2 current was between 45 and 55% of its preclearance value at the time of stimulation. Current at the selected electrode(s) was sampled as above, and the running mean of either 7, 5, or 3 consecutive clearance values was calculated retrospectively and displayed against time (Fig. 2). As steady-state conditions do not obtain following transient stimulation, it is no longer valid to express flow in absolute units of ml 100 g-I min -I. Transient values of flow were expressed only as hydrogen clearance rate and
Cortical NAD redox state was recorded using a com pensated fluorometer (CF-I; Johnson Foundation, Phila delphia. PA, U.S.A.). An excitation wavelength of 366 nm was used. Optical coupling to the cortical surface was by a branched. multiple quartz fibre light guide placed in light contact with the cortical surface (Fig. 1). The tip diameter was 5 mm. Fluorescent and reflected light from the cortex was split and filtered in the proportion 9: 1fluorescence (450 nm):reflectance (366 nm) . Fluores cence and reflectance signals were recorded continuously by photomultipliers. The fluorometer was balanced ac cording to the method of Harbig et al. (1976). Photomul tiplier sensitivities were set to provide, under baseline conditions, signals at approximately 30% of full-scale photomultiplier output. Variations in the quenching of NADH fluorescence by haemoglobin and fluctuations in lamp intensity were compensated by subtraction of the reflectance signal from fluorescence, yielding a corrected fluorescence signal. The gain of the reflectance signal used for subtraction was adjusted until no deviation of the compensated signal was observed during cortical transit of a l-ml saline bolus injected through a lingual artery catheter. The full-scale value of the compensated fluorescence signal was established by complete anoxic reduction of the NAD/NADH pool as follows. Anoxia was induced at the end of experiments by ventilation with 100% N20; a progressive increase toward a relatively stable terminal value was observed, and this value was taken as full scale. Unless otherwise stated, all compen sated fluorescence values given are percentages of this value for full-scale deflection (%FSD). Statistical analysis
Values quoted are means ± 1 SD unless otherwise stated. The tests of significance used are identified in conjunction with the associated results in the text. RESULTS Experimental groups
Data from a total of 2 I experiments are pre sented: occlusion was carried out in 17, with a full protocol of pre- and postoccJusion stimulation in 8 of these experiments. Data are summarized in Table I.
TABLE 1. Cerebral blood flow and reduced nicotinamide adenine dinucleotide fluorescence in the steady state, and their responses to cortical stimulation, hefore and qfter middle cerehral artery occlusion Compensated fluorescence (% full scale deflection) Steady state CBF
Control MCA
(steady state:
clearance tV2
Ectosylvian
ml 100-1 min-I)
(% prestimulus)
gyrus
38.2 ± 12.9(21)
Transient (marginal gyrus)
Decrease in Spontaneous MCA Marginal gyrus
occlusion peak
75.0 ± 43.9(21) 40.1 ± 15.5(4) 33.5 ± 10.7 1(21)
occlusion 19.8 ± 11.1(17)" 19.9 ± 29.8(8Y 80.1 ± 28.2(4) 40.5 ± 17.6(16),
64.3 ± 24.4(15)'
Minimum
% Prestimulus"
Latency (s)
28.3 ± 10.0 (20)
16.8 ± 7.6
12.2 ± 8.2(15)
39.5 ± 17.8(8)
12.1 ± 8.1
22. 1 ± 11.9(9),
Values are means ± I SD. a
Amplitude of depression expressed as % of prestimulus %FSD value.
b p