Crop Protection 109 (2018) 123–127
Contents lists available at ScienceDirect
Crop Protection journal homepage: www.elsevier.com/locate/cropro
Changes in weed community with different types of nitrogen fertilizers during the fallow season
T
Wenhai Mia,b,∗, Qiang Gaoa, Yan Sunc, Haitao Zhaoa, Xin Yangd, Xiaogang Guoe, Jianqiu Chenf,g, Lianghuan Wub,∗∗ a
College of Environmental Science and Engineering, Yangzhou University, Yangzhou, 225127, China Zhejiang Provincial Key Laboratory of Agricultural Resources and Environment, College of Environmental and Resource Sciences, Zhejiang University, Hangzhou, 310058, China c Institute of Water Resources and Hydro-electric Engineering, Xi'an University of Technology, Xi'an, 710054, China d School of Life Science, Shangrao Normal University, Shangrao, 334000, China e College of Chemistry and Chemical Engineering, Yangtze Normal University, Chongqing, 408003, China f Shandong Kingenta Ecological Engineering Group Co., Ltd., Linshu, 276700, China g National Engineering & Technology Research Center for Slow and Controlled Release Fertilizers, Taian, 271018, China b
A R T I C LE I N FO
A B S T R A C T
Keywords: Weed density Dominance Alopecurus japonicus Steud. Post effect of N fertilizers
Manipulation of crop fertilization may be an important part of integrated weed management systems. The objective of this study is to investigate the responses of weed community and composition in the fallow season to the different types of nitrogen fertilization. Six treatments were conducted over four consecutive years, including no N fertilizer (N0), conventional prilled urea (PU), polymer coating of sulfur-coated urea (PSCU), urea with nitrification inhibitor (UNI), urea-formaldehyde (UF), and controlled-release bulk blending N fertilizer (70% full dosage of PSCU plus 30% full dosage of prilled urea, BBF). Weed species composition, dominant species biomass, and soil properties were investigated, and indices of weed species diversity were calculated. The results indicated that Mazus japonicus (Thunb.) Kuntze and Alopecurus japonicus Steud. dominated the N0 treatment, whereas Alopecurus japonicus Steud. dominated all N–fertilized treatments. The PSCU treatment produced the greatest shoot biomass (657 g m−2) of Alopecurus japonicus Steud. The N0 treatment had the highest total weed density (365 plants m−2) and Shannon-Wiener index (1.39). Application of PSCU or UF led to significantly lower Shannon-Wiener and higher Simpson indices than did the PU treatment due to high residue soil N contents. The UNI treatment not only produced the highest 4-year average grain yield of double rice, it also maintained a relatively diverse weed community in the fallow season.
1. Introduction Weeds are an important component in agroecosystems, providing functions such as nutrient cycling and reduction of soil erosion (Altieri, 1999; Marshall et al., 2003). The performance of weed species is affected by several factors, such as the competition from the crop and other weeds on nutrients, fertilizer usage, crop rotation and tillage (Andersson and Milberg, 1996; Lehoczky et al., 2012). Additionally, climatic conditions and soil fertility can have a great influence (Unger et al., 1999; Andreasen and Skovgaard, 2009). Manipulation of fertilization may be an important component of integrated weed management programs (Lehoczky et al., 2015). Fertilization alters soil nutrient levels, thus affecting species composition and weed biomass (Yin et al.,
∗
2006). For example, Tang et al. (2014) reported that the PK treatment resulted in greater weed density and higher Shannon-Wiener index of weed diversity than did the NP and balanced fertilization (NPK) treatments in a 17-year field trial with a winter wheat-soybean rotation. Nitrogen is a major nutrient for plant growth. In addition, it is considered a dormancy breaker for certain weed species, and thus it may affect weed germination and establishment (Agenbag and Villiers, 1989; Blackshaw et al., 2005). Many studies have reported that weed diversity was influenced by N application methods and rate. Blackshaw et al. (2002) reported that surface broadcast N resulted in greater weed biomass than application in the surface pools or point-injected N in spring wheat. Andersson and Milberg (1996) found that an increase in N input did not cause an increase in total weed biomass, although weed
Corresponding author. Corresponding author. E-mail addresses:
[email protected] (W. Mi), fi
[email protected] (L. Wu).
∗∗
https://doi.org/10.1016/j.cropro.2018.01.014 Received 9 June 2017; Received in revised form 20 December 2017; Accepted 16 January 2018 0261-2194/ © 2018 Elsevier Ltd. All rights reserved.
Crop Protection 109 (2018) 123–127
W. Mi et al.
Seedlings were transplanted in late-April for early rice and late-July for late rice every year. The fields remained fallow between the harvest and next planting. Weeds were removed manually at booting stage once per season, and no herbicide was applied during 2011–2014.
species were strongly affected by N application rate. Today, new types of N fertilizers such as controlled release urea (CRU) or urea with nitrification inhibitor (UNI), have been widely used by farmers in southern China because of more convenient field operation. However, the effectiveness of CRU was strongly affected by environmental conditions, such as soil temperature and moisture (Grant et al., 2012). Therefore, the content of soil nitrate (NO3−–N) and ammonium (NH4+–N) could change in the fallow season because of delayed release of N from the CRU. Many researchers have reported on the effects of nitrogen on weed communities, however, mainly focused on crop–weed competitive interactions during the cropping period (Andersson and Milberg, 1996; Blackshaw et al., 2002, 2004). To our knowledge, information regarding changes in weed community responses to different types of N fertilizers in the fallow season is limited. The weed community during the fallow season provides a number of resources for insect species and birds. Therefore, it plays an important role in the biological diversity of agroecosystems (Tang et al., 2014). The goal of this study was to determine weed species composition and weed species abundance caused by different types of N fertilizers. By using redundancy analysis (RDA), we sought to illustrate how weed species were related to each other and to various soil properties in the fallow season. Additionally, greater knowledge of different types of N fertilizer on weed communities could aid in the development of N fertilizer management for the maintenance of a stable agroecosystem.
2.3. Sampling and analysis All soil samples were collected from the 0–10 cm layer in each plot on April 2, 2015. The samples were transported to the laboratory within 24 h after sampling. One portion was sieved moist (< 2 mm) then kept at 4 °C for NH4+ and NO3−analysis. The other portion was air-dried and kept at room temperature to analyze soil organic matter (SOM), total N (TN), alkali-hydrolyzable N (AN), P, K, S, and pH (Lu, 2000). SOM was determined using K2Cr2O7-H2SO4 oxidation. Total N was measured using the Kjeldahl method. Alkali-hydrolyzable N was released and transformed to NH3 using 1 M NaOH and FeSO4 powder at 40 °C for 24 h, and then absorbed with a 2% (w/v) H3BO3 solution and titrated with a 0.005 M H2SO4 solution. Available P in the soil was measured using the ammonium fluoride extraction method. Soil exchangeable K+ was extracted using 1 M NH4OAc and analyzed using flame photometry. Soil pH (H2O) was measured in 1: 2.5 soil to water suspensions. The soil NH4+-N and NO3−-N were extracted by 2 M KCl using a 1:5 soil to solution concentration (Pansu and Gautheyrou, 2006). Five representative hills of rice plants were collected in late-July for early rice and early-November for late rice. All plant samples were oven dried at 70 °C for 48 h to a constant weight and weighed. The total biomass of rice was estimated. Grain yield was determined by harvesting the whole plot, and then adjusted the harvest by the standard 14% moisture content. The N cumulative release rates of PSCU were determined by a weight loss method (Wilson et al., 2009). Thirty mesh bags (15 cm × 10 cm) with 10 g PSCU were buried in the field. Three bags were randomly collected at 10, 22, 33, 47, 54, 65, 75, 85, 101, and 111 days after transplanting in 2014. The weed community was investigated by means of three 0.5 × 0.5 m2 quadrats randomly distributed in each plot on April 2, 2015. All weeds in the quadrat were clipped, sorted by species, counted, and oven dried at 75 °C for 72 h before weighing (Yin et al., 2005).
2. Materials and methods 2.1. Site description The experiment was located at Xinzhu Country (29°01′N, 119°27′E), Zhejiang Province, China. This region has a middle subtropical monsoon climate with annual precipitation of 1424 mm and an annual mean temperature of 17.5 °C. The soil type is yellow clayey paddy soil, with initial properties of 26.2 g kg−1 organic matter, 1.96 g kg−1 total nitrogen, 4.43 mg kg−1 available P, 79 mg kg−1 available K, and pH (H2O) 5.24. 2.2. Experimental design This experiment trial was set up in April 2011 in a double rice cropping system. Six treatments with three replicates were established: (1) no nitrogen (N0), (2) prilled urea (PU, N 46%), (3) polymer coating of sulfur-coated urea (PSCU, N 34%, made by Kingenta Ecological Engineering Group Co., Ltd., Shandong, China), (4) urea with nitrification inhibitor (2-chloro-6-trichloromethyl-pyridin, 0.25%) (UNI, N 46%, made by Zhejiang Aofutuo Chemical Co., Ltd., China), (5) ureaformaldehyde (UF, N 28%) and (6) controlled-release bulk blended N fertilizer (BBF, 70% full dosage of PSCU plus 30% full dosage of PU, N 37.6%). The fertilization treatments were assigned in the same experimental plots in the continuous four studying years. P and K were used in the form of calcium superphosphate and potassium chloride, respectively, with equal amounts in all treatments. At the start of each season, the P and K fertilizers were applied as basal fertilizer at the rate of 90 kg P ha−1 and 120 kg K ha−1, respectively. All N–fertilized treatments received the same amount, 180 kg N ha−1, per season. In treatments 3–6, N fertilizer was used as a single basal application. For the PU treatment, the ratio of nitrogen application was 40%: 30%: 30% (basal: tillering: booting) in the early rice and 40%: 60% (basal: tillering) in the late rice season. The experiment was a completely randomized design. The plots were 12.5 m2 (5 m × 2.5 m) and isolated by ridges and plastic film covering. The rice cultivar was ‘Jinzao 09’ in the early season and ‘Yueyou 9113’ in the late season. Pregerminated seeds were sown in a seeding field. The specific seeding dates were in late-March for early rice and early-July for late rice every year. The seeding rates were 36 kg ha−1 for early rice and 12 kg ha−1 for late rice, respectively.
2.4. Statistical analysis Data analysis was performed with STATISTICA 5.5 program. Analysis of variance (ANOVA) with Duncan's multiple range test was performed for soil organic matter, soil nutrients, soil pH, weed abundance, shoot biomass of dominant species, and rice grain yield with a probability level of 0.05. To assess weed diversity of each treatment, four diversity indices were used (Magurran, 1988). The Shannon-Wiener diversity index (H′), Pielou index (E), Margalef (DMG), and Simpson index (DS) were calculated using the following equations:
H ′ = (N ln N − n ln n)/ N E = H ′/(ln S)
DMG = (S − 1)/(ln N)
Ds =
∑ (n/N )(n/N )
Where N is the total number of individuals in each plot, n is the number of individual per species present in each plot and S is the number of species in each plot. Redundancy analysis (RDA) was performed to investigate weed communities and environmental variables. The vector length represented the degree of correlation between soil properties and weed species. The vector direction indicated the trend of variable. Weed density data were loge(x+1) transformed prior to analysis. 124
Crop Protection 109 (2018) 123–127
W. Mi et al.
Table 1 Soil nutrients and pH under different treatments after four years of cropping. Treatment
Organic matter g kg−1
Total N g kg−1
alkali-hydrolyzable N mg kg−1
Available P mg kg−1
Available K mg kg−1
Available S mg kg−1
NH4+-N mg kg−1
NO3−N mg kg−1
pH
N0 PU PSCU UNI UF BBF F value
33.3 a 31.9 a 33.3 a 34.2 a 33.5 a 34.9 a 0.43ns
1.90 a 1.97 a 1.96 a 1.98 a 2.02 a 1.99 a 0.37ns
111.8 b 112.9 ab 129.7 a 115.9 ab 115.5 ab 128.0 ab 2.45ns
25.4 a 16.3 bc 18.0 b 15.8 bc 13.2 c 14.9 bc 20.04*
78.5 a 29.9 b 22.8 b 25.5 b 23.8 b 21.2 b 36.95*
63.4 b 62.4 b 104.7 a 62.6 b 61.9 b 106.3 a 12.57*
15.2 b 15.2 b 22.1 a 16.1 b 17.8 b 21.9 a 12.74*
0.8 c 1.0 bc 1.2 ab 0.8 c 1.4 a 1.3 a 9.60*
6.09 ab 5.88 b 5.55 c 6.26 a 6.32 a 5.82 bc 9.78*
Within a column, means followed by the same letter are not significantly different at P < .05. * indicate significance at P = .001, ns indicates not significant.
3. Results 3.1. Soil organic matter, nutrients, and pH The contents of soil available P and K were the highest for the N0 treatment, which increased by 41%–92% and 162%–271% relative to the N–fertilized treatments, respectively (Table 1). The PSCU and BBF treatments resulted in significantly higher concentrations of soil available S and NH4+–N than in the other treatments. However, a lower pH was recorded in the PSCU treatments. No differences in total nitrogen and soil organic matter were observed among the treatments (Table 1). 3.2. Rice grain yield The N–fertilized treatments produced significantly higher rice grain yields than did the N0 treatment during 2011–2014, which increased by 78%–104% for early rice and 56%–73% for late rice in 2011, 100%–127% for early rice and 28%–43% for late rice in 2012, 131%–160% for early rice and 52%–75% for late rice in 2013, 179%–212% for early rice and 54%–68% for late rice in 2014, respectively (Table 2). Among the N–fertilized treatments, the UNI treatment produced the highest grain yield of early rice during 2012–2014, which was respectively greater 0.5%–14% in 2012, 3%–12% in 2013, and 5%–12% in 2014 than that in the other four Nfertilized treatments (Table 2). For late rice, grain yield for UNI were the highest (9.3 Mg ha−1) in 2013, and was significantly higher by 11%, 15%, 10% and 6% than that in the PU, PSCU, UF, and BBF treatments, respectively (Table 2).
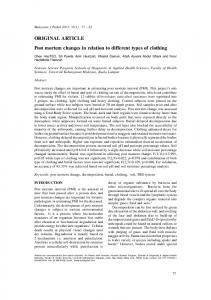
Fig. 1. Effects of different fertilization patterns on average weed densities. Vertical bar indicates the standard error of the mean. ALOJA, Alopecurus japonicus Steud.; MAZJA, Mazus japonicus (Thunb.) Kuntze; STEPU, Stellaria pusilla E. Schmid. N0 means no N fertilized; PU means conventional prilled urea; PSCU means polymer coating of sulfur coated urea; UNI means urea with nitrification inhibitor; UF means urea-formaldehyde; BBF means controlled-release bulk blended N fertilizer. * indicate significance at P = .01.
3.4. Weed community The weed species number was significantly influenced by fertilization (p = .009). Seven weed species were recorded in the field, including Alopecurus japonicus Steud., Cardamine hirsuta L., Mazus japonicus (Thunb.) Kuntze, Gnaphalium affine D. Don, and Stellaria pusilla E. Schmid, Poa annua L., and Hydrocotyle sibthorpioides Lamarck. The highest number of weed species was recorded in the N0 treatment, followed by the N-fertilized treatment (Table 3). All weed species were annual except for the Hydrocotyle sibthorpioides Lamarck. Alopecurus japonicus Steud. and Poa annua L. were monocotyledon, and the rest were dicotyledon. Alopecurus japonicus Steud., Mazus japonicus (Thunb.) Kuntze, and Stellaria pusilla E. Schmid were the most dominant species, which comprised more than 88% of the total weed density. Mazus japonicus (Thunb.) Kuntze and Alopecurus japonicus Steud. dominated the N0 treatment. Alopecurus japonicus Steud. dominated all N–fertilized treatments (Table 3). The abundances of Alopecurus japonicus Steud. under PSCU and BBF treatments were over 75%, whereas its lowest abundance was in the N0 treatment. Additionally, PSCU and BBF treatments promoted the growth of Alopecurus japonicus Steud. (657 and 516 g m−2), which were significant greater being 2.6 and 1.8, 1.6 and 1.0, 1.3 and 0.8, and 1.3 and 0.8 times higher than that of N0, PU, UNI and UF treatments respectively (Fig. 2). In contrast, the abundance of Mazus japonicus (Thunb.) Kuntze was the highest (42%) in the N0 treatment, followed by the PU treatment (21%). The PSCU treatment had the lowest (9%) abundance of Mazus japonicus (Thunb.) Kuntze (Table 3). Additionally, shoot biomass of Mazus japonicus (Thunb.)
3.3. Weed density Total weed density was significantly affected by fertilization (p = .009) (Fig. 1). The highest total weed density (365 plants m−2) was observed in the N0 treatment, which was significantly greater between 47% and 73% higher than that of PU, PSCU, UNI, and BBF treatments (Fig. 1). No difference in total weed density was recorded between all the N–fertilized treatments (Fig. 1). Table 2 Rice grain yields (Mg ha−1) under different treatments (2011–2014). Treatment
N0 PU PSCU UNI UF BBF F value
Early Rice
Late Rice
2011
2012
2013
2014
2011
2012
2013
2014
3.6d 6.7bc 6.4c 7.3a 7.4a 6.8b 288.7*
2.7c 5.4b 5.5b 6.1a 5.4b 6.1a 56.9*
2.7d 6.8ab 6.2c 7.0a 6.5bc 6.7ab 215.7*
2.2c 6.0b 6.2ab 6.8a 6.5ab 6.2ab 92.6*
5.3d 8.3c 8.5b 9.1a 8.3c 9.2a 368.4*
6.4c 8.2b 9.0a 9.0a 8.4b 9.2a 39.8*
5.3d 8.4c 8.1c 9.3a 8.4bc 8.8b 140.5*
5.4c 8.4a 9.1a 8.7ab 9.1a 8.8ab 45.7*
Within a column, means followed by the same letter are not significantly different at P < .05. * indicate significance at P = .001. 125
Crop Protection 109 (2018) 123–127
W. Mi et al.
Table 3 Weed species abundance (%) under different treatments. Weed species
Weed abundance (%)
Alopecurus japonicus Steud. Cardamine hirsuta L. Mazus japonicus (Thunb.) Kuntze Gnaphalium affine D.Don Stellaria pusilla E. Schmid Poa annua L. Hydrocotyle sibthorpioides Lamarck F value
F value
N0
PU
PSCU
UNI
UF
BBF
32.4eB 2.26bC 42.0aA 9.1aC 5.6cC 8.2aC 0.5C 27.6**
51.7dA 8.5aCD 21.3bB 3.7bDE 12.1bC 2.9bE – 121.4**
85.5aA 0.6bC 9.1cB 0.5bC 3.6cC 0.7bC – 724.4**
60.6cdA 2.6bD 12.5bcC 2.2bD 19.5aB 2.6bD – 161.0**
68.8bcA 10.9aB 10.9cB – 6.6cBC 2.9abC – 252.4**
76.6abA 2.0bC 12.9bcB 1.1bC 5.6cC 1.7bC – 166.6**
33.8** 16.2** 15.9** 10.0** 11.6** 7.4* –
Within a row, means followed by the same lower case letters are not significantly different at P < .05. Within a column, means followed by the same upper case letters are not significantly different at P < .05. * and ** indicate significance at P = .01 and .001, respectively.
Fig. 2. Effects of different fertilization patterns on biomass of Alopecurus japonicus Steud. and Mazus japonicus (Thunb.) Kuntze. N0 means no N fertilized; PU means conventional prilled urea; PSCU means polymer coating of sulfur coated urea; UNI means urea with nitrification inhibitor; UF means urea-formaldehyde; BBF means controlled-release bulk blended N fertilizer.
Kuntze in the N0 treatment was 107 g m−2, and was 2.7–11.3 times greater than that in the N–fertilized treatments (Fig. 2). The species diversity and evenness varied with the fertilization treatments (Table 4). The highest Shannon's diversity index (H′) (1.39) and the lowest Simpson index (DS) (0.31) were observed in the N0 treatment. The PSCU and BBF treatments resulted in lower Shannon's diversity index (H′), Pielou index (E), while higher Simpson index (DS) than did the N0, PU, and UNI treatments. When an overall analysis of community compositional differences using RDA was conducted, weed communities under different treatments were found to be distinctly separated (Fig. 3). The RDA ordination diagram indicated some significant associations (Fig. 3). In particular, Alopecurus japonicus Steud. was associated with the PSCU and BBF treatments, Mazus japonicus (Thunb.) Kuntze, Gnaphalium affine D.
Fig. 3. RDA ordination diagram of weed species and soil parameters under different treatments. N0 means no N fertilized; PU means conventional prilled urea; PSCU means polymer coating of sulfur coated urea; UNI means urea with nitrification inhibitor; UF means urea-formaldehyde; BBF means controlledrelease bulk blended N fertilizer. TN means soil total nitrogen; AN means alkalihydrolyzable nitrogen. a, Alopecurus japonicus Steud.; b, Cardamine hirsuta L.; c, Mazus japonicus (Thunb.) Kuntze; d, Gnaphalium affine D. Don; e, Stellaria pusilla E. Schmid; f, Poa annua L.; g, Hydrocotyle sibthorpioides Lamarck.
Don and Hydrocotyle sibthorpioides Lamarck with N0 treatment, Stellaria pusilla E. Schmid with the PU treatment. Additionally, NH4+-N, and alkali-hydrolyzable N and S were associated with PSCU and BBF treatments, and available K was associated with the N0 treatment. 4. Discussion
Table 4 Biodiversity indices of weed community under different treatments. Index
N0
PU
PSCU
UNI
UF
BBF
F value
Shannon-Wiener diversity index Margalef Pielou index Simpson index
1.39a
1.34ab
0.54e
1.14bc
1.01cd
0.79d
24.3**
0.91a 0.75a 0.31d
0.91a 0.75a 0.34d
0.65b 0.36c 0.74a
0.90a 0.64ab 0.43cd
0.75ab 0.63ab 0.51bc
0.74ab 0.5bc 0.61b
2.7ns 8.0* 15.4**
Soil alkali-hydrolyzable N, P, and K changed significantly among different fertilization treatments. This was probably attributed to the variation of total biomass production in each treatment, thus significant differences in nutrients output occurred among treatments. The N0 treatment had greater weed species and weed density than the other five balanced fertilization treatments. Nie et al. (2009) also found a similar result in the reddish paddy soil after 26-years of different fertilization patterns. However, Banks et al. (1976) found that the highest total weed density was observed in the plots that received N, P, and K. This inconsistent result was likely caused by variation in regional weed
Within a row, means followed by the same letter are not significantly different at P < .05. * and ** indicate significance at P = .01 and .001, respectively; NS indicates not significant. 126
Crop Protection 109 (2018) 123–127
W. Mi et al.
5. Conclusions Alopecurus japonicus Steud. was the dominant weed in the plots receiving N fertilizer, whereas Mazus japonicus (Thunb.) Kuntze and Alopecurus japonicus Steud. predominated under N0 treatment. N was an important factor to stimulate germination and biomass production of Alopecurus japonicus Steud. PSCU application caused a sharp decline in Shannon-Wiener index. Application of urea with nitrification inhibitor not only gained desirable rice grain yield, but also maintained a more diverse weed community in the fallow season. Acknowledgements This research was financed by the special fund for National Key Research and Development Program (2016YFD0200102), Special Fund for the National Basic Research Program of China (2015CB150502), and Project of Science and Technology Cooperation of Zhejiang Province, China (2015). Fig. 4. N release pattern from PSCU of late rice under field condition in 2014.
References
species composition (Yin et al., 2006), mean rainfall, temperature (Tang et al., 2014), and water availability (Ochoa-Hueso and Manrique, 2010). The weed community structure varied substantially between N0 and N–added treatments. The first canonical variable explained 71% of the total variance, and was highly correlated with soil N-related properties (e.g. alkali-hydrolyzable N, NH4+, and NO3−). Alopecurus japonicus Steud. was the most dominant weed in the plots receiving N fertilizer, whereas Mazus japonicus (Thunb.) Kuntze and Alopecurus japonicus Steud. predominated under N0 treatment. The growth of Alopecurus japonicus Steud. might be more responsive to N and exhibited greater biomass with increased soil alkali-hydrolyzable N and NH4+ content, and thus was more competitive than the other weed species. In contrast, abundance and shoot biomass of Mazus japonicus (Thunb.) Kuntze declined to different extents in the plots receiving N, indicating that use of N fertilizer altered the pattern of weed distribution. A test for cumulative N release from PSCU indicated that nearly 10% of total N was released after the late-season rice harvest (Fig. 4), causing higher soil N levels in both treatments containing PSCU. The increased soil N levels resulted in higher abundance and biomass of Alopecurus japonicus Steud. in the PSCU and BBF treatments than in the other N–fertilized treatments. Similarly, Moss et al. (2004) showed that inorganic N levels affected the weed community composition in a longterm experiment at Rothamsted initiated in 1843. However, some researchers found that other soil nutrients influenced the weed community composition more than N. For example, Yin et al. (2006) and Tang et al. (2014) reported that soil available P was the most important factor determining weed community composition. The N0 treatment had the highest Shannon-Wiener index, followed by the PU treatment. The treatments receiving different new types of N fertilizers resulted in significantly reductions in the values of ShannonWiener index, except for the UNI treatment. This result indicated that higher residue N existed in the plots receiving controlled or slow release fertilizers, and this improved the growth of highly N-responsive weed species. Conversely, the competitiveness of other weed species declined. In contrast to PSCU or UF, a relatively smaller decline in the Shannon-Wiener index was observed in the UNI treatment than in the N0 treatment, indicating urea with nitrification inhibitor sustained relatively stable weed community biodiversity. Tilman et al. (1996) reported that biodiversity promotes ecosystem stability, sustainability, and productivity. It can be an important element for the sustainable and reliable provision of agroecosystem serves. Therefore, application of urea with nitrification inhibitor could not only provide desirable crop productivity but also maintained a relatively stable agroecosystem.
Agenbag, G.A., Villiers, O.T., 1989. The effect of nitrogen fertilizers on the germination and seedling emergence of wild oat (A. fatua L.) seed in different soil types. Weed Res. 29 (4), 239–245. Altieri, M.A., 1999. The ecological role of biodiversity in agroecosystems. Agric. Ecosyst. Environ. 74, 19–31. Andersson, T.N., Milberg, P., 1996. Weed performance in crop rotations with and without leys and at different nitrogen levels. Ann. Appl. Biol. 128, 505–518. Andreasen, C., Skovgaard, I.M., 2009. Crop and soil factors of importance for the distribution of plant species on arable fields in Denmark. Agric. Ecosyst. Environ. 133, 61–67. Banks, P.A., Santelmann, P.W., Tucker, B.B., 1976. Influence of long-term soil fertility treatments on weed species in winter wheat. Agron. J. 68, 825–827. Blackshaw, R.E., Molnar, L.J., Janzen, H.H., 2004. Nitrogen fertilizer timing and application method affect weed growth and competition with spring wheat. Weed Sci. 52, 614–622. Blackshaw, R.E., Molnar, L.J., Larney, F.J., 2005. Fertilizer, manure and compost effects on weed growth and competition with winter wheat in western Canada. Crop Protect. 24, 971–980. Blackshaw, R.E., Semach, G., Janzen, H.H., 2002. Fertilizer application method affects nitrogen uptake in weeds and wheat. Weed Sci. 50 (5), 634–641. Grant, C.A., Wu, R., Selles, F., Harker, K.N., Clayton, G.W., Bittman, S., Zebarth, B.J., Lupwayi, N.Z., 2012. Crop yield and nitrogen concentration with controlled release urea and split applications of nitrogen as compared to non-coated urea applied at seeding. Field Crop. Res. 127, 170–180. Lehoczky, É., Gólya, G., Tamás, J., Németh, T., 2015. Biodiversity and biomass production of weeds in a long-term fertilization experiment. Commun. Soil Sci. Plant Anal. 46 (1), 390–398. Lehoczky, É., Kismányoky, A., Lencse, T., Németh, T., 2012. Effect of different fertilization methods and nitrogen doses on the weediness of winter wheat. Commun. Soil Sci. Plant Anal. 43 (1–2), 341–345. Lu, R.K., 2000. Method of Soil Science and Agricultural Chemical Analysis. China Agricultural Science and Technology Press, Beijing. Magurran, A.E., 1988. Ecological Diversity and its Measurements. Princeton University Press, Princeton, USA. Marshall, E.J.P., Brown, V.K., Boatman, N.D., Lutman, P.J.W., Squire, G.R., Ward, L.K., 2003. The role of weeds in supporting biological diversity within crop fields. Weed Res. 43 (2), 77–89. Moss, S.R., Storkey, J., Cussans, J.W., Sam, P., Hewitt, M.V., 2004. The broadbalk longterm experiment at Rothamsted: what has it told us about weeds? Weed Sci. 52, 864–873. Nie, J., Yin, L.C., Liao, Y.L., Zheng, S.X., Xie, J., 2009. Weed community composition after 26 years of fertilization of late rice. Weed Sci. 57, 256–260. Ochoa-Hueso, R., Manrique, E., 2010. Nitrogen fertilization and water supply affect germination and plant establishment of the soil seed bank present in a semi-arid Mediterranean scrubland. Plant Ecol. 210 (2), 263–273. Pansu, M., Gautheyrou, J., 2006. Handbook of Soil Analysis-Mineralogical. Organic and Inorganic Methods. Springer-Verlag, Heidelberg. Tang, L.L., Cheng, C.P., Wan, K.Y., Li, R.H., Wang, D.Z., Tao, Y., Pan, J.F., Xie, J., Chen, F., 2014. Impact of fertilizing pattern on the biodiversity of a weed community and wheat growth. PLoS One 9 (1), e84370. Tilman, D., Wedin, D., Knops, J., 1996. Productivity and sustainability influenced by biodiversity in grassland ecosystems. Nature 379 (2), 718–720. Unger, P.W., Miller, S.D., Jones, O.R., 1999. Weed seeds in long-term dryland tillage and cropping system plots. Weed Res. 39, 213–223. Wilson, M.L., Rosen, C.J., Moncrief, J.F., 2009. A comparison of techniques for determining nitrogen release from polymer-coated urea in the field. Hortscience 44 (2), 492–494. Yin, L.C., Cai, Z.C., Zhong, W.H., 2005. Changes in weed composition of winter wheat crops due to long-term fertilization. Agric. Ecosyst. Environ. 107, 181–186. Yin, L.C., Cai, Z.C., Zhong, W.H., 2006. Changes in weed community diversity of maize crops due to long-term fertilization. Crop Protect. 25, 910–914.
127