analysis of the surface drag (Jacobs and Schols, 1986) or by using the universal functions ..... The climate of an orange orchard: Physical characteristics and.
Agricultural and Forest Meteorology, 42 (1988) 53-62 Elsevier Science Publishers B.V., Amsterdam
53
Printed in The Netherlands
CHANGES OF THE DISPLACEMENT HEIGHT AND ROUGHNESS LENGTH OF MAIZE DURING A GROWING SEASON
ADRIE F.G. JACOBS and JOHN H. VAN BOXEL
Agricultural University, Department of Physics and Meteorology, Wageningen (The Netherlands) (Received 5 January 1987; accepted for publication 28 May 1987)
ABSTRACT Jacobs, A.F.G. and van Boxel, J.H., 1988. Changes of the displacement height and roughness length of maize during a growing season. Agric. For. Meteorol., 42: 53-62. Variations in the displacement height (d) and roughness length (z0) of a maize crop were investigated through a growing season. A programme of measurement from which the wind profile, the Richardson gradient number and the turbulent fluxes of heat and momentum were estimated, was carried out. Two techniques were combined to obtain unique values for d and z0: the log-profile fitting technique and the eddy correlation technique. Throughout the growing season, the displacement height appeared to correlate very well (r = 0.98) with the height (H) of the canopy. A mean value for d/H was 0.75. The roughness length was strongly correlated with the difference between the canopy height and the displacement height. A mean value of 0.26 for zo/(H - d) was found (r - 0.86). If the ratio d/H was fixed, the roughness length did not show any clear dependence on wind speed or thermal stability.
INTRODUCTION
Under thermally neutral conditions, steady-state flow over horizontally homogeneous terrain can be described by the well known log-profile (e.g., Monin and Yaglom, 1973): u(z)
=
u * / k ln((z - d ) / z o )
(1)
Here, u* is the friction velocity which, physically, represents the shear stress = p u .2, where p = density and k is von Karman's constant, taken to be 0.41 (Wieringa, 1980; HSgstrSm, 1985). The parameter z0 characterizes the aerodynamic roughness of the underlying surface and d is the displacement height - - the mean height in the vegetation on which the bulk aerodynamic drag acts (Thom, 1971; Shaw and Pereira, 1982). For adiabatic atmosphere, eq. I must be modified to account for the thermal stratification, and becomes: u(z)
=
(u*/k) ln((z - d)/zo) -
~h(S)
(2)
(Monin and Yaglom, 1973) where ~h(S) is the stratification term and S a
0168-1923/88/$03.50
((~ 1988 Elsevier Science Publishers B.V.
54 stability parameter such as the gradient Richardson n'amber, Ri, or the Monin Obukhov parameter, S = (z d)/L, in which L is the Obukhov length scale. The shape of the function ~(S) must be determined experimentally. For the present study, we have adopted an interpolation formula given by Wieringa (1980). The parameters u*, z0 and d are usually found by fitting the log-profile by a least-squares technique (Robinson, 1962; Covey, 1963; Stearns, 1970). However, there are various other methods to estimate these parameters, for example by analysis of the surface drag (Jacobs and Schols, 1986) or by using the universal functions from the Monin Obukhov similarity theory (Panofsky, 1984). As shown by Legg and Long (1975) and confirmed by others (e.g., Maki, 1975), z0 and d are strongly correlated. This means that we cannot obtain a unique mathematical solution for both parameters and indicates that a physically based relationship exists between them. Although several interpretations of this relationship have been suggested (e.g., Seginer, 1974), its nature is still unclear. This is why, in so many practical cases (e.g., Legg and Long, 1975), the log-profile is fitted to wind speed measurements, assuming a fixed d/H ratio (where H is the height of the vegetation) and u* and z0 estimated from the profile data. The main objective of this study was to estimate the changes in the parameters z0 and d for a crop during a growing season. To do this, a continuous measuring programme was carried out above a maize crop. The experiment started in May 1985 (bare soil condition) and lasted until harvest in the middle of October. EXPERIMENTAL LAY-OUTAND MEASUREMENTS Experiments were carried out at the pilot farm Sinderhoeve in the centre of The Netherlands. The crop consisted of forage maize (Zea mays L., Vivia) and was planted in rows 0.75 m apart with plants 0.11 m apart in the row (12 plants m 2). The experimental site had a size of ~ 200 × 150m and was surrounded by other agricultural fields on which mainly maize or wheat were planted. In the centre of the site, the mean wind field was measured at 15 levels above the ground: 0.25, 0.50, 0.75, 1, 1.5, 2, 2.5, 3, 3.5, 4, 5, 6, 7, 8 and 10m. Measurements were made at all levels throughout the season. For the analysis, however, only the levels above the height of the inertial sub-layer, z*, (Tennekes, 1982; Raupach and Thom, 1981) were used, z* being taken as z* - d + 10 z0. Wind profile data within the inertial sub-layer induce an underestimation of the real z0 value (De Bruin and Moore, 1984). That is why the measurement data below z* were discarded in the analysis of z0 and d. However, at the start of the analysis, z* was unknown and had to be estimated via an iterative procedure. At a distance of ~ 125 m south of the instruments, a wheat field was located. During southerly wind conditions (between 140 and 220°), the unprocessed profiles showed a clear kink, due to the effect of changes in terrain conditions. Then, the data above the kink were discarded as well.
55
Small cup a n e m o m e t e r s with a s t a r t i n g speed of ~ 0.20 m s 1 and a first-order response l e n g t h of 0.9 m were used for these m e a s u r e m e n t s . The cup r o t a t i o n was m e a s u r e d with a p h o t o - c h o p p e r system. T h e a n e m o m e t e r s were m o u n t e d on r e c t a n g u l a r booms, fitted on a t r i a n g u l a r mast with sides of 0.18m. The booms had a l e n g t h of 1 m in o r d e r to avoid mast i n t e r f e r e n c e s (Smedman and H6gstr6m, 1973). Wind d i r e c t i o n s in a sector 60 ° u p w i n d of the mast were discarded for f u r t h e r analysis. Dry and wet bulb t e m p e r a t u r e s were m e a s u r e d t h r o u g h the season at two levels with a c o n s t a n t v e r t i c a l spacing of 0.75m. A s p i r a t e d Pt-100 r e s i s t a n c e elements with an a c c u r a c y of ~ 0 . 0 5 K were used. The m e a n h e i g h t of the sensors was d e p e n d e n t on the h e i g h t of the crop and adjusted above the i n e r t i a l sub-layer, z*, in o r d e r to avoid influences caused by individual r o u g h n e s s elements ( G a r r a t t , 1978). In M a y (bare soil condition), the m e a n m e a s u r i n g h e i g h t was I m and in O c t o b e r ( h a r v e s t condition), this h e i g h t was 3.5 m. At the same location, a K a y o Denki sonic a n e m o m e t e r / t h e r m o m e t e r was erected at a fixed h e i g h t of 6 m; the sonic type DAT 310 and sensor type TR-61C was used. In order to avoid sensor i n t e r f e r e n c e s due to the sensor frame, the sensor was adjusted c o r r e c t l y in the m e a n wind d i r e c t i o n as well as possible e a c h day. To avoid tilt e r r o r s ( R a y m e n t and Readings, 1971), the sonic sensor was provided with a levelling device with an a c c u r a c y of 0.5 °. With the sonic a n e m o m e t e r / t h e r m o m e t e r , the s h e a r stress, ~ = p u ' w ' , the h e a t flux, p c ~ w ' T ' , m e a n wind speed, u (6 m), and wind direction, were measured. Here, u, v, w, and T are the h o r i z o n t a l and v e r t i c a l wind c o m p o n e n t and t e m p e r a t u r e , respectively, and primes d e n o t e fluctuations. The i n s t r u m e n t signals were c a r r i e d to a v a n ~ 100 m from the instruments. The d a t a were r e d u c e d by a PDP-11/03 c o m p u t e r to 30-min a v e r a g e s and the results stored on cassette tape (TU-58) for f u r t h e r analysis. R a i n y days and low wind speed conditions (u(10 m) < 2 m s 1) were discarded from f u r t h e r analysis because these c o n d i t i o n s induced u n r e l i a b l e sensor b e h a v i o u r . ANALYTICAL PROCEDURE
In the first place, z0 and d were e s t i m a t e d by fitting the m e a n wind profile d a t a to the log-profile using the classical least-squares t e c h n i q u e (Robinson, 1962). In this case, the m e a n wind profile d a t a were c o r r e c t e d for stability effects by e s t i m a t i n g the R i c h a r d s o n g r a d i e n t number. This t e c h n i q u e was applied to the 30-min a v e r a g e s and yielded a set of z0 and d d a t a w h i c h showed a close c o r r e l a t i o n per day. The r a n g e of the o b t a i n e d z0 and d values is s t r o n g l y d e p e n d e n t on the sum of e r r o r squares b e t w e e n the observed wind speeds and those c a l c u l a t e d from eq. 2 (Stearns, 1970). Next, the l i n e a r r e g r e s s i o n line b e t w e e n these points was e s t i m a t e d by a least-squares t e c h n i q u e , or in o t h e r words, the profile-fitting t e c h n i q u e yielded a r e l a t i o n s h i p b e t w e e n z0 and d each day. W i t h the profile-fitting t e c h n i q u e , the best m a t h e m a t i c a l fit is found b e t w e e n
56
the variables u*, d and z0. Mathematically, these variables are interrelated and are found by an iterative procedure. Hence, there is no guarantee of finding the best physical solution by applying this technique. In particular, there exists a problem in determining d from measured wind profiles, since d depends primarily on the second derivative of the wind speed with respect to height (the curvature of the profile) and thus is very sensitive to experimental errors (Shaw and Pereira, 1982). In the second place, a relationship between z0 and d can be estimated by applying the eddy correlation technique. Here, the fluxes of momentum and heat were estimated from the sonic aneomometer/thermometer measurements. With these data, the friction velocity u* = ( - u ' w ' ) 1/2 and the Obukhov stability length scale L = - T u * 3 / ( k g w ' T ') were obtained. Applying these results and that of the mean windspeed u(zs) measured by the sonic at height zs to eq. 2, a second independent relationship was found between z0 and d which reads: exp[ku(zs)/u*
¢(S)]
=
(zs -
(3)
d)/zo
This technique was applied to the 30-min averages and yielded a relationship between z0 and d each half hour. Each day, an averaged relationship was estimated with these data. The intersect between this averaged relationship over one day and the regression line found with the profile-fitting technique was accepted as the most likely value for z0 and d for that particular day. 0.50
v "0
0.40
ill~
(3) •
£
0.30
C e @
0.20
.~
0.10
0
II
~
0.00 .00
0.02
0.06 roughness
0.06 length
0.08 z °
0.1_0 (m)
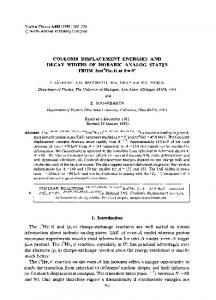
Fig. 1. A n example of the m e a s u r e m e n t results and the applied procedure for one day (28 J u n e ) . --R e g r e s s i o n line (r = 0.98) for the log-profile fitting technique; - the m e a n relationship exp[ku(zo)/U* ~h(S)] = (z~ d ) / z o.
57 An illustration of this procedure is given in Fig. 1. Here, the results from the curve-fitting technique for one day (28 June, height of crop H = 0.45 m) are plotted. The regression line describing the relationship between d and z0 (r = -0.96, n = 42) is shown. Moreover, the mean result of e x p [ ( k u ( z s ) / u* - ~(S)] = (zs - d ) / z o of t hat par t i c ul a r day has been plotted in this figure. The intersect of both lines is z0 = 0.068 m and d = 0.17 m and these values were accepted for 28 June. RESULTS In Fig. 2, the time course of the displacement height, d, as well as the roughness length, z0, has been plotted for the whole growing season. The roughness parameter, z0, increased rapidly early in the growing season while the displacement height, d, did not increase significantly for ~ 6 weeks. These results are to be expected because surface roughness is increased early in the growing season by the growth of the crop elements, but because these elements do not form a coherent surface, significant displacement of the flow field would not be expected. In July, the crop grew very fast, which resulted in a rapid increase of both parameters; this continued until about the middle of August. Towards the end of August, the crop reached its mature state with more or less constant values of both z0 and d. Towards the end of the season, the foliage began to senesce, reducing crop density and causing a slight decrease in the displacement height. The roughness length remained constant within the limits of the experimental error.
~.t~;
~
~
0.IS
E ~
% 1.60q
0.124
, 1.2,
~o
9
5
/.
:.8o i
'
•
0 - CIO
r
5
I
6
]
I
7 T~ME
[
I
~ (month
,
I
9 nomOer)
I
1
IO
J
-
0.094
g
o.o~
D L
•
....
.~"
'
"
0 , 0 0 ~
S
>
~
B
? TIME
8 {month
9
lO
number)
Fig. 2. The change in the displacement height, d, and the roughness length, z0, during the whole growing season.
58 DISCUSSION
The d e p e n d e n c e o f d o n t h e h e i g h t of t h e crop is to be expected, b e c a u s e a taller crop will result in a greater d i s p l a c e m e n t of the flow field. In Fig. 3, the d i s p l a c e m e n t , d, is plotted a g a i n s t the h e i g h t of the crop. The r e g r e s s i o n line is d = 0.84 H -
0.14
w h e r e H is t h e h e i g h t of the crop; the c o r r e l a t i o n coefficient is r - 0.99 (n = 20). From this result, it c a n be c o n c l u d e d that, firstly, the d e p e n d e n c e of the d i s p l a c e m e n t on t h e h e i g h t is very s t r o n g and, secondly, that for a s h o r t crop, w h e r e the e l e m e n t s of the crop do n o t form a c o h e r e n t surface (here H < 0.14 m), it is of no u s e to i n t r o d u c e a d i s p l a c e m e n t h e i g h t in the log-profile. If a r e g r e s s i o n line for the w h o l e period is c a l c u l a t e d w i t h o u t zero bias, the result is d = 0.75 H w i t h a r e g r e s s i o n coefficient of r = 0.98. U c h i j i m a and Wright (1964) report a v a l u e of 0.61 for the d/H v a l u e for m a i z e w h i l e Saito (1963, 1970) reports 0.80. T h e s e differences m a y be the result of different plant s p a c i n g s or plant c o n d i t i o n . The difference b e t w e e n crop h e i g h t and h e i g h t of the displaced flow field is likely to provide a better first-order e s t i m a t e of t h e r o u g h n e s s p a r a m e t e r t h a n the crop h e i g h t as this difference will be a m e a s u r e o f t h e r o u g h n e s s e l e m e n t affecting the displaced flow. In Fig. 4, r o u g h n e s s l e n g t h v a l u e s h a v e been plotted versus this l e n g t h scale. The r e g r e s s i o n line w i t h o u t zero bias (r = 0.86) is s h o w n . The e q u a t i o n of t h e line is zf, = 0.25 ( H - d). This result 2,50
"0
.~
~.00
C~ N
K I
/ /
I .SO
/
E 0
m
x
1. Ob
!
Cl
;
0.S0
/
K "x
x
o.0o4 ,:'~ ~ 0.00
~ 0.S0
~
T 1.00
~
r
•
1.58
vegeflatlon
T
~
2.00
he[!~ht
2.S0
H (m)
Fig. 3. T h e r e l a t i o n s h i p b e t w e e n t h e d i s p l a c e m e n t h e i g h t , d, a n d t h e h e i g h t o f t h e c a n o p y , H. N o n - b i a s e d c o r r e l a t i o n d = 0.75 H (r 7, 0.98).
-
59
supports the expectation of a relationship between z0, d and H, but it is poorer than that between d and/-/. It is likely that crop parameters such as leaf area index, number of stems, etc. (Seginer, 1974) affect the roughness parameter. Monteith (1973) suggested t h a t (H -- d) may be regarded as the depth of the layer in which momentum is absorbed and that, as a first approximation, k ( H - d) (where k = 0.41), is a measure for the roughness parameter, z0. Besides, this relationship implies that z0 is a measure for the average size of the eddies in the upper part (H/3 < z < H ) of the canopy (Thorn, 1971). For a wheat crop, Thorn found z 0.37 (H - d), which is only 15% less than the relationship suggested. Seginer (1974) found from data reported in the literature that for a dense crop the ratio zo/(H d ) is ~ 0.28, which is very close to the result we have found. Moore (1974) determined a value of 0.26 + 0.07 for this ratio by analyzing several crops ranging from smooth grass to forest. Shaw and Pereira (1982) found the value 0.29 for this ratio in a numerical experiment based on a second-order closure model. Our result ( Z o / ( H - d ) = 0.25) deviates 40% from that suggested by Monteith (1973), but agrees well with those found by Seginer (1974), Moore (1974) and Shaw and Pereira (1982). It is sometimes suggested that the displacement height as well as the surface roughness parameters are dependent on wind speed and thermal stratification (Mukammal et al., 1966; Monteith, 1973). Monteith grouped d and z0 into: a low speed region, where skin friction is the dominant process, a middle region where flow becomes more streamlined just above the crop (here form drag
// //
O°IS-
o.lz [-
x
0.03
/
/. x
0.00
--~
.0
r
i --~-- i
0.2
0.4 length
I-
~---F---
0.6 scale
I
0.8 (H
-
i 1.0
d)
(m)
F i g . 4. T h e r e l a t i o n s h i p b e t w e e n t h e r o u g h n e s s p a r a m e t e r , z0, a n d t h e l e n g t h s c a l e ( H Z e r o b i a s e d c o r r e l a t i o n z 0 = 0.25 ( H - d ) w i t h r = 0.86.
d ). - - - -
60 l
O.SO
,
o. ot-i j
3"4";
i
cJ.lO
I
t ! c.oJ~
t . ::L
o
,
o
g , 32 -
;,
0.90~
:
•
2.0
r - - ~
S.O
~
':t.0
=
7----7
S.O
:El -
O.O0
6.9
2.2
--
~ :
C.L
. !.C
•
:
3.0
r
~
":.':
'
:.
L. ]
Fig. 5. The dependence of the behaviour of the roughness length, z0, on the wind speed for two different days. Left-hand side figure is 28 June and right-hand side figure is 15 September. Displacement kept fixed according to d = 0.84 H - 0.14. b e c o m e s m o r e d o m i n a n t ) , a n d a f u l l y t u r b u l e n t r e g i o n w h e r e t h e c a n o p y is s u b s t a n t i a l l y l o w e r e d by a s t r o n g w i n d or l i g h t w i n d in t h e c a s e of a f l e x i b l e crop. A s w e h a v e s e e n e a r l i e r , z0 and d are s t r o n g l y c o r r e l a t e d . C o n s e q u e n t l y , if t h e v a l u e o f o n e o f t h e p a r a m e t e r s c h a n g e s , t h e r e w i l l be a c o m p l e m e n t a r y e f f e c t o n t h e o t h e r . H e n c e , it is difficult to find an o b j e c t i v e w a y to i n v e s t i g a t e t h e b e h a v i o u r o f b o t h p a r a m e t e r s at t h e s a m e t i m e . W e h a v e d o n e t h i s by k e e p i n g o n e p a r a m e t e r c o n s t a n t d u r i n g , for e x a m p l e , o n e day, a n d i n v e s t i g a t ing the behaviour of the other under different wind speed and thermal stability conditions. Because our displacement data show less scatter than the 0.
] {}
,
0 , E~ 0
O. 3 S
, i i
• 40
! I
0.06~
i'~'"
"'--
I
O. C 4
.~Ll
1
I
0. 2 J 4 I
r,*
j
i
J 0.(]2
o.lJ!
~
i
..
q !
0.004
i
~ - 0 . t'~'
• 0.0:
,
~
• C.O0
r
r
O.Cl
R:CH~IRI)SOFt
t
• 2.C
,
•
0 . ,:I ']
:] , O 0 ~ 3.2i
T
7
O.IC
T
i
r.o0 RI/:HRRDSOrt
!
I
i
OiIC
(
0.20
i
7
0.3C
:
Fig. 6. The dependence of the roughness length, z0, on the thermal stratification. Left-hand side figure is 28 June and right-hand side figure is 15 September. Displacement kept constant according to d = 0.84 H 0.14.
61
roughness length, we decided to keep the displacement height constant. Two days were selected for analysis, one at the end of J u n e (H = 0.45 m) and one in September (H = 2.20 m), where the displacement is fixed at d = 0.84 H - 0.14. The values of z0 are plotted in Figs. 5 and 6. The data indicate, within the given speed and stability ranges, no clear dependence of z0 on wind speed or thermal stability. This result is consistent with those of Stanhill and Fuchs (1968) and Kalma and Stanhill (1972). CONCLUSIONS
It is difficult to obtain good estimates of the friction velocity, u*, the displacement height, d, and the roughness parameter, z0, by fitting wind profile data using a log-profile because, mathematically, these parameters are not independent. To find unique values for them, additional independent data, such as values for the friction velocity, are., needed. Changes in the displacement length, d, during a whole season are highly dependent on the development of the crop. For the maize crop we studied, the unbiased regression line is d = 0.75 H with a correlation coefficient of r - 0.98. The surface roughness parameter, z0, is selected by the difference ( H - d): zo = 0.25 ( H - d). The correlation is poorer (r = 0.86), which indicates th at other parameters may affect the value of z0. The ratio Zo/(H - d) = 0.25 corresponds well with that of 0.28 reported by Seginer (1974), t ha t of 0.26 reported by Moore (1974) and t hat of 0.29 found by Shaw and Pereira (1982) in a computer experiment. The ratio Zo/ (H d ) = 0.25 differs considerably from yon K arm an's constant, k 0.41, as well as from the value, 0.37, for a wheat canopy (Thom, 1971). If the displacement length is set fixed at d = 0.84 H - 0.14, the roughness parameter, z0, does not show a clear dependence on the wind speed or thermal stability. This agrees with the results reported by Stanhill and Fuchs (1968) and Kalma and Stanhill (1972), but differs from others, as for example the results reported by Mukammal et al., 1966). ACKNOWLEDGEMENTS
The authors are indebted to the I.C.W. for providing the research plot at the pilot farm Sinderhoeve. During the investigations, J.H.v.B. was supported by the Working Group on Meteorology and Physical Oceanography (MFO) with financial aid from the Netherlands Organization for Advancement of Pure Research (Z.W.O.). REFERENCES Covey, W., 1963. A method for the computation of the wind profile parameters and their standard errors. Prod. Res. Rep. No. 72. Agric. Res. Serv., U.S. Agric. Dep. Prep.: 28-33. De Bruin, H.A.R. and Moore, C.J., 1984. Zero-plane displacement and roughness length for tall vegetation, derived from a simple mass conservation hypothesis. Boundary-Layer Meteorol., 31 : 39-49.
62 Garratt, J.R., 1978. Flux profile relations above tall vegetation. Q. J. R. Meteorol. Soc., 104: 199-211. HSgstrSm, U., 1985. Von Karman's constant in atmospheric boundary layer flow: Reevaluated. J. Atmos. Sci., 42:263 270. Jacobs, A.F.G. and Schols, E., 1986. Surface roughness parameters estimated with a drag technique. J. Clim. Appl. Meteorol., 25:1577 1582. Kalma, J.D. and Stanhill, G., 1972. The climate of an orange orchard: Physical characteristics and microclimate relationships. Agric. Meteorol., 10: 185-201. Legg, B.J. and Long, I.F., 1975. Turbulent diffusion within a wheat canopy: II. Results and interpretation. Q. J. R. Meteorol. Soc., 101: 611~28. Maki, T., 1975. Interrelationship between zero-plane displacement aerodynamic roughness length and plant canopy height. J. Agric. Meteorol. Jpn., 31:7 15 (in Japanese). Monin, A.S. and Yaglom, A.M., 1973. Statistical Fluid Mechanics. M.I.T. Press, Cambridge, MA. Monteith, J.L., 1973. Principles of Environmental Physics. Edward Arnold, London. Moore, C.J., 1974. A comparative study of forest and grassland micro-meteorology. Ph.D.Thesis, The Flinders University of South Australia, 237 pp. Mukammal, E.I., King, K.M. and Cork, H.F., 1966. Comparison of aerodynamic and energy budget techniques in estimating evapotranspiration from a cornfield. Arch. Meteorol. Geophys. Bioklimatol. Ser. B, 14: 384-395. Panofsky, H.A., 1984. Vertical variation of roughness length at the Boulder Observatory. Boundary-Layer Meteorol., 28: 305-308. Raupach, M.R. and Thom, A.S., 1981. Turbulence in and above plant canopies. Annu. Rev. Fluid Mech., 13:97 129. Rayment, R. and Readings, C.J., 1971. The importance of instrumental tilt on measurements of atmospheric turbulence. Q. J. R. Meteorol. Soc., 97: 124-130. Robinson, S.M., 1962. Computing wind profile parameters. J. Atmos. Sci., 19: 189190. Saito, T. 1963. J. Agric. Meteorol. Jpn., 19:5358 (in Japanese). Saito, T. 1970. J. Agric. Meteorol. Jpn., 25:20~214 (in Japanese). Seginer, I., 1974. Aerodynamic roughness of vegetated surfaces. Boundary-Layer Meteorol., 5: 383 393. Shaw, R.H. and Pereira, A.R. 1982. Aerodynamic roughness of a plant canopy: a numerical experiment. Agric. Meteorol., 26: 51-65. Smedman, A. and HSgstrSm, U., 1973. The Marsta micro-meteorological field project. Profile measurement system and some preliminary data. Boundary-Layer Meteorol., 5: 259-273. Stanhill, G. and Fuchs, M., 1968. The climate of the cotton crop: Physical characteristics and microclimate relationships. Agric. Meteorol., 5:183 202. Stearns, C.R., 1970. Determining surface roughness and displacement height. Boundary-Layer Meteorol., 1:102 111. Tennekes, H., 1982. Similarity relations, scaling laws and spectra dynamics. In: F.T.M. Nieuwstad and H. van Dop (Editors), Atmospheric Turbulence and Air Pollution Modeling. D. Reidel, Dordrecht, pp. 37-68. Thom, A.S., 1971. Momentum absorption by vegetation. Q. J. R. Meteorol. Soc., 97: 414428. Uchijima, Z. and Wright, J.L., 1964. An experimental study of flow in a corn plant-air layer. Bull. Nat. Inst. Agric. Sci. (Jpn.) Ser. A, 11: 19-65. Wieringa, J., 1980. A revaluation of the Kansas mast influence on measurements of stress and cup anemometers overspeeding. Boundary-Layer Meteorol., 18: 411430.