Available online at www.sciencedirect.com
ScienceDirect Energy Procedia 78 (2015) 2657 – 2662
6th International Building Physics Conference, IBPC 2015
Changing to energy efficient light sources – An analysis of the energy balance of buildings Johan Nordén*, Henrik Karlsson, Caroline Markusson, Svein Ruud, Mikael Lindgren, Patrik Ollas SP Technical Research Institute of Sweden, Ideon Science Park, SE-223 63, Lund, Sweden
Abstract New light sources such as LED lamps have the potential to reduce the electricity for lighting significantly. However, by reducing the electricity for lighting, the building heating demand is increased. The effects on the building energy balance of changing to more efficient light sources has been investigated by dynamic thermal modelling of typical Swedish single-family and multi-family residential houses. The results show savings on an average of 3.5 kWh/m2 and 0.62 €/m2 for single-family houses, and 3.4 kWh/m2 and 0.61 €/m2 for apartments in multi-family houses annually when changing from incandescent and halogen lamps to LED lamps. © 2015 The Authors. Published by Elsevier Ltd. This is an open access article under the CC BY-NC-ND license © 2015 The Authors. Published by Elsevier Ltd. (http://creativecommons.org/licenses/by-nc-nd/4.0/). Peer-review under responsibility of the CENTRO CONGRESSI INTERNAZIONALE SRL. Peer-review under responsibility of the CENTRO CONGRESSI INTERNAZIONALE SRL Keywords: energy balance; lighting; energy efficiency; internal loads
1. Introduction The European target to halve the energy use in the built environment by 2050 will require all new buildings to be constructed as nearly zero-energy buildings or passive houses. The significantly lower heating demand of such buildings increases the emphasis on heat generated by devices, persons, lighting etc. in the energy balance calculations. For buildings with nearly zero- energy standards, even modest energy supply from internal loads can result in overheating. The heat will partly be stored in the building structure, partly heat the indoor air, and partly be ventilated. Since the storage of energy depends on the penetration depth and dampening of the heat wave, the distribution of heat and the dynamics with the indoor environment becomes more complex. A deeper understanding on how surface temperatures and the air temperature are influenced by the energy from lighting as well as from devices is therefore required in order to improve the design and control of new buildings. In the study presented here, we have analysed the effects on the energy use and cost when changing from incandescent and halogen lamps to LED lamps, lamps which today have an equal or better performance than CFL lamps. This has been simulated for typical building types of Sweden with different heating distribution systems, insulation thicknesses, lighting scenarios etc. The buildings are representative of the Swedish housing stock from 1970 up to now; both for single-family houses and multifamily houses. A living room was simulated with two lighting scenarios, one case with a pendent luminaire and spotlights recessed into the ceiling, and one with a pendent luminaire and surface mounted luminaires in the ceiling. The luminaires used were one pendent luminaire with an opal diffuser, one surface mounted luminaire, and one recessed spotlight. All are typical luminaires used in Swedish households. The light sources used were incandescent, HV halogen, and LED lamps.
* Corresponding author. Tel.: +46-10-516 5000. E-mail address:
[email protected]
1876-6102 © 2015 The Authors. Published by Elsevier Ltd. This is an open access article under the CC BY-NC-ND license (http://creativecommons.org/licenses/by-nc-nd/4.0/). Peer-review under responsibility of the CENTRO CONGRESSI INTERNAZIONALE SRL doi:10.1016/j.egypro.2015.11.340
2658
Johan Nordén et al. / Energy Procedia 78 (2015) 2657 – 2662
2. Method The energy use of different residential houses was simulated using energy balance calculations on a modelled living room. The required inputs for the simulations were building specifics, radiometric data for the luminaires, thermal data for the luminaires including transmission losses through the ceiling, load profiles for lighting, and load specifications and profiles for all other devices. The simulations were performed for one year in Gothenburg, Sweden. 2.1. Luminaire performance The performance of the luminaries with the different light sources are shown in Table 1. Table 1. Luminaire performance data Variant
Luminous flux (lm)
Light output ratio (%)
Power (W)
Efficacy (lm/W)
Pendant Incandescent
651
99.8
59.4
11.0
Pendant LED
805
100
10.3
78.2
Surf mount Incandescent
237
52.8
71.3
3.32
Surf mount LED
267
59.0
12.2
21.9
Spot Halogen
121
73.8
32.8
3.69
Spot LED
194
100
5.2
37.3
2.2. Modelling Detailed dynamic thermal simulations for evaluating the energy use of buildings with different lighting scenarios were performed using a Simulink/Matlab [2] model based on the “International Building Physics Toolbox in Simulink” [3]. In order to accurately model the luminaires, this model was further developed. The model includes transmission losses to the exterior, visible light, thermal radiation, and thermal convection. The distribution of visible light and thermal radiation is not uniform from the luminaires, and a detailed model taking measured angular radiation and light distributions into account was constructed. Two lighting scenarios were evaluated. The first was for a pendant luminaire and four spotlights, and the second was for a pendant luminaires and two surface mounted luminaires. Since the different light sources had slightly different luminous flux, the flux and thus electricity consumption was normalized with the flux of the incandescent and halogen lamps. Five building types typical for Sweden were simulated, two standard and three nearly zero-energy houses. A single-family house with a light structure and a multi-family house with a heavy structure were used representing the most typical buildings in Sweden from 1970 to 2007. As representatives of nearly zero-energy buildings, one single-family house with a light structure, a multi-family house with a light structure, and a multi-family house with a heavy structure were used. The implication of a light structure is that less energy can be stored in the structure. The building components for the different houses are shown in Table 2. Table 2. U-values for the houses simulated. The surface related heat loss factor (W/(m2K)) is the total transmission losses in the room (i.e. the heat loss factor (W/K)) distributed over the whole floor surface of the room. Building type
U-value wall (W/(mK))
U-value roof (W/(mK))
U-value floor (W/(mK))
U-value window (W/(mK))
Surface related heat loss factor (W/(m2K))
Single-family house light
0.28
0.18
0.20
1.20
0.76
Single-family house NZE light
0.21
0.11
0.13
0.80
0.51
Multi-family house heavy
0.28
0.13
No losses
1.50
0.62
Multi-family house NZE heavy
0.23
0.13
No losses
0.80
0.41
Multi-family house NZE light
0.23
0.13
No losses
0.80
0.41
The room simulated was ventilated with a constant inlet air flow of 0.35 l/(sm2). Two types of ventilation corresponding to typical houses in Sweden were applied, fan assisted exhaust ventilation, and supply and exhaust air with heat recovery. The heating distribution systems modelled were concrete embedded floor heating, pre-heated supply air, electric radiators, and water based radiators. Due to the lower inlet temperatures of heat pump systems, two inlet temperatures were simulated. The heating systems and their controls were implemented in the above mentioned simulation models. The floor heating was simulated with a detailed IBPT-model [4]. A new dynamic model for the radiators based on standard SS-EN442 following the
2659
Johan Nordén et al. / Energy Procedia 78 (2015) 2657 – 2662
work of Lindvall [6] was developed taking into account the thermal inertia, and exchanges heat with the surroundings by radiation and convection. For the pre-heating of the supply air, a simplified IBPT-model of a convective heater was developed. Measured climate data for Gothenburg 1994 was used in the calculations. The annual average temperature was 7.02°C. The data for load sizing and scheduling was taken from “End-use metering campaign in 400 households In Sweden” [1], a report published by the Swedish Energy Agency on the electricity use in Swedish households. The water based heating systems were modelled as ideal in the sense that the system was always able to deliver the required heat. The recessed halogen spotlights were only used in the cases with a light building structure since they require a hole to be made in the ceiling. When used with halogen lamps the spotlights require a protective cover. The hole made in the insulation for the cover was modelled as a point source thermal bridge with a ξ-value of 0.15 W/K for the standard house and 0.10 W/K for the nearly zero-energy buildings based on measurements. For the LED spotlights, no cover was required and therefore no thermal bridge was modelled. 3. Results 3.1. Energy use in single-family houses The most significant results of the annual energy simulations of a living room in a single-family house are shown in Table 3. Table 3. Energy savings for living rooms in single-family houses when changing from incandescent and halogen lamps to LED lamps. House type
Heat distribution system
Ventilation
Lighting scenario
Electricity saving Inc -> LED [kWh/m2]
Heating increase [kWh/m2]
Total saving [kWh/m2]
Standard house, light structure
Floor heating
Exhaust
Spot
12.92
3.62
9.30
Floor heating
Exhaust
Surf
13.59
8.58
5.01
Electric radiator
Exhaust
Spot
12.92
5.35
7.57
Electric radiator
Exhaust
Surf
13.59
10.27
3.32
Water radiator
Exhaust
Spot
12.92
4.92
8.00
Water radiator
Exhaust
Surf
13.59
9.50
4.09
Water radiator
Heat recovery
Spot
12.92
4.38
8.53
Water radiator
Heat recovery
Surf
13.59
8.47
5.12
Floor heating
Heat recovery
Spot
12.92
3.77
9.15
Floor heating Pre heated air
Heat recovery
Surf
13.59
7.11
6.49
Heat recovery
Spot
12.92
4.25
8.67
Pre heated air
Heat recovery
Surf
13.59
7.21
6.38
Electric radiator
Heat recovery
Spot
12.92
4.47
8.44
Electric radiator
Heat recovery
Surf
13.59
7.63
5.97
Nearly zero-energy house, light structure
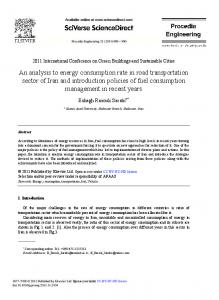
Firstly, the total energy consumption of the room was always lowered when changing to more efficient LED lamps. In all cases, the energy for heating was increased, but this increase was always lower than the decrease in electricity usage. Looking into the detailed results, 35-80% of the electricity used for lighting was converted into useable heat in the simulated cases. For standard houses, the lowest usage occurred for spotlights recessed into the ceiling, and the best usage for houses with direct electrical heating without heat recovery. For well insulated nearly zero-energy houses, 50-60% of the electricity was converted into useful heat. The benefits of changing to more efficient lighting were lowest for standard houses with direct electrical heating without heat recovery. The reason was that the electric heating from the lamps was directly replaced by heat from the electric radiators. The worst case was for surface mounted luminaires where 3 kWh/(m2year) was saved. The largest energy saving was achieved in a house with exhaust ventilation, floor heating, and spotlights. Here the saving was 9.3 kWh/(m 2year). Parts of the heat generated by the lamp was then directly transmitted through the protective cover of the halogen spotlight and lost to the exterior. In addition, the cover became a thermal bridge that increased the thermal losses all hours of the day. Important to note is that the calculations were performed for a living room, which is a room with a relatively high density of lighting. Therefore, the savings per m2 are not representable for the whole building. For total energy savings per m2 of the house, an approximation is that the living room values should be halved. The largest energy saving when changing from incandescent to LED occurred when there was no heating demand. Figure 1 and Figure 2 shows the energy use for heating and lighting over the year for a standard house with direct electrical heating and
2660
Johan Nordén et al. / Energy Procedia 78 (2015) 2657 – 2662
exhaust ventilation without heat recovery and a nearly zero-energy house with supply and exhaust air ventilation with heat recovery.
Figure 1 Monthly savings in electricity for heating and lighting in the spotlight scenario for a standard house and an NZE house with direct electrical heating when changing from incandescent lamps to LED lamps
Figure 2 Monthly electricity savings for heating and lighting in the surface mounted scenario for a standard house and an NZE house with direct electrical heating when changing from incandescent lamps to LED lamps
Figure 1 shows the spotlight scenario and Figure 2 shows the surface mounted scenario. The case with direct electric heating was chosen for simplicity as it is easier to compare electricity use only and not heat versus electricity that can be more ambiguous. As the figures show, the savings increased with decreasing heating demand. This means that the savings were larger in the summer, and for NZE buildings because of their shorter heating season. Looking at the surface mounted luminaire scenario in Figure 2, the savings in the winter were negligible for both house types; here electricity from lighting was to a large extent converted into usable heat. For the spotlights, the thermal bridge created by the hole due to the protective cover increased the savings. To conclude, changing to more energy efficient lighting always results in a saving in the absence of a heating demand. 3.2. Energy use in multi-family houses The results of the annual energy simulations of a living room in a multi-family house are shown in Table 4. Table 4. Energy savings for living rooms in multi-family houses when changing from incandescent and halogen lamps to LED lamps House type
Heat distribution system
Ventilation
Lighting scenario
Electricity saving Inc -> LED [kWh/m2]
Heating increase [kWh/m2]
Total saving [kWh/m2]
Standard house, heavy structure
Water radiator
Exhaust
Surf
13.59
9.69
3.90
Water radiator
Heat recovery
Surf
13.59
7.69
5.90
Nearly zero-energy house, heavy structure
Pre heated air
Heat recovery
Surf
13.59
6.43
7.16
Electric radiator
Heat recovery
Surf
13.59
6.73
6.86
Water radiator
Heat recovery
Surf
13.59
6.35
7.25
Pre heated air
Heat recovery
Spot
12.92
4.16
8.76
Pre heated air Electric radiator
Heat recovery
Surf
13.59
7.02
6.57
Heat recovery
Spot
12.92
4.41
8.51
Electric radiator
Heat recovery
Surf
13.59
7.49
6.11
Water radiator
Heat recovery
Spot
12.92
4.07
8.85
Water radiator
Heat recovery
Surf
13.59
6.87
6.72
Nearly zero-energy house, light structure
2661
Johan Nordén et al. / Energy Procedia 78 (2015) 2657 – 2662
As in the case for single-family houses, changing from incandescent and halogen lamps to LED lamps always resulted in a saving. The savings ranged from 3.8 kWh/m2 to 8.9 kWh/m2 annually. The lowest savings were for a standard house with heavy structure without heat recovery systems, where most of the energy from lighting was converted into useable heat. As the house became more insulated, the savings increased. The largest saving occurred for spotlights in a nearly zero-energy house with a light structure. Here, the thermal bridge created by the protective cover increased the losses to the exterior. Being able to remove this cover was much beneficial. As in section 3.1, a realistic estimate is that he values should be halved to account for the whole house. 3.3. Cost savings For the residents, the cost saving is in most cases the topic of highest interest. They will be investing in more expensive lamps and they need to see that they get return on the investment. Table 5 shows the most interesting results in terms of energy savings as well as the cost savings for the houses simulated. The energy savings are taken from Table 3 and Table 4. The cost of the lamps is ever changing, and was taken from an online shop [5]. The depreciation time for the investment in new lamps was taken as five years, i.e. within five years the lamps are fully paid. No annuity was used; the cost was simply divided by 5. Lighting was supposed to be on for an average of 4h per day all year leading to a service time of 7305 h over five years. Since the lifetime of the LED lamps is 25 000h and the lifetime of the incandescent lamps is 1 000h, the LED lamps did not require any replacements whereas the incandescent were replaced six times. The cost for electricity was 1.13 €/kWh, for district heating 0.08 €/kWh and for heat from the heat pump 0.04 €/kWh (COP=3). Table 5. Annual savings by changing from incandescent and halogen lamps to LED lamps. House type
Heat distribution system
Lighting scenario
Increased heating cost (€/y)
Electricity saving (€/y)
Saving light source (€/y)
Total annual saving (living room) (€/m2)
Total annual saving (house) (€/m2)
Standard single-
Floor heating
Spot
5.4
57.8
0.8
1.5
0.7
family house, light structure
Floor heating Electric radiator
Surf
12.8
60.8
7.7
1.6
0.8
Spot
0.0
33.9
0.8
1.0
0.5
Electric radiator
Surf
0.0
14.9
7.7
0.6
0.3
Floor heating
Spot
5.6
57.8
0.8
1.5
0.7
Floor heating Electric radiator
Surf
10.6
60.8
7.7
1.6
0.8
Spot
0.0
37.8
0.8
1.1
0.5
Electric radiator
Surf
0.0
26.7
7.7
1.0
0.5
Water radiator
Surf
28.9
60.8
7.7
1.1
0.6
family house, heavy structure
Water radiator
Surf
22.9
60.8
7.7
1.3
0.6
Nearly zero-energy
Pre heated air
Surf
0.0
32.0
7.7
1.1
0.6
Electric radiator Water radiator
Surf
0.0
30.7
7.7
1.1
0.5
Surf
18.9
60.8
7.7
1.4
0.7
Nearly zero-energy
Pre heated air
Spot
0.0
39.2
0.8
1.1
0.6
multi-family house, light structure
Pre heated air Electric radiator
Surf
0.0
29.4
7.7
1.0
0.5
Spot
0.0
38.1
0.8
1.1
0.5
Electric radiator
Surf
0.0
27.3
7.7
1.0
0.5
Nearly zero-energy single-family house, light structure Standard multi-
multi-family house, heavy structure
As discussed in previous sections, the simulated results for a living room are not directly applicable to a whole house due to the higher lighting levels of this type of room. The last column of Table 5 therefore shows the savings per m2 for the whole house. As can be seen from the table; a change to more energy efficient LED lamps resulted in savings in all simulated cases. The average saving for a single-family house was 0.62 €/m2, which for a house with a floor area of 150 m2 would result in a saving of approximately 94 €. For multi-family houses, the cost savings were on average 0.61 €/m2. For an apartment of 100 m2 this would result in a cost saving of 61 € per year. In many cases, the resident are charged for electricity but not for heating. In these cases, the average saving would be 0.91 €/m2 which would yield a saving of 91 € per year. The savings come from two factors, the cost of buying the lamps, and the energy savings. With the five year analysis of Table 5, the cost of the lamps is always lower for LED lamps. Even though the cost of purchase is considerably higher for LED lamps, the short lifetime of the incandescent lamps (6 replacements for the 7 300 h) makes the cost of LED lamps lower in this case. For the longer perspective, the LED lamps are expected to last 25 000 h which would mean a lifetime of 17 years in the described scenario and having to change the incandescent bulbs 25 times would mean that the savings would be considerably higher. The reason for choosing 5 years in the analysis was that it is difficult for the customers to trust lifetimes of 17 years for a product that
2662
Johan Nordén et al. / Energy Procedia 78 (2015) 2657 – 2662
has been in the market for such a short period of time. Being able to realise a saving within five years makes the investment into higher purchase price lamps more probable. From a technical point of view there is reason to trust the data given by the lamp manufacturers but there will always be inferior products in the market and in the end it will be up to the customer to choose the supplier that he or she trusts. 4. Discussion The most fundamental result of the energy balance calculation and the cost estimations performed is that it is always beneficial to change from incandescent and halogen lamps to LED lamps. A common argument is that all of the energy consumed by lighting is converted to heat which comes to use within the building. With this argument, it is not useful to change to more efficient light sources especially not if the cost of the new light sources are higher. Our study shows that this is not the case. Independent of heating system or type of house, a change always results in a saving in all simulated cases. The main reason for this is that every kWh of electricity saved from lighting outside the heating season is a kWh saved, none of this heat would be useful for the building. For nearly zero-energy buildings, the heating season is shorter, and the savings are thus larger. LED lamps have a higher cost than conventional incandescent or halogen lamps. This is one of the factors prohibiting the large scale upgrade to more energy efficient lighting. But due to the longer life time of the LED lamps, our study shows that the payback time in terms of cost with current lamp prices is between 4-5 years based on an average use of 4 h per day. The LED lamps on the market today often have a lifetime between 25 000 h and 35 000 h and if this is correct the lamps will with the 4 h per day use last for 17-24 years. But since light sources are becoming more energy efficient, it is hardly realistic to consider such a scenario. Most probably, they will be replaced much sooner to accommodate further energy savings. The average electricity use for lighting in single-family houses in Sweden is 850 kWh per year and for apartments in multifamily houses it is 550 kWh per year [1]. Considering the lamps in the market today, a realization of a saving of 85% in electricity for lighting is possible by changing from incandescent and halogen to LED lamps. Including the increased heating required, our study shows that the savings per m2 floor area per year are on an average 3.5 kWh/m2 for single-family houses, and 3.4 kWh/m2 for apartments. In terms of cost, the savings are on an average 0.62 €/m2 for single-family houses, and 0.61 €/m2 for apartments in multi-family houses. Notable is that when the lamps are changed, the heat that was generated by electricity for lighting for incandescent is in many cases replaced by heat from other lower cost sources such as district heating, heat pumps, and bio fuels. This increases the savings further. The worst case is for houses with direct electrical heating where the electricity for the less efficient light sources is replaced by heat from electric radiators at almost the same rate during the heating season. Whenever the need for heating is low or non-existent, changing to more energy efficient lighting will always result in a saving of energy, i.e. the shorter the heating season, the larger the saving. This means that more energy efficient buildings benefit more, but it also means that the warmer the climate, the larger the saving. For countries with a warmer climate than Sweden, the savings will be larger both due to the electricity savings from the lamp change itself, and due to the slightly reduced cooling loads in the summer. In this study we have looked at residential houses in Sweden where cooling systems rarely are used. Therefore, overheating has not been analysed. Another important finding is that installations with spotlights requiring a protective cover for the luminaire have relatively large losses through the hole in the insulation created by the cover. This point source thermal bridge was measured to 0.1-0.2 W/K. This cover is not required by LED spotlights, and additional savings can thus be achieved during winter. Acknowledgements The project was funded by Swedish Energy Agency, and is gratefully acknowledged. References [1] Zimmermann. J.P. End-use metering campaign in 400 households In Sweden. Swedish Energy Agency; 2009 [2] The MathWorks Inc.: Matlab, Simulink. www.mathworks.com [3] Rode, C., Gudum C., Weitzmann, P., Peuhkuri, R., Nielsen, T. R., Sasic Kalagasidis, A., Hagentoft C-E. International Building Physics Toolbox, General report, R-02:4. Gothenburg: Chalmers University of Technology, Department of Building Physics; 2002. Also available on www.ibpt.org. [4] Karlsson, H. Thermal Modelling of Water-Based Floor Heating Systems - supply temperature optimisation and self-regulating effects. Doktorsavhandlingar vid Chalmers tekniska högskola, ny serie nr 3050; 2010 [5] Elgiganten Online Shop, www.elgiganten.se 2014-03-09. [6] Lindvall, N. Jämförelse mellan funktionen hos radiatorsystem injusterade efter två principer - En analys av radiatortermostatventilens betydelse och reglerförmåga.. Masters thesis at Chalmers tekniska högskola, Institutionen för Termo- och fluiddynamik.; 2006