between the turbid and clear lakes with non-parametric Kruskal-Wallis tests (H ...... using information from 203 lakes in South America, Europe and North ...... (1000 x 7) output matrices that comprised the average Middle and Late ...... co-supervisor) for his help in all matters and specially for being always there to answer my.
Morphology Captures Function in Phytoplankton A Large-Scale Analysis of Phytoplankton Communities in Relation to their Environment
Carla Kruk
Thesis committee Thesis supervisor Prof. dr. Marten Scheffer Professor of Aquatic Ecology and Water Quality Management Group, Wageningen University Thesis co-supervisor Dr. Edwin T.H.M. Peeters Assistant professor Aquatic Ecology and Water Quality Management Group, Wageningen University Other members Prof. dr. Cajo J. F. ter Braak, Wageningen University Dr. Bas Ibelings, Eawag Aquatic Research, Dübendorf, Switzerland Prof. dr. Jef Huisman, Institute for Biodiversity and Ecosystem Dynamics, Amsterdam Prof. dr. Jos T. A. Verhoeven, Utrecht University
This research was conducted under the auspices of the Graduate School of Socio-Economic and Natural Sciences of the Environmentl (SENSE).
Morphology Captures Function in Phytoplankton A Large-Scale Analysis of Phytoplankton Communities in Relation to their Environment
Carla Kruk
Thesis submitted in fulfilment of the requirements for the degree of doctor at Wageningen University by the authority of the Rector Magnificus Prof. Dr. M.J. Kropff, in the presence of the Thesis Committee appointed by the Academic Board to be defended in public on Thuesday 6 April 2010 at 11 a.m. in the Aula.
Carla Kruk Morphology Captures Function in Phytoplankton. A Large-Scale Analysis of Phytoplankton Communities in Relation to their Environment, 117 pages Thesis, Wageningen University, Wageningen, NL (2010) With references, with summaries in Dutch and English ISBN 978-90-8585-617-7
Contents CHAPTER 1. General introduction ..................................................................................................................... 6 Thesis outline................................................................................................................................................. 8 CHAPTER 2. Determinants of Biodiversity in Subtropical Shallow Lakes (Atlantic Coast, Uruguay) ................. 9 Introduction ................................................................................................................................................. 11 Methods ...................................................................................................................................................... 12 Results ......................................................................................................................................................... 17 Discussion .................................................................................................................................................... 24 CHAPTER 3. Species that tend to reach high biomass are relatively predictable in phytoplankton ............... 29 Introduction ................................................................................................................................................. 30 Methods ...................................................................................................................................................... 31 Results ......................................................................................................................................................... 34 Discussion .................................................................................................................................................... 39 CHAPTER 4. A Morphological Classification Capturing Functional Variation in Phytoplankton ..................... 47 Introduction ................................................................................................................................................. 48 Methods ...................................................................................................................................................... 50 Results ......................................................................................................................................................... 52 Discussion .................................................................................................................................................... 59 CHAPTER 5. Phytoplankton Community Composition can be Predicted Best in Terms of Morphological Groups ............................................................................................................................................................. 64 Introduction ................................................................................................................................................. 65 Methods ...................................................................................................................................................... 66 Results ......................................................................................................................................................... 69 Discussion .................................................................................................................................................... 71 CHAPTER 6. Trait-Based Approach Disentangles Core Features of Phytoplankton Succession ...................... 75 Introduction ................................................................................................................................................. 76 Methods ...................................................................................................................................................... 78 Results ......................................................................................................................................................... 83 Discussion .................................................................................................................................................... 86 CHAPTER 7. Synthesis ...................................................................................................................................... 91 Phytoplankton communities as functionally filtered subsets ..................................................................... 91 Towards a deeper understanding ............................................................................................................... 93 REFERENCES..................................................................................................................................................... 95 Summary........................................................................................................................................................ 104 Samenvatting ................................................................................................................................................. 106 Acknowledgements ....................................................................................................................................... 109 Curriculum Vitae ............................................................................................................................................ 111 List of Publications ......................................................................................................................................... 112 Sense certificate ............................................................................................................................................ 114
Cover image: Schematic representation of the morphology-based functional groups of phytoplankton organisms (Kruk et al. 2010).
Chapter 2. Species richness in shallow subtropical lakes
CHAPTER 1. General introduction Phytoplankton is an assemblage of microscopic photosynthesizing algae and cyanobacteria. Although phytoplankton size varies widely (ca. 0.4 - 1000 m) the organisms are simple and while colonies and filaments can be formed, unicells are the dominant form (Harris, 1986). Restrictions on their size are posed by their habitat and the need to cope with the acquisition of resources (light, nutrients) and with mortality caused by hydrological washout, sedimentation, and grazers (Reynolds, 1984a). It has been argued that unicells are the most adequate lifeform to deal with these restrictions because they allow high replications rates to compensate loss processes and a large surface to volume ratio, favouring resource acquisition (Lewis, 1976; Raven, 1998; Jiang et al., 2005). Despite these restrictions, phytoplankton is an extremely diverse group. There are an estimated of 5000 extant species in the sea (Tett & Barton, 1995) and 5000 in freshwaters (Reynolds, 2006). Often more than 100 species co-exist (Hutchinson, 1961). Phytoplankton is essential for the functioning of the earth system as it account for half of Earth’s primary production (Falkowski et al., 2003; Arrigo, 2005). Therefore, it has direct effects on global climate, for example as sink of greenhouse gases (Falkowski & Oliver, 2007; Litchman & Klausmeier, 2008; Kosten et al., in press). On the other hand many problems of water quality are caused by phytoplankton (Huisman et al., 2005) with potentially serious implications for human health (Paerl & Huisman, 2009). Phytoplankton species differ widely in many functional aspects. Therefore, to understand these communities’ roles in the functioning of ecosystems what is important is community composition rather than just biomass. For example, species differ in their potential for nitrogen fixing and carbon sequestration (Graham et al., 2000; Verity et al., 2002) and in their nutritional value for grazers (Sterner & Elser, 2002). Also, specific problems associated to phytoplankton blooms such as toxicity and odour, as well as the management strategies depend on the species that are present (Scheffer et al., 1997; Reynolds et al., 2002). To predict the dynamics of biological communities we need to understand the mechanisms controlling community structure, assembly and functioning (Weiher & Keddy, 1995; Le Quéré et al., 2005). However, modelling community dynamics in detail seems a daunting task as there are so many phytoplankton species, and a myriad of combinations of potential conditioning factors, including abiotic and biotic mechanisms as well as diverse spatial (local, regional and global) and temporal (hours to years) scales of action (Harris, 1986; Reynolds, 2006). Furthermore, even with full knowledge of all aspects of species
Chapter 2. Species richness in shallow subtropical lakes
biology intrinsic chaos in communities may make detailed prediction fundamentally impossible (Hutchinson, 1961; Huisman & Weissing, 2001; Roy, 2007; Benincà et al., 2008). Aggregated estimators of phytoplankton communities (e.g. total biomass) may work to predict overall community responses to varying environmental conditions (Vollenweider, 1976; Scheffer et al., 2003). However, as argued, it is important to know what kind of species will appear and consider the mechanisms behind the patterns. This thesis focuses on the question whether species might be clustered in groups that are reasonably homogeneous in a functional sense, and might be better predictable from environmental conditions than individual species. Trait-based approaches have been increasingly applied to explain and predict the response of phytoplankton species to environmental conditions both in marine and continental aquatic systems (Weithoff, 2003; Reynolds, 2006; Follows et al., 2007; Litchman & Klausmeier, 2008). Well-known examples are the Plankton Ecology Group (PEG) model (Sommer, 1989) that predicts the seasonal succession in temperate lakes and the Margalef mandala (Margalef, 1978) that explains the main strategies and mechanisms for marine plankton in terms of a trade-off between r and K selected traits. More recently, models based on functional traits have been shown to capture phytoplankton distribution in the world’s oceans quite well (e.g. Dynamic Global Ocean Models, Le Quéré et al., 2005). These and other examples illustrate that clustering species based on their functional traits makes sense to summarise their response to environmental change. Functional traits are morphological, phenological or physiological characteristics, measured at the level of the individual, that affect ecological performance, and ultimately fitness (Violle et al., 2007). Functional traits can be continuous or categorical features that can be calculated as the average for a population in a particular environmental condition (Litchman & Klausmeier, 2008). Most phytoplankton species are cosmopolitan and easily dispersed (Hillebrand & Azovsky, 2001; Finlay, 2002). Therefore, it is not unreasonable to assume that the local environmental conditions including the physical structure of the system, the availability of resources and predation by zooplankton will determine which species occur at any given moment and place (Reynolds, 1980). These local conditions will favour groups of species that share similar functional traits (Margalef, 1978; Tilman, 1982; Reynolds, 1984b, 1994, 2006). In my thesis I seek to define such groups of functionally similar species based on measurable morphological characteristics, and explore how well these groups can be predicted from environmental conditions.
Chapter 2. Species richness in shallow subtropical lakes
Thesis outline In the first 2 chapters of this thesis (2 and 3) I explore the factors that affect diversity and abundance at the species level. First, in Chapter 2 I evaluate which are the main factors that appear to determine the number of species in phytoplankton communities of a group of subtropical shallow lakes in relation to diversity of other groups of organisms found in these lakes. In Chapter 3 I analyze differences in predictability of individual species from environmental conditions in a wide group of lakes from different climate zones and continents. The subsequent three chapters focus on the question how well morphologybased groups capture ecology of the species and how well the distribution and abundance of such groups may be predicted from environmental conditions. In Chapter 4 I propose a functional classification of phytoplankton species based exclusively on organismic morphology and analyze whether the derived groups have coherent physiological traits and demographic parameters. In Chapter 5 I evaluate how well the abundance of such morphology-based groups is related to environmental conditions, comparing the results to those for other classifications and for individual species. Finally in Chapter 6 a mathematical model for simulating the dynamics of the morphology-based functional groups is presented.
Chapter 2. Species richness in shallow subtropical lakes
CHAPTER 2. Determinants of Biodiversity in Subtropical Shallow Lakes (Atlantic Coast, Uruguay) This chapter has been published previously in Freshwater Biology. Carla Kruk, Lorena Rodríguez-Gallego, Mariana Meerhoff, Federico Quintans, Gissell Lacerot, Néstor Mazzeo, Flavio Scasso, Juan C. Paggi, Edwin T. H. M. Peeters & Marten Scheffer
Abstract 1. Shallow lakes and ponds contribute disproportionally to species richness relative to other aquatic ecosystems. In-lake conditions (e.g. presence of submerged plants) seem to play a key role in determining diversity, as has been demonstrated for temperate lakes. When water quality deteriorates and turbidity increases, conditions in such lakes are affected drastically resulting in a loss of diversity. However, it is not clear whether subtropical lakes show the same pattern and whether the richness of all groups reacts similarly to environmental changes. 2. Our aim was to analyse the main factors explaining patterns of species richness in plankton, fish and submerged macrophyte assemblages in both turbid and clear subtropical shallow lakes. We analysed abiotic and biotic features of 18 subtropical, smallto medium-sized, shallow lakes along the Uruguayan coast. We compared both turbid and clear ecosystem states and evaluated the relative variance explained by the factors measured. 3. Variables describing lake and catchment morphology, as well as the percentage of the water column occupied by submerged macrophytes (%PVI) and water turbidity, had strong effects on taxon richness. Interestingly, individual biotic groups had dissimilar richness patterns. Macrophyte %PVI decreased with increasing lake area, while fish species richness showed the opposite pattern. Phytoplankton species richness increased with macrophyte %PVI, while the zooplankton richness pattern varied depending on the taxonomic group considered. 4. Overall, our results indicate that, as found for temperate lakes, a greater submerged plant cover promotes higher species richness in several groups, and that this may overwhelm the otherwise expected positive effect of lake size on species richness. On the other hand, small-bodied zooplankton predominated in lakes with high plant abundance. Our findings concur with recent studies, indicating that refuge capacity of aquatic plants might be weaker in (sub)tropical than in temperate shallow lakes.
Chapter 2. Species richness in shallow subtropical lakes
The extremely high plant cover, frequently observed in warm lakes, could potentially lead to different richness patterns in some groups. This conclusion has important consequences for local managers and conservationists. 5.
Chapter 2. Species richness in shallow subtropical lakes
Introduction Shallow lakes are crucial for the conservation of local and global biodiversity (Moss, 2000). These systems vary considerably in species richness, but at a regional level they may contribute more to diversity than other freshwater ecosystems, such as streams, ditches and temporary ponds (Williams et al., 2003). Most shallow lakes occur in lowland areas, often with high human population densities, and as a consequence their environmental and socioeconomic value is being dramatically affected (De Meester & Declerck, 2005). Rather surprisingly, studies on species richness patterns in shallow lakes are underrepresented and largely ignored in monitoring and protection strategies (Waide et al., 1999; Williams et al., 2003). Furthermore, studies analysing the determinants of biodiversity in subtropical or tropical lakes are even more scarce (Havens et al., 1996; Yuma et al., 2006). The application of the theory of island biogeography (Macarthur & Wilson, 1967; Debinski & Holt, 2000) to aquatic systems, would predict higher species richness in larger, deeper and less isolated lakes than in smaller, more isolated systems. However, in temperate small shallow lakes and ponds without obvious surface connections to other waterbodies, different factors driving biodiversity (from those described in such theory) might explain their disproportionally high number of species (Williams et al., 2003). Thus, the effects of in-lake processes may outweigh the effects of lake area and connectivity (Scheffer et al., 2006). Local factors, such as productivity (often associated with a clear water or turbid water state), are usually crucial in explaining patterns of species richness (Scheffer et al., 1993). The turbid state, dominated by phytoplankton, has poorer water quality and fewer species. The clear water state, often accompanied by dominance of submerged macrophytes, is usually more species rich (Jeppesen et al., 1997; Jeppesen et al., 1998; Declerck et al., 2005). Aquatic vegetation may play a key role in those systems, modulating (i.e. by modifying habitat heterogeneity) ecological interactions and thus leading to a greater species richness than predicted by the theory of island biogeography (Scheffer et al., 2006). In particular, submerged vegetation and the associated high spatial heterogeneity have been shown to promote relatively high richness of aquatic birds, amphibians and invertebrates (Søndergaard et al., 2005; Scheffer et al., 2006). Recent research in subtropical ecosystems has shown that a much greater richness and density of fish, but not of invertebrates, is associated with beds of submerged plants in subtropical lakes than in similar temperate ones (Meerhoff et al., 2007a; Meerhoff et al., 2007b). Several studies have analysed the relationship between biodiversity and potentially explanatory variables in temperate shallow lakes. However, most studies of species
Chapter 2. Species richness in shallow subtropical lakes
richness have focussed only on one or two communities (e.g. zooplankton or macrophytes) and few works have addressed the simultaneous response of several groups to environmental change (Allen et al., 1999; Jeppesen et al., 2000; Declerck et al., 2005; Beisner et al., 2006). Therefore, it is not clear whether the species richness of all parts of the community change in the same way in response to environmental drivers (Declerck et al., 2005). Neither is it known how such patterns are affected by trophic interactions among the groups (Dyer & Letourneau, 2003). Body-size might affect the relative effect of the different potential factors. For example, lake area and connectivity are expected to be important for relatively large organisms, such as zooplankton and fish (Hillebrand & Azovsky, 2001). The effects of these factors are less clear for phytoplankton, with some studies showing contradictory results (e.g. Declerck et al., 2005; Smith et al., 2005). The fact that the richness of different species groups may respond differently to the environment could necessitate specific management or conservation programmes for such lakes. Our objective was to analyse factors explaining richness patterns of several assemblages (phytoplankton, zooplankton, fish and submerged macrophytes) in subtropical shallow lakes. Therefore, we studied several abiotic and biotic variables from 18 shallow lakes along the Uruguayan Atlantic coast that varied in environmental state (clear or turbid water). Based on the theoretical framework from the temperate zone, we expected that clear and plant-dominated shallow lakes would generally have more diverse species assemblages than turbid (e.g. Scheffer et al., 1993), and that the in-lake attributes would be more important than area and connectivity (e.g. Scheffer et al., 2006).
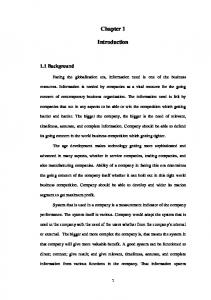
Methods Study area We studied 18 shallow lakes along the south-eastern coast of Uruguay during the 2003 Austral summer (Fig. 1). The lakes are classified as subtropical (Salas & Martino, 1990). Most of these lakes originated during marine transgressions in the Quaternary (GarcíaRodríguez et al., 2004) and are located at sea level. All systems are freshwater, shallow and small to medium-sized (matching their catchments) and show a gradient in cover of submerged macrophytes. Most of them are surrounded by wetlands and may be considered in a semi-pristine state. Only Pajarera Lake is artificial, whereas Cisne and
Chapter 2. Species richness in shallow subtropical lakes
Diario lakes have been dammed, and Blanca, Escondida and García lakes are used as drinking water reservoirs. Data collection All lakes were sampled once during summer (first half of January 2003) following the same procedure. We selected summer as the sampling season because it is the time of maximum biological activity for most, if not all, organisms and was therefore best suited to give a representative picture of the ecosystems. We analysed an extensive list of variables (Table 1). Lake and catchment variables were calculated using aerial photographs and GIS methodology (Table 1). We measured in-lake variables in situ at the deepest point in each lake (e.g. dissolved oxygen, temperature, conductivity, light, etc., Table 1). We took samples for water chemistry (e.g. alkalinity, nutrients, etc.) and plankton (Table 1) from three randomly selected shore to shore transects (thus reaching the limits of the surrounding wetland area). We divided each transect into five equidistant points at which we took whole water-column samples with a PVC tube (20-cm diameter, length adjusted to lake depth). We mixed the water from the five points into a bulk sample, each transect being a sampling replicate. At the same points, we collected, by scuba diving, three 5-cm deep sediment cores for nutrient analysis. We sampled fish using two techniques (Table 1). The littoral zone was sampled during sunset, by point sample electrofishing, applying a short burst of electricity (hereafter ‘pulse’), to between 30 and 45 points in each lake, according to the lake perimeter. The fish abundance was estimated as CPUE (capture per unit effort), and calculated as the total number of individuals divided by the total number of electric ‘pulses’ applied. The pelagic zone was sampled overnight (12 hours) with three multi-mesh gill nets (Table 1). Pelagic abundance was estimated as CPUE, and calculated as the number of individuals divided by the net area and by the time of exposure. We estimated the abundance of submerged macrophytes as the percentage of the water column inhabited by them (%PVI, sensu Canfield et al., 1984) by measuring submerged macrophyte cover, plant height and water depth along equidistant transects covering the whole lake. The number of transects varied according to the lake area. With this information, we also classified the lakes in relation to the spatial heterogeneity of their submerged plant communities, according to Semeniuk et al. (1990). First, we assessed the spatial arrangement of the plant species in each lake, considering three classes: homogeneous (only one species), zoned (several species in different patches) and heterogeneous (several species co-occurring in patches). Secondly, we evaluated the spatial distribution pattern across the system, considering three classes: littoral, mosaic, and complete. The combination of these two characteristics resulted in nine classes, with
Chapter 2. Species richness in shallow subtropical lakes
class 1 having the lowest heterogeneity (i.e. one submerged plant species only at the periphery of the lake) and class 9 the highest (i.e. several species in a heterogeneous arrangement, covering all the system). Lakes without submerged plants belonged to class 0. We estimated the species richness of each assemblage (phytoplankton, zooplankton, fish and submerged macrophytes) after identifying all individuals to the species level, when possible. We applied rarefaction to plankton counts by counting until the number of species reached an asymptote, when no more new species appeared after two to three units of counting effort. In the case of phytoplankton, we counted until we reached at least 100 individuals of the most frequent species, even if species saturation had been already reached. We did not include here those species strongly associated with periphytic communities. For the zooplankton community, we took 1 and 5 ml subsamples and counted them fully, with the aim of counting at least 100 and 50 individuals of the commonest species of rotifers and microcrustaceans (copepods and cladocerans) respectively, and subsequently screened the rest of the sample for rare species. We calculated the mean organism size for plankton communities as a weighted average of the mean species size. We measured fish in the field while, for plankton communities, we used unpublished data from studies in the same region (Kruk & Lacerot, Universidad de la República, unpublished data). We considered only those phytoplankton species that made up more than 1% of the total, while we considered all zooplankton and fish species. For fish mean sizes, we used the data for the species collected by seine net and electrofishing separately, to take into account the different size selectivity of the two methods.
18
URUGUAY 13
12 1 2
Río de la Plata
3
4
17
16
6
7
9 58
10
11
15
14
Atlantic ocean
Figure 1. Geographical location of the studied lakes. 1: Cisne; 2: Diario; 3: Blanca; 4: Barro; 5: Escondida; 6: Chica; 7: Techera; 8: Nueva; 9: Mansa; 10: Nutrias; 11: Chaparral; 12: Ponderosa; 13: Clotilde; 14: García; 15: Aguada; 16: Moros; 17: Redonda and 18: Pajarera.
Chapter 2. Species richness in shallow subtropical lakes Table 1. List of variables measured in the lakes studied, indicating the units, abbreviations and methods used for their estimation. Variables and units
Method
Lake and catchment variables Catchment area (ha) and perimeter (km) Lake area (ha) and perimeter (km) Surrounding wetland area (ha) and perimeter (km) Island area (ha) and perimeter (km) Ratio wetland area and lake area: W/L Number of tributaries Mean distance to the three closest freshwater systems (km): connectivity Lake mean and maximum depths (m): Zmean and Zmax In-lake in-situ variables o Temperature ( C): T -1 Dissolved oxygen (mg L ): DO -1 Conductivity (Sm ): K -1 Light attenuation coefficient (m ): Kd Secchi disk depth (m): SD pH In-lake chemical variables -1 Alkalinity (eq L ): Alk -1 Soluble reactive phosphorus (g L ): SRP -1 Total phosphorus (g L ): TP -1 Total nitrogen (g L ): TN -1 Nitrate (g L ): NO3 -1 Ammonium (g L ): NH4 -1 Dissolved inorganic nitrogen (g L ): DIN -1 Silicate (g L ): SRSi -1 Total suspended solids (g L ): TSS -1 Coloured dissolved organic matter (nm ): CDOM -1 Sediment TP (g DWg ) -1 Sediment TN (g DWg ) Assemblages Submerged macrophytes richness: Smac Percentage of plant volume inhabited (%): %PVI Submerged macrophytes spatial heterogeneity -1 Phytoplankton abundance (org ml ) Zooplankton species richness: Szoo -1 Zooplankton abundance (org L ): Zoo -1 Fish abundance in the littoral zone (CPUE: ind pulse ) -2
-1
Fish abundance in the pelagic zone (CPUE: ind net m hour ) Fish species richness: Sfish
Aerial photographs and GIS methodology
In situ measures
Photosynthetically available radiation profile
Apha (1985) Murphy & Riley (1962) Valderrama (1981) Valderrama (1981) Müller & Widemann (1955) Koroleff (1970) NO3 + NH4 Müllin & Riley (1955) Apha (1985) Fluorescence (McKnight et al., 2001) Valderrama (1981) Valderrama (1981) Direct observation in the water body Canfield (1984) 9 classes (Semeniuk et al., 1990) Lugol's iodine (Utermöhl, 1958) in random fields 69-m-mesh size net Formaldehyde 4% (Paggi & De Paggi, 1974) Electrofishing (Perrow, 1996). Elektrofishfanganlage Type FEG 1000. Range of electric pulses per lake: 30-45. Multi-mesh gill nets (30 m x 1.5 m, mesh sizes: 15, 20, 25, 30, 35, 40 and 50 mm knot to knot) Electrofishing and multi-mesh gill nets
Data analysis We used bivariate correlations (Pearson’s coefficient, r; or Spearman’s coefficient, rs) to analyse the relationship between the abundance and richness of each assemblage, as well as that between richness and the biotic and abiotic measured variables. To analyse the effect of the biotic and abiotic measured variables on the species richness of each
Chapter 2. Species richness in shallow subtropical lakes
community, we ran a multiple regression model for each assemblage. We selected the best independent variables for each model by a forward selection procedure. The original variables included in all cases were: Log 10lake area, %PVI, fish CPUE, zooplankton abundance, phytoplankton abundance, Kd (light attenuation coefficient), TP (total phosphorus), TN (total nitrogen), SRP (soluble reactive phosphorus), DIN (dissolved inorganic N) and sediment TN (Table 1). We did not include the abundance of a particular assemblage as an explanatory factor in its corresponding model. Furthermore, to analyse the effects of turbidity on taxon richness, we classified the lakes into clear or turbid and applied non-parametric correlations. We classified the lakes as clear when they had more than 1 m Secchi disk depth (SD) (Scheffer et al., 1993) and, alternatively, if lower than 1 m SD, had > 50 %PVI. The rest of the systems were classified as turbid and not dominated by submerged macrophytes, with high turbidity being either due to inorganic suspended solids or phytoplankton (as chlorophyll-a). We analysed the effects of turbidity by either including or removing the turbid systems from the data set. We tested for differences in the abiotic variables and the species richness per assemblage between the turbid and clear lakes with non-parametric Kruskal-Wallis tests (H statistic). To assess the relative contribution of environmental variables to the richness of the assemblage studied, we performed a series of ordination analyses including lake and catchment morphology, in-lake variables, phytoplankton and zooplankton abundance, fish CPUE, and submerged macrophytes %PVI as potential explanatory factors (Table 1). A preliminary detrended correspondence analysis (DCA) with log-transformed biological data showed short gradient lengths (i.e. 0.87 standard deviations). We therefore used redundancy analysis (RDA), a linear response model, for subsequent ordination analyses (ter Braak & Smilauer, 1998). A selection process was used to eliminate the variables lacking a unique contribution to the regression equation, in favour of a smaller number that explained a high proportion of the variance with low redundancy. Prior to the analysis, we assessed the importance of each variable using the forward selection procedure in a RDA and included only those with a significant (p 0.20). Presence of many species could be relatively well predicted from environmental variables. Almost 60% of the studied species had a Nagelkerke R2 of at least 0.50 with a minimum value of 0.21 and a maximum of 0.99. (Fig. 2a). Species from different phylogenetic groups did not differ in predictability of their presence (χ28= 8.919, p = 0.349). The same occurred with species from different MBFG (χ26= 10.50, p = 0.1052). Also, morphological traits and demographic parameters were not related to the predictability of the species presence (Table 1).
Table 1. Spearman correlation coefficients (rs) of the predictability of species presence (Nagelkerke R2) and species biomass (R2) with each other and the demographic parameters and morphological traits. Relative biomass: % biomass; percentage of species with more than 30% of contribution to the total community biomass: 30% spp; species frequency of occurrence: frequency; species volume: V; surface: S; and maximum linear dimension: MLD. Significant levels: *p