Lynn Cox, Brian Fields, Cheri Vitez, Tom. Phillipi, Robert Doren, Joel Trexler, Dave ...... automated station on Elliott Key, at the main ranger station. Candidate.
National Park Service U.S. Department of the Interior
Natural Resource Program Center
South Florida / Caribbean Network Vital Signs Monitoring Plan Natural Resource Report NPS/SFCN/NRR—2008/063
Big Cypress National Preserve Biscayne National Park Buck Island Reef National Monument Dry Tortugas National Park
Everglades National Park Salt River Bay National Historical Park and Ecological Preserve Virgin Islands National Park
ON THE COVER Snowy egrets and mangroves in Everglades National Park, Grunts at Biscayne National Park, Montastraea cavernosa coral at Dry Tortugas National Park, Alligators at Anhinga Trail in Everglades National Park NPS Photos
South Florida / Caribbean Network Vital Signs Monitoring Plan Natural Resource Report NPS/SFCN/NRR—2008/063 Matt E. Patterson1 Andrea J. Atkinson1 Brian D. Witcher1 Kevin R.T. Whelan1 W. Jeff Miller2 Rob J. Waara1 Judd M. Patterson1 Ben I. Ruttenberg1 Andy D. Davis2 Raul Urgelles1 Robert B. Shamblin1 1
National Park Service South Florida/Caribbean Network 18001 Old Cutler Rd., Suite 419 Village of Palmetto Bay, FL 33157
2
National Park Service South Florida / Caribbean Network Virgin Islands National Park 1300 Cruz Bay Creek St. John, VI 00830
September 2008 U.S. Department of the Interior National Park Service Natural Resource Program Center Fort Collins, Colorado
The Natural Resource Publication series addresses natural resource topics that are of interest and applicability to a broad readership in the National Park Service and to others in the management of natural resources, including the scientific community, the public, and the NPS conservation and environmental constituencies. Manuscripts are peer-reviewed to ensure that the information is scientifically credible, technically accurate, appropriately written for the intended audience, and is designed and published in a professional manner. Natural Resource Reports are the designated medium for disseminating high priority, current natural resource management information with managerial application. The series targets a general, diverse audience, and may contain NPS policy considerations or address sensitive issues of management applicability. Examples of the diverse array of reports published in this series include vital signs monitoring plans; monitoring protocols; "how to" resource management papers; proceedings of resource management workshops or conferences; annual reports of resource programs or divisions of the Natural Resource Program Center; resource action plans; fact sheets; and regularlypublished newsletters. Views, statements, findings, conclusions, recommendations and data in this report are solely those of the author(s) and do not necessarily reflect views and policies of the U.S. Department of the Interior, National Park Service. Mention of trade names or commercial products does not constitute endorsement or recommendation for use by the National Park Service. Printed copies of reports in these series may be produced in a limited quantity and they are only available as long as the supply lasts. This report is also available from the South Florida / Caribbean Network website (http://science.nature.nps.gov/im/units/sfcn/) on the Internet or by sending a request to the address on the back cover. Please cite this publication as: Patterson, M. E., A. J. Atkinson, B. D. Witcher, K.R.T. Whelan, W. J. Miller, R. J. Waara, J. M. Patterson, B. I. Ruttenberg, A. D. Davis, R. Urgelles, R. B. Shamblin. 2008. South Florida / Caribbean Network Vital Signs Monitoring Plan. Natural Resource Report NPS/SFCN/NRR—2008/063. National Park Service, Fort Collins, Colorado.
NPS D-105, September 2008
ii
iii
Table of Contents LIST OF TABLES .................................................................................................................. viii LIST OF FIGURES................................................................................................................... ix EXECUTIVE SUMMARY ........................................................................................................ xi ACKNOWLEDGEMENTS ...................................................................................................... xv CHAPTER 1: INTRODUCTION AND BACKGROUND ............................................................ 1 1.1 1.2 1.3 1.4 1.5
PURPOSE OF A MONITORING PROGRAM .................................................................... 1 OVERVIEW OF THE SOUTH FLORIDA/CARIBBEAN NETWORK (SFCN) ............................. 5 PARK NATURAL RESOURCES AND MANAGEMENT PRIORITIES ..................................... 23 DESIGNING AN INTEGRATED MONITORING PROGRAM FOR THE SFCN......................... 25 SUMMARY OF CURRENT MONITORING WITHIN AND SURROUNDING THE NETWORK ...... 30
CHAPTER 2: CONCEPTUAL MODELS ................................................................................. 35 2.1 2.2 2.3 2.4 2.6
INTRODUCTION..................................................................................................... 35 FRESHWATER WET PRAIRIES AND MARSHES ECOLOGICAL ZONE .................................. 40 FOREST UPLANDS AND WETLANDS ZONE ................................................................ 47 ISLAND INTERIOR ECOLOGICAL ZONE ...................................................................... 52 FLORIDA AND BISCAYNE BAYS ECOLOGICAL ZONE ................................................... 64
CHAPTER 3: VITAL SIGNS .................................................................................................. 73 3.1 3.2 3.3 3.4 3.5
INTRODUCTION..................................................................................................... 73 PROCESS FOR CHOOSING VITAL SIGNS .................................................................... 73 VITAL SIGNS FOR THE SOUTH FLORIDA / CARIBBEAN NETWORK ................................. 75 LINKS OF VITAL SIGNS TO CONCEPTUAL MODELS ..................................................... 76 SFCN CATEGORY 1 VITAL SIGNS AND RELATIONSHIP BETWEEN THE NETWORK, PARKBASED, AND EXTERNAL AGENCY MONITORING ACTIVITIES .................................... 83
CHAPTER 4: SAMPLING DESIGN........................................................................................ 89 4.1 4.2 4.3 4.4 4.5
INTRODUCTION..................................................................................................... 89 BASIC CONCEPTS AND TERMINOLOGY ..................................................................... 90 EPISODIC MONITORING .......................................................................................... 94 MINIMUM SAMPLE SIZE REQUIRED FOR DETECTING A TREND ..................................... 94 OVERVIEW OF SFCN SAMPLING DESIGNS ................................................................ 94
CHAPTER 5: SAMPLING PROTOCOLS .............................................................................. 123 5.1 5.2 5.3
PROTOCOL DEVELOPMENT AND SFCN ROLE RELATIVE TO EXISTING PROGRAMS ........ 123 PROTOCOL DEVELOPMENT SUMMARIES ................................................................ 124 PROTOCOL WORK COMPLETED ............................................................................. 124
CHAPTER 6: DATA MANAGEMENT ................................................................................. 131 6.1 6.2 6.3 6.4 6.5 6.6 6.7
THE SFCN DATA MANAGEMENT PLAN ................................................................. 131 DATA SOURCES AND PRIORITIES ........................................................................... 132 DATA MANAGEMENT CATEGORIES ....................................................................... 133 DATA MANAGEMENT AND THE PROJECT LIFECYCLE ................................................ 134 WATER QUALITY DATA ...................................................................................... 134 DATA MANAGEMENT PLAN MAINTENANCE ........................................................... 136 IMPLEMENTATION ............................................................................................... 136
v
South Florida / Caribbean Network Vital Signs Monitoring Plan
CHAPTER 7: DATA ANALYSIS AND REPORTING ............................................................ 137 7.1 7.2 7.3 7.3.3 7.3.4
STRATEGIES AND KEY AUDIENCES FOR ANALYSIS AND REPORTING OF MONITORING RESULTS............................................................................................................ 139 DATA ANALYSIS ................................................................................................ 141 COMMUNICATIONS AND REPORTING ..................................................................... 141 RESOURCE BRIEFS............................................................................................... 146 ANALYSIS AND SYNTHESIS REPORTS ..................................................................... 146
CHAPTER 8: ADMINISTRATION / IMPLEMENTATION OF THE MONITORING PROGRAM ................................................................................................................... 149 8.1 8.2 8.3 8.4 8.5 8.6 8.7
INTRODUCTION .................................................................................................. 149 CORE DUTIES ..................................................................................................... 149 ADMINISTRATION ............................................................................................... 150 STAFFING PLAN .................................................................................................. 150 PROGRAM INTEGRATION ..................................................................................... 156 PARTNERSHIPS ................................................................................................... 157 REVIEW AND REVISIONS ...................................................................................... 159
CHAPTER 9: SCHEDULE.................................................................................................... 161 9.1 9.2
STARTUP SCHEDULE IS PHASED ............................................................................. 161 PROGRAMMATIC REVIEWS ................................................................................... 162
CHAPTER 10: BUDGET ..................................................................................................... 167 CHAPTER 11: LITERATURE CITED .................................................................................... 169 APPENDIX A APPENDIX B APPENDIX C APPENDIX D APPENDIX E APPENDIX E.1 APPENDIX E.2 APPENDIX E.3 APPENDIX E.4 APPENDIX E.5 APPENDIX E.6 APPENDIX E.7 APPENDIX F APPENDIX F.1 APPENDIX F.2
APPENDIX G APPENDIX H APPENDIX H.1 APPENDIX H.2 APPENDIX H.3 APPENDIX H.4 APPENDIX H.5 APPENDIX H.6 APPENDIX H.7
ACRONYMS GLOSSARY SUMMARY OF LEGISLATION AND OTHER FEDERAL MANDATES RELEVANT TO THE VITAL SIGNS MONITORING PROGRAM REGIONAL MAPS GEOLOGIC RESOURCE MANAGEMENT ISSUES SCOPING SUMMARIES BIG CYPRESS NATIONAL PRESERVE BISCAYNE NATIONAL PARK BUCK ISLAND REEF NATIONAL MONUMENT DRY TORTUGAS NATIONAL PARK EVERGLADES NATIONAL PARK SALT RIVER BAY NATIONAL HISTORICAL PARK AND ECOLOGICAL PRESERVE VIRGIN ISLANDS NATIONAL PARK AND CORAL REEF NATIONAL MONUMENT WATER RESOURCES 303(D) LIST OF IMPAIRED WATER RESOURCES WITH IN THE SOUTH FLORIDA/CARIBBEAN NETWORK CURRENT WATER QUALITY MONITORING PROGRAMS WITHIN THE SOUTH FLORIDA/ CARIBBEAN NETWORK AND REVIEW OF REGIONAL HYDROLOGY SUMMARIES SCOPING SUMMARY SFCN NETWORK MANAGEMENT ISSUES ONGOING NATURAL RESOURCE MONITORING BIG CYPRESS NATIONAL PRESERVE BISCAYNE NATIONAL PARK BUCK ISLAND REEF NATIONAL MONUMENT DRY TORTUGAS NATIONAL PARK EVERGLADES NATIONAL PARK SALT RIVER BAY NATIONAL HISTORICAL PARK AND ECOLOGICAL PRESERVE VIRGIN ISLANDS NATIONAL PARK AND CORAL REEF NATIONAL MONUMENT
vi
Table of Contents
APPENDIX I APPENDIX I.1 APPENDIX I.2 APPENDIX J APPENDIX J.1 APPENDIX J.2 APPENDIX J.3 APPENDIX J.4 APPENDIX J.5 APPENDIX J.6 APPENDIX J.7 APPENDIX J.8 APPENDIX J.9 APPENDIX J.10 APPENDIX J.11 APPENDIX K APPENDIX L APPENDIX L.1 APPENDIX L.2 APPENDIX L.3 APPENDIX L.4 APPENDIX L.5 APPENDIX L.6 APPENDIX L.7 APPENDIX M APPENDIX N APPENDIX O APPENDIX O.1 APPENDIX O.2 APPENDIX O.3 APPENDIX O.4 APPENDIX O.5 APPENDIX O.6 APPENDIX P APPENDIX Q APPENDIX R
CLIMATE/AIR QUALITY MONITORING AIR QUALITY MONITORING CONSIDERATIONS FOR THE SOUTH FLORIDA/CARIBBEAN NETWORK WEATHER AND CLIMATE INVENTORY CONCEPTUAL ECOLOGICAL MODELS INTRODUCTION TO SFCN CONCEPTUAL MODELS SFCN REGION-WIDE OVERVIEW FRESHWATER WET PRAIRIES AND MARSHES ECOLOGICAL ZONE FOREST UPLANDS AND WETLANDS ECOLOGICAL ZONE ISLAND INTERIOR ECOLOGICAL ZONE COASTAL WETLANDS ECOLOGICAL ZONE FLORIDA AND BISCAYNE BAYS ECOLOGICAL ZONE COASTAL SHELF AND DEEP OCEANIC ECOLOGICAL ZONE MARINE BENTHIC COMMUNITIES SUB-MODEL PARK-SPECIFIC CONCEPTUAL MODELS LITERATURE CITED SFCN FEDERAL, STATE, AND TERRITORIAL ENDANGERED SPECIES, THREATENED SPECIES, AND SPECIES OF SPECIAL CONCERN AVIAN CONSERVATION IMPLEMENTATION PLANS BIG CYPRESS NATIONAL PRESERVE BISCAYNE NATIONAL PARK BUCK ISLAND REEF NATIONAL MONUMENT DRY TORTUGAS NATIONAL PARK EVERGLADES NATIONAL PARK SALT RIVER BAY NATIONAL HISTORICAL PARK AND ECOLOGICAL RESERVE VIRGIN ISLANDS NATIONAL PARK AND CORAL REEF NATIONAL MONUMENT INVASIVE PLANT SPECIES IN (OR NEAR) SFCN PARKS NON-NATIVE FAUNA SPECIES IN (OR NEAR) SFCN PARKS SUMMARY OF INDICATOR IDENTIFICATION AND RANKING PROCESS VITAL SIGNS INDICATOR IDENTIFICATION WORKSHOPS LIST OF PARTICIPANTS VITAL SIGNS INDICATOR IDENTIFICATION WORKSHOPS LIST OF PARTICIPANTS IN THE SFCN WEB-BASED RANKING PROCESS WEB-BASED RANKING INSTRUCTIONS VITAL SIGNS RANKING MEETING SUMMARY SFCN INDICATOR WORKSHEETS VITAL SIGN STRATEGIES PROTOCOL DEVELOPMENT SUMMARIES DATA MANAGEMENT PLAN
vii
South Florida / Caribbean Network Vital Signs Monitoring Plan
List of Tables Table A. Table 1-A. Table 1-B. Table 1-C. Table 1-D. Table 2-A. Table 3-A. Table 3-B. Table 3-C. Table 3-D. Table 3-E. Table 4-A. Table 4-B. Table 4-C. Table 4-D. Table 4-E. Table 5-A. Table 5-B. Table 6-A. Table 7-A. Table 7-B. Table 7-C. Table 8-A. Table 9-A. Table 9-B. Table 9-C. Table 10-A.
Vital signs for the South Florida / Caribbean I&M Network ………………….. xii Five NPS service-wide Vital Signs monitoring goals ……………………….......... 2 Enabling Legislation ……………………………………………………………… 5 303(d) List of impaired water resources within South Florida / Caribbean Network parks ……………………………..…………………………………....... 12 Vital Signs and general monitoring questions …………………………………... 28 South Florida and Caribbean Ecological Zones and related network parks .….. 36 Summary of steps taken in identifying and prioritizing SFCN Vital Signs ……... 74 SFCN Vital Signs and measures in national framework by level of funding …… 77 Linkages of Vital Signs to valued resources and key issues (physical drivers and stressors from conceptual models ………………..………………………………. 81 SFCN Category 1 Vital Signs ……………………………………………………... 83 SFCN role for each Vital Sign component ………………………………….……. 85 SFCN Category 1 vital signs showing co-located/co-visited vital signs ………… 95 Plan for ecotone monitoring ……………………………………………………… 100 Plan for long-term within-community monitoring plots ...……………………… 100 Summary of physical and water quality stations in SFCN parks ………………. 104 Sampling design components for SFCN Vital Signs ……………………….……. 113 SFCN protocols to be developed in Oakley et al. (2003) format sorted by year due …………….…………………………………………………………….……… 124 SFCN protocols with relevant vital signs, justifications, monitoring objectives and year due ………………………………………………………….…………… 125 Data that are provided on the SFCN and national I&M websites ……………… 132 Four general categories of analysis for SFCN vital signs and the individuals responsible for analysis …………………………………………………….……… 142 Types of written reports produced by SFCN …………………………….………. 143 Presentations of SFCN results to park staff …………………………..………….. 145 Short descriptions of SFCN positions and their primary functions ……………. 153 Target completion years for each protocol or Vital Sign component reporting coupled with main task that will be completed ………………..……………….. 162 Development schedule for each protocol ……………………………………….. 164 General estimate of months during which data collection could occur for SFCN protocols …………………………………………………………….…………….. 165 Summary SFCN Vital Signs Monitoring Budget....... …………………………….. 168
viii
Table of Contents
List of Figures Figure A. Goals of Vital Signs monitoring …………………………………………..……… x Figure 1-A. Stewardship of natural resources in national parks involves the interconnected activities of inventories, monitoring, research, and resource management …… 2 Figure 1-B. Map of South Florida/Caribbean Network and associated NPS units ………..... 6 Figure 1-C. Historical pattern of water flow from Lake Okeechobee through Everglades to Florida Bay and Gulf of Mexico …………………………………………..…… 9 Figure 1-D. Big Cypress National Preserve ………………………………………………..…... 14 Figure 1-E. Biscayne National Park ……………………………………………………….…… 15 Figure 1-F. Buck Island Reef National Monument …………………………………….……... 16 Figure 1-G. Dry Tortugas National Park ………………………………………………..……… 18 Figure 1-H. Everglades National Park ………………………………………………….……… 19 Figure 1-I. Salt River Bay National Historical Park and Ecological Preserve ………………… 21 Figure 1-J. Virgin Islands National Park ………………………………………….…………… 22 Figure 2-A. Key components of management-Figure 2-A. Key components of management-oriented conceptual models …………………………..………….. 37 Figure 2-B. Inter-relationships among south Florida and Caribbean Network conceptual models and sub-models ……………………………………………….………….. 38 Figure 2-C. South Florida / Caribbean Network Ecological Zones ……………..……………. 39 Figure 2-D. South Florida wet prairies and marshes ecological zone conceptual model diagram ……………………………………………………………….…………… 45 Figure 2-E. Wet prairies and marshes food web ……………………………………………... 46 Figure 2-F. Florida Forested uplands and wetlands ecological zone conceptual model diagram ………………………………………………………………………….… 51 Figure 2-G. Island interior ecological zone conceptual model diagram …………………….. 55 Figure 2-H. Island interior food web …………………………………………………….…… 56 Figure 2-I. Coastal wetlands ecological zone conceptual model diagram ………………… 62 Figure 2-J. Mangrove estuarine effects on food web ………………………………….……. 63 Figure 2-K. Florida and Biscayne Bays Ecological Zone conceptual model diagram …….…. 67 Figure 2-L. Simplified conceptual model of marine community food web in south Florida and Caribbean parks …..………………………………………………………….. 68 Figure 2-M. Coastal Shelf / Deep Oceanic Ecological Zone conceptual model diagram …… 72 Figure 4-A. Examples of different sampling panel designs distributing effort through space and time …………………………………………………………………… 93 Figure 4-B. Big Cypress National Preserve water quality monitoring stations ………..…….. 105 Figure 4-C. Biscayne National Park water quality monitoring stations ………………..……. 106 Figure 4-D. Everglades National Park water quality monitoring stations …………..……….. 107 Figure 4-E. Dry Tortugas National Park water quality monitoring stations …………..…….. 108 Figure 4-F. Buck Island Reef National Monument water quality monitoring stations ..……. 109 Figure 4-G. Salt River Bay National Historic Park and Ecological Preserve water quality monitoring stations ……………………………………………………….………. 110 Figure 4-H. Virgin Islands National Park water quality monitoring stations …………..……. 111 Figure 4-I. SFCN webpage disseminating regional water summary reports ………..……… 112 Figure 6-A. Model of data lifecycle stages ……………………………………………..…….. 135 Figure 6-B. Data flow diagram for water quality data ……………………………………… 135 Figure 7-A. Expected SFCN data sources and key audiences …………………………..…… 140 Figure 8-A. Current makeup of the South Florida/Caribbean I&M Network Board of Directors and Science and Technical Committee …………………….…………. 150 Figure 8-B. Five broad program functions encompassing SFCN activities …………………. 151 Figure 8-C. South Florida/Caribbean Network Organizational Chart ……………………… 152
ix
South Florida / Caribbean Network Vital Signs Monitoring Plan
Executive Summary Knowing the condition of natural resources in national parks is fundamental to the National Park Service's (NPS) mission to manage park resources "unimpaired for the enjoyment of future generations." Park managers are confronted with increasingly complex and challenging issues that require a broad-based understanding of the status and trends of park resources as a basis for making decisions and working with other agencies and the public for the long-term protection of park ecosystems. The National Park Service has initiated a longterm ecological monitoring program, known as “Vital Signs Monitoring”, to provide the minimum infrastructure needed to track the overall condition of natural resources in parks and to provide early warning of situations that require intervention (see Figure A). The scientifically sound information obtained through this systems-based monitoring program will have multiple applications for management decision-making, park planning, research, education, and promoting public understanding of park resources.
monitoring programs. Funding for the SFCN supports a core, professional staff who conduct the day-to-day activities of the network and who collaborate with staff from the seven parks and other programs and agencies to implement an integrated long-term program to monitor the highest-priority vital signs. This vital signs monitoring plan is the foundation for a long-term, ecological monitoring program that has been designed to build upon existing information and understanding of park ecosystems and to make maximum use of leveraging and partnerships with other programs, agencies, and academia. The plan is the result of a multi-year investment in planning and design to ensure that monitoring will meet the most critical information needs and produce ecologically relevant and scientifically credible data that are accessible to park managers, planners, and other key users of the monitoring results. The first planning steps involved compiling and organizing relevant science information, conducting detailed park scoping to identify the most important resources and issues for each park, and determining what was already being monitored by
To facilitate collaboration, information sharing, and economies of scale in inventory and monitoring, the NPS organized the more than 270 parks with significant natural resources into 32 ecoregional networks. The South Florida/ Caribbean Inventory and Monitoring Network (SFCN) is composed of seven parks in South Florida and the U. S. Virgin Islands: Big Cypress National Preserve (BICY), Biscayne National Park (BISC), Buck Island Reef National Monument (BUIS), Dry Tortugas National Park (DRTO), Everglades National Park (EVER), Salt River Bay National Historical Site and Ecological Preserve (SARI), and Virgin Islands National Park (VIIS). The network monitoring program is designed to complement, not replace, existing park and other agency
xi
Endangered wood stork at Anhinga Trail, EVER. (Photo by I. Atkinson)
South Florida / Caribbean Network Vital Signs Monitoring Plan
Goals of Vital Signs Monitoring
Figure A. Goals of Vital Signs Monitoring.
•
Determine the status and trends in selected indicators of the condition of park ecosystems to allow managers to make better-informed decisions and to work more effectively with other agencies and individuals for the benefit of park resources.
•
Provide early warning of abnormal conditions of selected resources to help develop effective mitigation measures and reduce costs of management.
•
Provide data to better understand the dynamic nature and condition of park ecosystems and to provide reference points for comparisons with other, altered environments.
•
Provide data to meet certain legal and congressional mandates related to natural resource protection and visitor enjoyment.
•
Provide a means of measuring progress towards performance goals.
others. Chapter 1 and associated appendixes summarize the results of these scoping efforts, and provide an overview of the ecological and geographical settings of the network parks. The policy and management context for the monitoring program, including the goals and broad objectives for the SFCN monitoring effort, are also summarized in Chapter 1.
sampling for vital signs will be co-located in space and time to improve efficiency and depth of ecological understanding. SFCN will use existing programs and data wherever available and take advantage of regional applications for many vital signs to help put the data into context and to leverage the core SFCN funding and staff. Over the next several years, network staff and collaborators will develop 12 monitoring protocols (Chapter 5) to address those vital signs for which SFCN staff will play a lead role in field data collection as well as analysis and reporting of the monitoring results. Monitoring protocols are detailed study plans that explain how data are to be collected, managed, analyzed, and reported, and are a key component of quality assurance for a long-term monitoring program.
A second important planning step was to develop conceptual ecological models of the predominant ecosystems associated with SFCN parks (Chapter 2). The models of key ecosystem drivers, stressors, and responses were used to identify and prioritize vital signs and to design monitoring protocols. Using the results of the early planning and design work, more than 100 participants evaluated and ranked potential vital signs, resulting in a high-priority list of 44 vital signs (Chapter 3) of which 34 will be monitored longterm by the SFCN, park staff, or collaborating programs and agencies (see Table A).
Data and information management is central to the SFCN I&M program, and a key to the network's success. The SFCN will follow procedures outlined in the Data Management Plan (Appendix Q) and summarized in Chapter 6 to assure and maintain data integrity. Data management quality assurance procedures include the acquisition, verification, validation, analysis, and dissemination of monitoring data. In addition, we describe storage, maintenance, and security issues that apply to all stages of the data flow.
Chapter 4 provides an overview of general sampling design issues and describes how sampling locations will be chosen for each vital sign and how the sampling effort will be rotated through time among locations. Since many of the SFCN’s Vital Signs are already being monitored by other programs, the SFCN’s role in the sampling design is limited. Where possible,
xii
Executive Summary
Data analysis and reporting are key components in the development and implementation of the SFCN monitoring program. Network staff will play an important role in compiling, analyzing, synthesizing, and reporting monitoring results, including analysis and reporting of data collected by others to make the data more available and useful to park mangers, planners, and other key audiences. The specific proposed strategies for reporting each vital sign are outlined in Appendix P and Chapter 7 provides an overview of the procedures that the SFCN will use to analyze and report monitoring results, and examples of various products of the monitoring effort. The SFCN internet and intranet websites will be used as a clearinghouse to disseminate technical reports, briefing statements, monitoring protocols, and links to additional sources of data and information.
Science and Technical Committee (Chapter 8), and is also accountable to the NPS Associate Director through the regional and national I&M program manager. The Board of Directors includes the superintendents of the network parks, as well as the Regional I&M Coordinator for the Southeast Region and the network coordinator. The Board makes decisions regarding the development and implementation of the network’s monitoring strategy, including approval of annual budgets, work plans, and network staffing plans, and promotes overall accountability for the network monitoring program. The SFCN Science and Technical Committee, which includes the network coordinator, resource management chiefs for the seven parks, and the CESU coordinator for South Florida and the Caribbean, helps the network to develop the annual work plan, ensures that network activities dovetail with park activities, and provides input for issues that require Board of Directors approval. The network charter outlines these various roles and responsibilities.
The network relies on two groups to provide program oversight and guidance, the Board of Directors and the SFCN
Red hind on boulder star coral at Newfound Bay, St. John, USVI.
xiii
South Florida / Caribbean Network Vital Signs Monitoring Plan
Table A. Vital signs for the South Florida/Caribbean I&M Network. Vitals signs for which the network will develop protocols and implement monitoring using funding from the vital signs or water quality monitoring programs are indicated by [+ symbol]. The remaining vital signs will be monitored by a network park, another NPS program, or by another federal or state agency using other funding [◊]. The network will collaborate with these other monitoring efforts
Air & Climate Geology & Soils Water
Biological Integrity
Location, size, duration, type of algal bloom events Species detected at common invasion points
Invasive/Exotic Animals
Invasive fish species in canals and invasion points
Marine Benthic Communities
Coral % live cover, seagrass density, species diversity, community structure, disease incidence Community composition and structure
Mangrove-Marsh Ecotone
+
+
+
◊
◊
+
◊ ◊
◊ ◊ ◊
+
◊
+
◊
◊ ◊
◊ ◊
◊
◊
◊
◊
◊ ◊ ◊ ◊ ◊
◊ ◊
+
+
+
◊
◊
◊
+ +
+
+
+
◊
+
+
+
+
+
+
◊
◊
+
+
+
+
+
+
+
+
+
+
+
+
+
+
+
+
◊
+
+
◊
◊
◊
◊
◊
◊
Freshwater fish and large macro-invertebrates American Alligator Amphibians
+
Colonial Nesting Birds
Location, size of colonies by species, fledging success
◊
Marine Invertebrates-Rare Threatened, Endangered Sea Turtles
Species dependent (Acropora sp., Diadema, Antipathes sp.) Nest counts and distribution, egg counts/nest, hatching success Abundance, nests/region, size Distribution, abundance, size, condition (manatees, dolphins) Abundance, distribution, recruitment, mortality Distribution, relative abundance, recruitment Distribution and abundance of visitors Fire location, size, time since last burn Extent, distribution, shape, orientation of vegetation community types using remote sensing Extent and distribution of benthic community types using remote sensing. Land use change, permitting/zoning changes
xiv
+
+
Goliath Grouper, Sharks, Spotted Sea trout, Snook relative abundance, distribution, size structure Community composition, abundance (density and relative abundance), size structure Density, sex and age ratio distribution, community composition
Florida panther Sawfish Visitor Use Fire Return Interval Vegetation Communities Extent & Distribution Benthic Communities Extent & Distribution Land Use Change
+
+
Focal Fish Species
Lobster spatial/temporal distribution, abundance/density, size structure Community composition, abundance (density,relative abundance), MBI Fish community composition, abundance, diversity
◊
◊ ◊
◊
+ +
Wet prairie-forest ecotones change Community composition & structure
◊
+
Wetland Ecotones and Community Structure Forest Ecotones and Community Structure Marine Exploited Invertebrates Aquatic invertebrates in wet prairies & marshes Marine Fish Communities
American Crocodile Protected Marine mammals
Human use Landscapes (Ecosystem Pattern and Processes)
◊ ◊
VIIS
Phytoplankton (Marine) Invasive/Exotic Plants
SARI
Estuarine salinity patterns Water Chemistry Nutrient Dynamics Periphyton (Freshwater)
EVER
Surface Water Hydrology
Water stage, flow, timing, and duration, freshwater discharge to estuaries, rainfall Conductivity patterns in bays DO, pH, temperature, conductivity, organic carbon Nitrogen, Phosphorous Community composition and structure
DRTO
Example Measures Wet/dry deposition of anions, cations Mercury deposition Soil elevation change
BUIS
Vital Sign Air quality-Deposition Air quality-Mercury Coastal Geomorphology
BISC
Vital Signs Category
BICY
Parks where Implemented
◊
+
◊
◊
◊
+
+
◊
+
◊
◊
+
+
+
◊
◊
◊
+
+
◊
◊
◊
◊ ◊
◊
◊
◊ ◊ ◊ ◊
+
+
+
+
+
+
+
+ ◊
◊
+
+
◊
◊
◊ ◊ ◊
◊
◊
◊
◊
◊
+
+
+
+
+
+
+
+
Acknowledgements The South Florida/Caribbean Inventory and Monitoring network would like to thank all those that have helped develop this report. Special thanks to Rafe Boulon, Amanda Bourque, Ron Clark, Rick Clark, Richard Curry, Carol Daniels, Zandy Hillis-Starr, Bob Howard, Elsa Alvear, Carol Mitchell, David Hallac and Bob Johnson for their past and continued efforts as the network’s Science and Technical Committee. Thanks to Linda Canzanelli, Carol Clark, Art Frederick, Karen Gustin, Dan Kimball, Mark Lewis, Joel Tutein, Mark Hardgrove and Larry West for their past and continued support as the network Board of Directors. We couldn’t have produced this document without the help of (in no particular order) Alexandra Wright, Lindsay Wieland, Eric Sudalter, Jonathon Moser, Chris Ringewald, Britton Wilson, Caroline Rogers, Dan Clark, Sarah Bellmund, Tonnie Maniero, Bruce Heise, Rebecca Beavers, Tim Connors, Sid Covington, Lisa Norby, Trista L. Thornberry-Ehrlich, Kim Nelson, Dave Eaken, Janet Klemm, Walt Jaap, Jennifer Wheaton, Tony Pernas, Keith Watson, Cherry Green, Todd Kellison, Shelby Moneysmith, Max Tritt, Craig Smith, Skip Snow, Sonny Bass, Bill Perry, Sue Perry, Todd Haymore, Tom Schmidt, Dewitt Smith, Douglas Morrison, Kevin Kotun, Bill Loftus, Ken Rice, Linda Irey, Connie Barahona, Cliff McCreedy, Mark Monaco, Kathy Harris, Joe DeVivo, Andy Hubbard, Miriam Luchans, Inga Parker, Janine Turbe, Nancy Russell, Kathleen Batke, Randy Effert, Gregg DeFilicibus, Bruce Blackistone, John Brock, Melanie Harris, Amar Negandi, Ron Sjoken, Jimi Sidle, George Gann, Keith Bradley, Vic Engle, T. Rick Anderson, Jeff Kline, Mike Zimmerman, Jim Burch, Deborah Jansen, Thomas Kelly, Sherri Caseau, Janice Lynch, Christy Loomis, Darrell Tidwell, David Buker, Bob Zepp, Tom J Smith III, Jonathan Taylor, Frank Partridge, Paul Teague, Troy Mullins, Hardin Waddle, Brian Jefferies, Jerry Lorenz, Jim Snyder,
Mike Gaines, Richard Dodge, Richard Spieler, Python Pete, Lori Oberhofer, Steve Woodmansee, Lauren Raz, Lynka Woodbury, John Pipoly, Stinger Guala, Gary Davis, Jim Tilmant, Don Catanzero, Jim Petterson, Kimberly Woody, Phillipe Mayor, Brendalee Phillips, Jerry Ault, Brian Keller, Cheva Heck, Steve Baumgartner, John Hunt, Monika Mayr, Lynn Cox, Brian Fields, Cheri Vitez, Tom Phillipi, Robert Doren, Joel Trexler, Dave Rudnick, Williams Gandy, and Ashley Brehm. Special thanks to the friends and families of SFCN staff that dealt with our frazzled wits during the more difficult periods of this report preparation. Symbols for diagrams courtesy of the Integration and Application Network (ian.umces.edu/symbols), University of Maryland Center for Environmental Science. SFCN wishes to gratefully acknowledge the work of other Inventory and Monitoring Program Networks that we used as examples, and in some cases pulled materials from, to help create this report, especially, Appalachian Highlands Network (APHN), Central Alaska Network (CAKN), Northern Colorado Plateau Network (NCPN), Sierra Nevada Network (SIEN), Sonoran Desert Network (SODN), Southern Plains Network (SOPN) and Southwest Alaska Network (SWAN). Special thanks for the fine executive summary developed by Dr. Steve Fancy!
xv
South Florida / Caribbean Network Vital Signs Monitoring Plan
Chapter 1: Introduction and Background 1.1
Purpose of a Monitoring Program
Knowing the condition and trends of natural resources in national parks is fundamental to the National Park Service’s ability to manage park resources “unimpaired for the enjoyment of future generations.” National Park managers across the country are confronted with increasingly complex and challenging issues that require a broad-based understanding of the status and trends of park resources as a basis for making decisions, and for working with other agencies and the public for the benefit of park resources. Monitoring is a central component of natural resource stewardship in the National Park Service (NPS). Natural resource monitoring offers park-specific information needed to understand and identify change in complex, variable, and imperfectly understood natural systems and to determine whether observed changes are within natural levels of variability or may be indicators of unwanted human influences. Thus, monitoring provides a basis for understanding and identifying meaningful change in natural systems (Roman and Barrett 1999).
Tektite reef at Virgin Islands National Park, St. John, U.S. Virgin Islands (2003).
“Vital signs,” as defined by the NPS, are a subset of physical, chemical, and biological elements and processes of park ecosystems that are selected to represent the overall health or condition of park resources or elements that have important human values. The elements and processes that are monitored are a subset of the total suite of natural resources that park managers are directed to preserve “unimpaired for future generations,” including water, air, geological resources, plants and animals, and the various ecological, biological, and physical processes that act on those resources. The broad based, scientifically sound information obtained through natural resource monitoring will have multiple applications for management decisionmaking, research, education, and promoting public understanding of park resources.
The South Florida/Caribbean Network Vital Signs Monitoring Plan describes the process for selection of and the plan for monitoring “vital signs” of the natural resources in the following parks: • Big Cypress National Preserve (BICY) • Biscayne National Park (BISC) • Buck Island Reef National Monument (BUIS) • Dry Tortugas National Park (DRTO) • Everglades National Park (EVER) • Salt River Bay National Historical Park and Ecological Preserve (SARI) • Virgin Islands National Park (VIIS)
1.1.1 Service-wide Monitoring Goals The overall goal of natural resource monitoring in parks is to develop
1
South Florida / Caribbean Network Vital Signs Monitoring Plan
Table 1-A. Five NPS service-wide Vital Signs monitoring goals. 1)
Determine the status and trends in selected indicators of the condition of park ecosystems to allow managers to make better-informed decisions and to work more effectively with other agencies and individuals for the benefit of park resources.
2)
Provide early warning of abnormal conditions of selected resources to help develop effective mitigation measures and reduce costs of management.
3)
Provide data to better understand the dynamic nature and condition of park ecosystems and to provide reference points for comparisons with other, altered environments.
4)
Provide data to meet certain legal and congressional mandates related to natural resource protection and visitor enjoyment.
5)
Provide a means of measuring progress towards performance goals.
scientifically sound information on the current status and long-term trends in the composition, structure, and function of park ecosystems, and to determine how well current management practices are sustaining those ecosystems. The five NPS service-wide Vital Signs monitoring goals are listed in Table 1-A.
plants, animals, and abiotic components such as water, soils, landforms, and climate. Such inventories typically provide important information for the development of monitoring programs. Monitoring differs from inventories by adding the dimension of time; the general purpose of monitoring is to detect changes or trends in a resource. Elzinga et al. (1998) defined monitoring as, “the collection and analysis of repeated observations or measurements to evaluate changes in condition and progress toward meeting a management objective.” Detection of a change or trend may trigger a management action, or it may generate a new line of inquiry. Research is generally defined as the systematic collection of data that produces new knowledge or relationships and usually involves an
Inventories, monitoring, and research all generate information for effective, science-based managerial decisionmaking, resource protection and for communicating park concerns to government officials, agencies, and the public (see Figure 1-A). Natural resource inventories are extensive point-in-time efforts to determine the location or condition of a resource, including the presence, class, distribution, and status of
Figure 1-A. Stewardship of natural resources in national parks involves the interconnected activities of inventories, monitoring, research, and resource management (modified from Jenkins et al. 2002).
Inventory
Monitoring
Determines management effectiveness
Identifies trends & natural variation in resources
No
Change detected?
Yes Yes
Objective achieved?
Yes
No
Resource management
No Yes
Intervention needed?
2
Cause understood?
No
Research
Chapter 1: Introduction and Background
experimental approach, in which a hypothesis concerning the probable cause of an observation is tested in situations with and without the specified cause. A research design is usually required to determine the cause of changes observed by monitoring. The development of monitoring protocols also involves a research component to determine the appropriate spatial and temporal scale for monitoring.
(16 U.S.C. 1 § 1) established and defined the mission of the National Park Service, and through it, Congress implied the need to monitor natural resources and guarantee unimpaired park services: “The service thus established shall promote and regulate the use of the Federal areas known as national parks, monuments, and reservations hereinafter specified … by such means and measures as conform to the fundamental purpose of the said parks, monuments, and reservations, which purpose is to conserve the scenery and the natural and historic objects and the wild life therein and to provide for the enjoyment of the same in such manner and by such means as will leave them unimpaired for the enjoyment of future generations.”
Better-informed management decisions require an effective monitoring program (White and Bratton 1980, Croze 1982, Jones 1986, Davis 1989, Quinn and van Riper 1990). By monitoring data over long periods, correlations between different attributes become apparent, and resource managers, park researchers and the public in general gain a better general understanding of the ecosystem. Additionally, monitoring information can be used to convince others to make decisions benefiting national parks (Johnson and Bratton 1978, Croze 1982). Monitoring sensitive species, invasive species, culturally significant species, or entire communities can provide park managers, stakeholders, and the public with an early warning of the effects of human activities before they are noticed elsewhere (Wiersma 1984, Davis 1989), and hopefully before the impacts have permanently damaged the resource.
Congress reaffirmed the declaration of the Organic Act vis-à-vis the General Authorities Act of 1970 (16 U.S.C. 1a-1a8) and effectively ensured that all park units be united into the ‘National Park System’ by a common purpose of preservation, regardless of title or designation. In 1978, the National Park Service’s protective function was further strengthened when Congress again amended the Organic Act to state “…the protection, management, and administration of these areas shall be conducted in light of the high public value and integrity of the National Park System and shall not be exercised in derogation of the values and purposes for which these various areas have been established…” thus, further endorsing natural resource goals of each park. A decade later, park service management policy again reiterated the importance of this protective function of the NPS to “understand, maintain, restore, and protect the inherent integrity of the natural resources,” (NPS 2001).
1.1.2 Legislation, Policy, and Guidance for Natural Resource Monitoring In establishing the first national park in 1872, Congress “dedicated and set apart (nearly 1,000,000 acres of land) as a … pleasuring ground for the benefit and enjoyment of the people” (16 U.S.C. 1 § 21). By 1900, a total of five national parks had been established, along with additional historic sites, scenic rivers, recreation areas, monuments, and other designated units. Each unit was to be administered according to its individual enabling legislation, but had been created with a common purpose of preserving the “precious” resources for people’s benefit. Sixteen years later, the passage of the National Park Service Organic Act of 1916
More recent and specific requirements for a program of inventory and monitoring park resources are found in the National Parks Omnibus Management Act of 1998 (P.L. 105- 391). The intent of the Act is to create an inventory and monitoring
3
South Florida / Caribbean Network Vital Signs Monitoring Plan
program that may be used “to establish baseline information and to provide information on the long-term trends in the condition of National Park System resources.” Subsequently, in 2001, NPS management updated previous policy and specifically directed the Service to inventory and monitor natural systems in efforts to inform park management decisions:
mission, followed by performance measurement and evaluation. GPRA requires federal agencies to develop and use three primary documents in conducting business: a Strategic Plan, an Annual Performance Plan, and an Annual Performance Report. The creation of the South Florida/Caribbean Network (SFCN) Inventory and Monitoring Program is a significant step towards fulfilling GPRA Goal Category I (Preserve Park Resources) for network parks. The service-wide goal pertaining to Natural Resource Inventories specifically identifies the strategic objective of inventorying the resources of the parks as an initial step in protecting and preserving park resources (GPRA Goal Ib1). The service-wide long-term goal is to “acquire or develop 87% of the outstanding datasets identified in 1999 of basic natural resource inventories for all parks” based on the I&M (Inventory & Monitoring) program’s 12 basic datasets: • Natural resource bibliography • Base cartographic data • Air quality data • Air quality related values • Climate inventory • Geology resources inventory • Soil resources inventory • Water body location and classification • Baseline water quality data • Vegetation inventory • Species lists • Species occurrence and distribution
“Natural systems in the national park system, and the human influences upon them, will be monitored to detect change. The Service will use the results of monitoring and research to understand the detected change and to develop appropriate management actions” (NPS 2001). In addition to the legislation directing the formation and function of the National Park System, there are several other pieces of legislation intended to not only protect the natural resources within national parks and other federal lands, but to address concerns over the environmental quality of life in the United States generally. Many of these federal laws also require natural resource monitoring within national park units. As NPS units are among some of the most secure areas for numerous threatened, endangered or otherwise compromised natural resources in the country, the particular guidance offered by federal environmental legislation and policy is an important component to the development and administration of a natural resource inventory and monitoring system in the National Parks. Relevant federal legislation, executive orders, and NPS policies and guidance are summarized in Appendix C.
GPRA goal Ib1 tracks the basic natural resources information that is available to parks and performance is measured by what datasets are obtained. The SFCN Inventory Study Plan (Sasso and Patterson 2000) delineated what information exists for the network, its format and condition, and what information is missing.
1.1.3 SFCN Monitoring Plan and Performance Management Goals The Government Performance and Results Act (GPRA), passed by Congress in 1993, directs federal agencies to ensure that daily actions and expenditures of resources are guided by long- and shortterm goal setting in pursuit of accomplishing an organization’s primary
The SFCN Vital Signs Monitoring Plan identifies the monitoring indicators or “vital signs” of the network and presents a
4
Chapter 1: Introduction and Background
strategy for long-term monitoring to detect trends in resource condition. The long-term monitoring results will help network parks report to the Department of the Interior’s Land Health Goals for each park where data is available.
these designations have equal legal standing in the National Park System. The enabling legislation of an individual park provides insight into the natural and cultural resources and resource values for which it was created to preserve. Along with national legislation, policy and guidance, a park’s enabling legislation provides justification and, in some cases, specific guidance for the direction and emphasis of resource management programs, including inventory and monitoring. See Table 1-B for summaries of SFCN park enabling legislation.
1.1.4 SFCN Park Unit Enabling Legislation The SFCN includes four National Parks, one National Preserve, one National Monument, and one National Historical Park and Ecological Preserve. In 1970, Congress elaborated on the 1916 NPS Organic Act, clearly stating that all of Table 1-B. Enabling Legislation. Park Summary Content Big Cypress National Preserve (Est. 1974; Expanded 1988)
Be it enacted by the Senate and House of Representatives of the United States of America in Congress assembled, That in order to assure the preservation, conservation, and protection of the natural, scenic, hydrologic, floral and faunal, and recreational values of the Big Cypress Watershed in the State of Florida and to provide for the enhancement and public enjoyment thereof, the Big Cypress National Preserve is hereby established.
Biscayne National Park (Est. 1980)
In order to preserve and protect for the education, inspiration, recreation, and enjoyment of present and future generations a rare combination of terrestrial, marine, and amphibious life in a tropical setting of great natural beauty, there is hereby established the Biscayne National Park in the State of Florida.
Buck Island Reef National Monument (Est. 1961; Expanded 2001)
WHEREAS Buck Island and Its adjoining shoals, rocks, and undersea coral reef formations possess one of the finest marine gardens in the Caribbean Sea; and WHEREAS these lands and their related features are of great scientific interest and educational value to students of the sea and to the public; and WHEREAS this unique natural area and the rare marine life which are dependent upon it are subject to constant threat of commercial exploitation and destruction; and WHEREAS the Advisory Board on National Parks. Historic Sites. Buildings and Monuments, established pursuant to the act of August 21, 1935, 49 Stat. see (15 U.S-C- 4§3). Impressed by the caliber and scientific importance of the coral reefs of Buck Island, had urged their prompt protection to prevent further despoliation; 2001 Buck Island was expanded by Presidential Proclamation adding 18,035 acres of submerged lands.
Dry Tortugas National Park (Est. 1992)
In order to preserve and protect for the education, inspiration, and enjoyment of present and future generations nationally significant natural, historic, scenic, marine, and scientific values in South Florida, there is hereby established the Dry Tortugas National Park.
Everglades National Park (Est. 1947; Expanded 1989)
When title to all the lands within boundaries to be determined by the Secretary of the Interior within the area of approximately two thousand square miles in the region of the Everglades of Dade, Monroe, and Collier Counties, in the State of Florida, recommended by said Secretary, in his report to Congress of December 3, 1930, pursuant to the Act of March 1, 1929 (45 Stat. 1443), shall have been vested in the United States, said lands shall be, and are, established, dedicated, and set apart as a public park for the benefit and enjoyment of the people and shall be known as the Everglades National Park. In order to preserve, protect, and interpret for the benefit of present and future generations certain nationally significant historical, cultural, and natural sites and resources in the Virgin Islands, there is established the Salt River Bay National Historical Park and Ecological Preserve at St. Croix, Virgin Islands.
Salt River Bay National Historical Park and Ecological Preserve (Est. 1992) Virgin Islands National Park (Est. 1956; Expanded 1962)
A portion of the Virgin Islands of the United States, containing outstanding scenic and other features of national significance, shall be established, as prescribed in section 398a of this title, as the ''Virgin Islands National Park''.
5
South Florida / Caribbean Network Vital Signs Monitoring Plan
Figure 1-B. Map of South Florida/ Caribbean Network and associated NPS units.
1.2
designated to protect natural resources, although several were also designated to protect the associated cultural resources.
Overview of the South Florida/ Caribbean Network (SFCN)
The following sections describe the range of environmental conditions and anthropogenic influences prevalent in the South Florida/Caribbean Network including regional climate, geology, and hydrology, as well as descriptions of the individual parks within the SFCN network. See Appendix D for regional maps highlighting park boundaries and partner conservation areas bordering or near our network of parks.
South Florida is characterized by flat marshlands and wet prairies interspersed with tree islands; cypress swamps; pinelands; hardwood hammocks; broad mangrove forests; and coastal prairies. Relatively slight differences in elevation and landform have important consequences for vegetation and the diversity of habitat types. Despite portions of this region being protected as parks, conservation areas and refuges, most of the region has undergone extensive hydrological and biological alteration.
The South Florida/Caribbean Network is one of 32 networks in the National Park Service Inventory & Monitoring Program. It is comprised of four National Park Service units located in South Florida and three in the U.S. Virgin Islands (see Figure 1-B). SFCN parks vary in size from 978 acres to more than 1,508,500 acres and total over 2,500,600 acres across the network. More than 1,296,600 of these acres are designated as wilderness. The majority of the SFCN park units were
The U.S. Virgin Islands parks are composed of tropical dry forest islands where vegetation is mostly drought deciduous. Cacti, thorny legumes, grasses, and short trees with flattened crowns are common. Both South Florida and U.S. Virgin Islands are undergoing rapid
6
Chapter 1: Introduction and Background
urbanization. Coastal areas across the country are receiving new residents in large numbers. This may be best illustrated in South Florida, where MiamiDade County has increased in population by 19% since 1990 (Beacon Council 2006) to nearly 2.3 million residents. Both South Florida and the U.S. Virgin Islands are under heavy developmental pressure as land is converted to urban and agricultural uses, resulting in increased demand placed on a limited water supply and increased stresses on the natural system. Additionally, the Virgin Islands are experiencing increased visitation pressure as they have become the primary tropical tourist destination for Americans and Europeans under current political world climate and travel restrictions. These pressures add to the already complicated task of managing these natural systems with growing anthropogenic pressures pushing from every direction.
In the continental U.S., Florida has the highest average precipitation of any state, due in large part to afternoon thunderstorms which are common throughout most of the state from late spring until the early autumn. Hail is not an uncommon occurrence in some of the more severe thunderstorms. Snow is a rare occurrence in Florida. The most widespread snowfall in Florida history happened in January 1977 with snow flurries falling over much of the state extending as far south as Homestead. Snow flurries fell on Miami Beach for the only time in recorded history. Hurricanes pose a threat during the summer and fall. In 2004, Florida was hit by a record four hurricanes. Hurricanes Charley (August 13), Frances (September 4-5), Ivan (September 16), and Jeanne (September 25-26) cumulatively cost forty-two billion dollars in damages to the state. The 2005 hurricane season included 28 named storms, 15 hurricanes, and 7 major hurricanes, of which 6 struck the United States. Hurricanes Dennis (July 10), Katrina (August 25), and Wilma (October 24) struck Florida (Rita on September 20 just missed).
1.2.1 Climate Appendix I.2 provides a weather and climate inventory for the South Florida/Caribbean Network of Parks. Below is a brief synopsis for South Florida and the U.S. Virgin Islands climate.
Florida was also the site of the second most costly single weather disaster in U.S. history, Hurricane Andrew, which caused more than twenty-five billion dollars in damage when it struck on August 24, 1992 (Blake et al. 2005). Biscayne National Park was devastated during this storm and Everglades National Park was substantially impacted as well.
1.2.1a South Florida The climate of South Florida is tempered somewhat by its proximity to water. Most of the state has a humid subtropical climate with the extreme tip of Florida and the Florida Keys bordering on a true tropical climate. The seasons in Florida are determined by precipitation more than by temperature with warm, relatively dry autumns and winters (the dry season) and hot, wet springs and summers (the wet season). The Gulf Stream has a moderating effect on Florida climate, although it is common for much of Florida to experience high summer temperatures over 90º Fahrenheit. Mean high temperatures for late July are primarily in the low 90s. Mean low temperatures for late January range in the mid-50s in South Florida. South Florida averages about 58 inches of rainfall each year.
1.2.1b U.S. Virgin Islands The islands are hot and humid throughout the year, with most rain falling between August and November. Daily temperatures range from lows around 73ºF in the winter and 77ºF in the summer, with daily highs ranging between 84 to 89ºF. Annual precipitation averages 35-55 inches with a wet season from August to November and a secondary wet season during May. A dry season stretches from January to April.
7
South Florida / Caribbean Network Vital Signs Monitoring Plan
Infrequent extreme events such as hurricanes occur mostly in late summer (August to October). St. John has two intermittent streams, and several guts have permanent pools, some of which contain small populations of shrimp and fish.
and sinkholes which dot the state. South Florida is characterized by low elevation and topographic relief and has several physiographic units that lie within the SFCN parks including the Everglades province, the Atlantic Coastal Ridge, the Coastal Marshes and Mangrove Swamp province, and the Big Cypress Swamp. The Everglades province is a “south dipping, spoon-shaped low-lying area between the Atlantic Coastal Ridge to the east, the Big Cypress Swamp to the west, and the Sandy Flatlands to the north” (Thornberry-Ehrlich, 2005c). The Atlantic Coastal Ridge ranges in elevation from 5-20 feet, dips south into EVER where it contains the rare pine rocklands community, and historically was cut by transverse glades which dumped into Biscayne Bay but have since been replaced by canals. The Big Cypress Swamp is underlain by the Pliocene Tamiami Formation and is slightly higher in elevation than the Everglades basin.
In St. Croix, a wet season occurs from August to November and a secondary wet season during May. In 1989, after a 30 year period of calm, the Virgin Islands were hit by Hurricane Hugo, one of the most devastating hurricanes of the century. It destroyed over 80 percent of the structures on the island of St. Croix. Since 1989 there have been major storms in 1995 (H. Humberto, H. Marilyn, T.S. Sebastien), 1998 (H. Georges, T.S. Bonnie), and 1999 (H. Irene, H. Jose, H. Lenny (www.nhc.noaa.gov). Elevated seawater temperatures in 1998 and 2005 stressed coral reef communities, initiating coral bleaching on many reefs. In 2005, over 90% of stony corals bleached at SFCN monitoring sites, and subsequent coral disease added additional impact creating a severe coral mortality event with some reefs experiencing over 60% of their live stony coral killed (Miller et al., submitted manuscript).
The keys of BISC and DRTO are part of the Florida Keys. Keys in BISC consist of islands on coral rock and transitional islands that contain features of both hard rock coral keys and sand barrier islands (Thornberry-Ehrlich, 2005a). DRTO consists of sand islands that form an atolllike rim (Thornberry-Ehrlich, 2005b).
1.2.2 Geologic Resources The South Florida/Caribbean Network underwent Geologic Evaluations during 2004 and 2005 to identify geologic resource issues and mapping needs. For detailed information regarding the geology of SFCN parks, please reference Appendix E. Common geologic resource issues across the network include migrating shorelines, subsidence of coastal berms, groundwater movement into and around the South Florida parks, impacts from off-road vehicle use, and coral reef accretion, bioerosion, and sedimentation across the coral reef parks.
1.2.2b U.S. Virgin Islands St. John is volcanic in origin. Folding, faulting and uplifting have created the mountainous topography. Eighty percent of the slopes on the island are greater than 30% (CH2M HILL 1979) and there is little flat land. Coastal lowlands are occasionally large enough to form salt ponds that may be breached during storm events from the ocean, and catchment areas during heavy rain events. Major geologic resource issues for the island include sedimentation from the island along clear cut hillsides which smother the seagrass beds and coral reefs nearshore. Landslides and rockslides occur along road cuts and slope failures occur during heavy rain events as well.
1.2.2a South Florida South Florida lies at the lower end of the Floridian peninsula on a bedrock of limestone, which has high permeability, and is the cause for numerous small lakes
8
Chapter 1: Introduction and Background
The rocks of Buck Island Reef National Monument, St. Croix are sedimentary in origin and the island itself is very steep, with 90% of slopes steeper than 30% (CH2M HILL 1979). The majority of Buck Island is formed primarily from Caledonia formation during the Cretaceous period, mostly of mudstone. Buck Island is undeveloped, with only one trail traversing the island. The west end of the island is comprised of a 360m sandy beach, used heavily by visitors. Four species of sea turtle nest on the island primarily during June-Nov., but less than 30% of nesting occurs on the major recreational beach area. This coral sand beach area changes seasonally with winter storms and summer swells, as well as occasional tropical storms and hurricanes. Coral reefs – the barrier reef, patch and fringing reefs, and the unique haystack formations on the northeast corner of the barrier reef – are all geologic formations developed through biological processes with much of the reef still actively accreting.
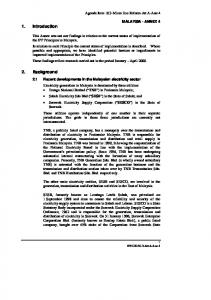
Figure 1-C. Historical pattern of water flow from Lake Okeechobee through Everglades to Florida Bay and Gulf of Mexico.
watershed begins in central Florida's Kissimmee River basin. Rainfall (which may total 40 to 65 inches (100 to 165 cm -1 yr )) on the Kissimmee River basin and southward, is the source of South Florida’s surface water. Evaporation, transpiration, and runoff consume fourfifths of the rainfall. Slow and rain-driven, the natural cycle of freshwater circulation historically built up in shallow Lake Okeechobee, one of the largest freshwater lakes wholly within the U.S. (average 2 depth 12 ft (3.7 m) and area 730 mi (1890 2 From that build-up flowed the km )). wide, shallow "River of Grass." Fifty miles (80 km) wide in places, one to three feet (0.3 to 0.9 m) deep in the slough's center but only 6 inches (15 cm) deep elsewhere, it flowed south 100 feet (30 meters) per day across Everglades sawgrass toward mangrove estuaries of Florida Bay and the Gulf of Mexico (Figure 1-C). This sheetflow connected to the eastern coastal areas and bays via transverse glades, natural geologic depressions or cuts through the relict rock ridge along the eastern areas of southern Broward and Miami-Dade Counties.
The elkhorn coral barrier reef put the ‘reef’ in Buck Island Reef National Monument. The present day barrier reef formation has existed for over 8000 years (Hubbard 1991) and has survived hurricanes, massive die-off and bleaching events. Elkhorn coral, Acropora palmata, has been the primary architect of this formation. A branching coral, it is one of the fastest reef building corals in the Caribbean; it has been devastated throughout its range and was listed as a threatened species on May 2006 under the U. S. Endangered Species Act, 1973. Up until 2005 Buck Island Reef was one of the few places where A. palmata was experiencing a re-growth and recolonization but as a result of the 2005 bleaching event 36-66% of A. palmata colonies at Buck Island were lost (Lundgren and Hillis-Starr, 2008). 1.2.3
Water Resources
During the dry season (December to April), water levels gradually drop. Fish migrate to deeper pools. Birds, alligators,
1.2.3a South Florida Water management is the critical issue for the Greater Everglades Ecosystem, whose
9
South Florida / Caribbean Network Vital Signs Monitoring Plan
and other predators concentrate around the pools to feed on a varied menu of fish, amphibians, and reptiles. This abundant food source is vital to many wading birds that are nesting during the dry season. In May, spring thunderstorms signal the beginning of the wet season. A winter landscape dotted with pools of water yields to a summer landscape almost completely covered with water. Wildlife disperses throughout the park. Insects, fish, and alligators repopulate the Everglades, thus replenishing the food chain. Marine parks are the recipients of this runoff, which supplies Florida and Biscayne Bays with freshwater during the rainy season and reverting to a more marine system during the winter and spring. Oceanic processes drive the marine system with currents and tides dominating, and winds affecting smaller water bodies. Elaborate water controls now disrupt the natural flow. Incorrect quality, quantity, distribution, and timing of freshwater to the Everglades and the bays have severely degraded the ecosystem.
Biscayne Bay viewed from BISC headquarters. Biscayne Bay has been designated as Outstanding Florida Waters.
the State Legislature and reviewed by the Environmental Regulation Commission as worthy of special protection because of their natural attributes. OFWs generally include surface waters in National Parks, Preserves, Wildlife Refuges, Seashores, Marine Sanctuaries, Estuarine Research Reserves, certain National Monuments, certain waters in National Forests, as well as waters in the State Park system, Wilderness Areas, waters in the Environmental Endangered Lands Bond Program (EEL), Conservation and Recreation Lands Program (CARL), Land Acquisition Trust Fund Program (LATF), Save Our Coast Program (SOC), Wild and Scenic Rivers, and State Aquatic Preserves. In 1978 Biscayne Bay was designated as an Outstanding Florida Water (OFW). Existing anti-degradation standards associated with the OFW designation are principally narrative rather than numeric and are therefore generally not enforceable. In addition, the state of Florida water quality standards for Biscayne Bay as a Class III waterbody, have narrative standards for nutrients. The enforceability of both the OFW and Class III (F.A.C. 62-400) designation is extremely important to the preservation of BISC.
Outstanding Florida Waters (OFWs) Several areas in SFCN parks have been designated to receive special protection. Outstanding Florida Waters (OFW’s) are waters that are found to have exceptional recreational or ecological significance (Chapter 62-302.700(1) Florida Administrative Code). OFW’s include 41 of Florida’s 1,700 rivers, plus several lakes and lake chains, several estuarine areas, and the Florida Keys. Outstanding Florida Waters are waters designated by
Everglades National Park has been listed as a Florida Outstanding Natural Resource Water (ONRW). The Florida Administrative Code (F.A.C.) describes the surface water quality standards for Outstanding Natural Resource Waters in Chapter 62-302.700. Special Protection, Outstanding Florida Waters, Outstanding National Resource Waters. This chapter lists the existing designated water-bodies and describes both of these designations (OFW and ONRW), rulemaking procedures, permitting exceptions and requirements. Both OFW and ONRW do not allow "permitted" degradation of water quality other than what is described in Rule 64-4.242(2) and (3), F.A.C. respectively, notwithstanding any other FDEP rules that allow water quality lowering. The standards for OFW is
10
Chapter 1: Introduction and Background
based on the year of designation- for EVER it is March 1, 1979 (62-302.700(8)) except Northeast Shark Slough which is August 8, 1994 (62-302.700(9)(a)3).
Low dissolved oxygen, mercury and nutrients were the most common impairments on the verified list of 303(d) water bodies within the South Florida parks (see Table 1-C).
There is further description of Outstanding National Resource Waters in Florida State Statute 62-302.700(10). According to the rule, the Commission (Florida Environmental Regulation Commission) designated EVER as an Outstanding Natural Resource Water on June 15, 1989. However, park staff believe that the Florida legislature has never authorized it as an ONRW. (M. Zimmerman, personal communication)
1.2.3b U.S. Virgin Islands The Virgin Islands Rules and Regulations (VIRR) Title 12, Chapter 7, Section 186 provides provisions for Water Quality Standards for Coastal Waters of the Virgin Islands and defines (among other things) numerical and narrative standards for water quality within differential classifications of waterbodies, e.g., Class A, B, & C. Of particular interest to SFCN, this section defines best usage of Class A waters as:
Impaired Waters Several areas in both South Florida and USVI parks have been designated as impaired. Section 303(d) of the Clean Water Act (CWA) requires states to submit lists of surface waters that do not meet applicable water quality standards (impaired waters) after implementation of technology-based effluent limitations, and establish Total Maximum Daily Loads (TMDLs) for these waters on a prioritized schedule. TMDLs establish the maximum amount of a pollutant that a water body can assimilate without exceeding water quality standards. As such, development of TMDLs is an important step toward restoring waters to their designated uses. In order to achieve the water quality benefits intended by the CWA, it is critical that TMDLs, once developed, be implemented as soon as possible.
“Preservation of natural phenomena requiring special conditions, such as the Natural Barrier Reef at Buck Islands, St. Croix and the Under Water Trail at Trunk Bay, St. John.” Title 12, Ch 7, § 186-11(a) 1 and 2 defines the legal limits of Class A waters to be: “Within 0.5 miles of the boundaries of Buck Island’s Natural Barrier Reef, St. Croix” and “Trunk Bay, St. John.” The narrative water quality criteria standards within the Class A waters are defined: “Existing natural conditions shall not be changed.”
Chapter 99-223, Laws of Florida, sets forth the process by which the 303(d) list is refined through more detailed water quality assessments. It also establishes the means for adopting TMDLs, allocating pollutant loadings among contributing sources, and implementing pollution reduction strategies. Implementation of TMDLs refers to any combination of regulatory, non-regulatory, or incentivebased actions that attain the necessary reduction in pollutant loading.
These two areas defined by the VIRR are located within the Virgin Islands National Park, and Buck Island Reef National Monument, and are included within existing water quality monitoring programs (see below). Note: USVI Division of Environmental Protection (VIDPNR) Aaron Hutchins, Director,
11
South Florida / Caribbean Network Vital Signs Monitoring Plan
Table 1-C. 303(d) List of impaired water resources within South Florida / Caribbean Network parks. The 303(d) lists are based primarily on the state and territories’ 1996 305(b) Water Quality Assessment Report ("305(b) report"). Here is reported the 303(d) list 2002 update. This list was complied from a number of sources all of which are not in complete agreement. The water bodies listed are either in the park units or in adjacent or upstream locations. Sources: http://www.dep.state.fl.us/water/tmdl/index.html, http://www.epa.gov/OWOW/TMDL, http://10.147.158.160/wrd/dui/ (a NPS WASO WRD webpage), plus direct contact with appropriate state and territorial environmental departments. Water Body type Park Water Body Name Parameters Priority Estuary
Area B Tamiami Canal
Stream
Everglades National Park L-67 Culvert
Stream
WCA 3B
Stream
Everglades National Park Shark Slough
Stream
C-113
Stream
C-111 Everglades National Park Taylor Slough Transect T3 Long Sound
Stream
Dissolved Oxygen, Mercury (Based on Fish Consumption Advisory) Dissolved Oxygen, Iron, Mercury (Based on Fish Consumption Advisory), Nutrients Dissolved Oxygen, Nutrients Dissolved Oxygen, Mercury
Stream
Dissolved Oxygen, Iron
Low
Stream Stream
Low Low
L-28 Interceptor
Stream
L-28 Gap
Stream
Tamiami Canal
Stream
WCA 3A Center Section
Stream
Dissolved Oxygen Dissolved Oxygen Dissolved Oxygen, Nutrients, Mercury (Based on Fish Consumption Advisory), Dissolved Oxygen Dissolved Oxygen, Mercury (Based on Fish Consumption Advisory), Cadmium Dissolved Oxygen, Nutrients, Mercury (Based on Fish Consumption Advisory), Lead, Cadmium, Copper-Heavy metals potentially from Homestead Air Force Base. Suggested by DEPTallahassee Dissolved Oxygen Dissolved Oxygen Dissolved Oxygen Dissolved Oxygen, Turbidity Dissolved Oxygen, Turbidity Dissolved Oxygen Dissolved Oxygen
EVER
BICY
BISC
SARI
VIIS
Dissolved Oxygen, Nutrients, High Salinity Dissolved Oxygen, Nutrients
Florida Bay
No water bodies are listed within park boundary – however Military Canal is listed and moves water to the park via canals Salt River Marina Salt River Estuary Salt River Bay
Stream
Estuary Estuary Estuary
Caneel Bay
Estuary
Cruz Bay
Estuary
Cinnamon Bay Maho Bay / Francis Bay
Estuary Estuary
12
Dissolved Oxygen, Iron
Low Low Low Low
Low
Low Low
Low Low Low
Low
Low
Medium Medium High Medium Medium Low Low
Chapter 1: Introduction and Background
stated – “All Class A waters in the VI are now totally within Federal waters.” Title 12, Ch 7, § 186-3 defines the best use of Class B waters to be “for propagation of desirable species of marine life and for primary contact recreation (swimming, water skiing, etc.).” This section includes numeric and narrative water quality criteria as given in Appendix F. Class C waters are defined to be best used “…for the propagation of desirable species and marine life and secondary contact recreation (boating, fishing and wading, etc.).” Class C waters are located [VIRR T12, Ch 7, § 186-11(c) (1) (A-C)] in St. Thomas industrial sections and [VIRR T12, Ch 7, § 186-11(c) (2) (A-D)] St. Croix industrial harbors. VIRR defines Class B waters as all those that are not Class A or Class C. Therefore, the majority of waters within the VIIS and BUIS are defined by the Territory to be Class B waters. Low dissolved oxygen and turbidity were the most common impairments on the verified list of 303(d) water bodies within the Virgin Island parks (see Table 1-C). 1.2.4
marshes, sloughs, mangrove forests, and hardwood hammocks. These habitats support a diverse array of flora and fauna unique to South Florida’s climate, including 91 federal and state listed plant species and 31 listed animal species such as the Florida panther, black bear, and red-cockaded woodpecker. The preserve also contains the largest stands of dwarf cypress known, as well as rare orchids, bromeliads and unusual ferns. The name “Big Cypress” refers to the vast expanse of cypress rather than to the size of the trees. The larger “bald cypress” trees were logged during the past two centuries. The few remaining giants are extremely old; some hundreds of years old with trunks over 6 feet wide.
Park Descriptions
1.2.4a Big Cypress National Preserve (BICY) Big Cypress National Preserve, the first National Preserve in the National Park System, was established in 1974 with an additional 146,000 acres added in 1988. Currently the park has 720,567 acres and receives approximately 425,000 visitors annually, who come to hike, canoe, camp, bird-watch, hunt, fish, and use off road vehicle (ORV) trails (see Figure 1-D). Oil, gas, and mineral extraction occur. The Preserve also has a rich cultural history and remains home to the Miccosukee Tribe of Indians of Florida and the Seminole Tribe of Florida and sustains resources important to their culture.
The primary management concerns today relate to restoration of the human altered regional hydrology to a more natural flow pattern, improving water quality entering the park, managing invasive species, balancing recreational and extractive uses with long-term sustainability of the
The Preserve contains a large remnant of natural wetland mosaic including cypress strands and domes, pines, wet prairies,
13
Alligator in cypress forest in Big Cypress National Preserve during the dry season.
South Florida / Caribbean Network Vital Signs Monitoring Plan
system, managing impacts from urban development outside and in-holdings within the park, and protecting and preserving rare species.
Figure 1-D. Big Cypress National Preserve.
environments. Four major ecosystems are protected within the park. They are composed of a narrow fringe of mangrove forest along the mainland shoreline of Biscayne Bay; the clear shallow waters of Biscayne Bay itself; the northernmost islands of the Florida Keys; and the beginning of the world's third-longest coral reef tract (see Figure 1-E). The mangrove fringe along the western boundary helps reduce the runoff from
1.2.4b Biscayne National Park (BISC) Biscayne National Park was established first as a monument in 1968, and then as a National Park in 1980. Ninety-five percent of Biscayne National Park's 173,000 acres are submerged marine
14
Chapter 1: Introduction and Background
the urban sprawl south of Miami into the bay. This area, once prime habitat for wading birds, juvenile fish, and crustaceans, has been modified from natural tidal creeks mixing freshwater with marine during the wet season to areas dominated by canal discharges, which pass freshwater into the bay yearround, by water management dictated pulses. Biscayne Bay supports lush seagrass meadows and hard-bottom
communities (at a 2m average depth). There are 42 islands that make up the northernmost Florida Keys protected within the park boundary, most of which are in the same state as when the park was established decades earlier. Elliott Key is the largest island at roughly 7 miles long, and in places nearly a mile wide. Many of these keys are currently impacted by exotic invasive plant and animal species. Although treatment is ongoing, many
15
Figure 1-E. Biscayne National Park.
South Florida / Caribbean Network Vital Signs Monitoring Plan
Figure 1-F. Buck Island Reef National Monument.
invasive plant species are reintroduced through birds, or drift in with the tides. The offshore marine environment of Biscayne National Park is approximately 5 miles wide and 21 miles long. It is an area densely populated with coral patch reefs, with some estimates indicating more than 3,000 of these patch reefs occur in this area. The eastern edge of the park is defined as the 60 ft contour line, east of which the shelf edge drops hundreds of feet deep. Biscayne National Park
receives approximately a half million visitors each year, many of which come to boat, fish, snorkel and dive within the park. 1.2.4c Buck Island Reef National Monument (BUIS) Buck Island Reef National Monument was established by Presidential proclamation in 1961. On January 17, 2001, under the U.S. Coral Reef Initiative, the monument was expanded by Presidential
16
Chapter 1: Introduction and Background
Proclamation from 880 to 19,015 acres, adding extensive marine resources to the monument. This addition also increased the protection of the resources by making the entire monument a “no take” marine reserve. The expanded monument may contain some of the deepest marine environments within the National Park Service (approximately 5000 ft) (see Figure 1-F). The coral barrier surrounding two-thirds of the island is over 7000 years old and contains extraordinary coral formations, deep grottoes, abundant reef fishes, sea fans and gorgonians with the eastern most point of the reef containing the famous “Underwater Trail”. The 176-acre island has an overland nature trail and white coral sand beaches. The monument supports a large variety of native flora and fauna, including several threatened and endangered species including leatherback, hawksbill, loggerhead, and green sea turtles, elkhorn and staghorn coral, brown pelicans, and endemic beetles. Buck Island Reef National Monument has been subjected to several major hurricanes (Hurricane Hugo in 1989, Marilyn/Luis in 1995, George in 1998, and Lenny in 1999) and constant pressure from exotic predators like the tree rat (Rattus rattus) and mongoose (Herpestes javanicus). Buck Island began exotic predator control in the 1980s removing all mongoose by 1986. In 1999 the park began an island-wide rat eradication program which successfully controlled the tree rat population. The only non-native predator that remains is the European house mouse, Mus musculus which is being monitored bi-annually. In 2003, in collaboration with the NPS Florida and Caribbean Exotic Plant Management Program, BUIS has undertaken an island-wide non-native plant control program targeting 10 invasive species. The control of these exotic species will affect the entire terrestrial ecosystem and is essential to preserve the island’s present biodiversity.
1.2.4d Dry Tortugas National Park (DRTO) Dry Tortugas National Park, established in 1992, is one of the most unique areas of our National Park System. First visited by Ponce De Leon in 1513, the park comprises the westernmost part of the Florida Keys and is located 70 miles west of Key West, Florida, in the Straits of Florida. The 64,657 acre park encompasses a cluster of seven coral reef and sand islands, surrounded by shoals and submerged resources such as coral reefs and seagrass beds. Totaling 104 acres, the islands in the park are situated on the edge of the main shipping channel between the Gulf of Mexico, the western Caribbean, and the Atlantic Ocean. The islands and reefs pose a serious navigation hazard to ships passing through the 75mile wide straits and have been the site of hundreds of shipwrecks, which still occasionally occur in the area. The shipwrecks on the reefs comprise one of the nation’s principal ship graveyards. The tropical coral reef of the Tortugas are among the best developed on the continent and possesses a full range of Caribbean coral species, some of which are listed endangered and/or threatened (see Figure 1-G).
17
Goliath grouper at Dry Tortugas National Park.
South Florida / Caribbean Network Vital Signs Monitoring Plan
Figure 1-G. Dry Tortugas National Park.
Fort Jefferson, on Garden Key, is the park’s central cultural feature and is the largest 19th century American coastal fort, as well as “the biggest brick building in the western hemisphere.” Construction began on the structure in 1846, but the fort was never completed. Originally built to protect shipping access to the Gulf, the fort was used as a military prison during the Civil War, housing Union deserters and four Lincoln assassination conspirators. Today the fort is the primary destination for people visiting the
park. Loggerhead Key is the largest key and contains a brick tower lighthouse built in 1857 that is still operated. Also on this key are the ruins of the first marine biological laboratory in the Western Hemisphere—the Carnegie Institution of Washington, D.C. Marine Biological Laboratory. In 2007 a no-fishing Research Natural Area covering 46% of DRTO was established to protect the park’s biodiversity and resource integrity.
18
Chapter 1: Introduction and Background
1.2.4e Everglades National Park (EVER) When Everglades National Park was established in 1947, the park’s original boundaries contained 460,000 acres. Subsequent additions have increased its size to 1,509,000 acres, and include most of Florida Bay and the most recent addition of the Northeast Shark River Slough (see Figure 1-H). The park is the second largest national park in the lower 48 states behind Yellowstone National Park in Wyoming. It holds the largest
expanse of wilderness east of the Rocky Mountains. Congress designated 1,296,500 acres of this vast park as the Marjorie Stoneman Douglas Wilderness Area in 1978. The park is located at the interface of temperate and subtropical environments and has a great diversity of resources. These include over 400 species of birds, 800 species of land and water vertebrates, 1600 species of vascular plants, 125
Gulf Coast Visitor Center
Shark Valley Visitor Center
19
Figure 1-H. Everglades National Park.
South Florida / Caribbean Network Vital Signs Monitoring Plan
Everglades has been named an International Biosphere Reserve, World Heritage Site and a Wetland of International Importance. The international community has agreed the Everglades are unique and superlative. The existence of Everglades is threatened by several internal and external factors including altered hydrology and fire regimes, water quality, and development. Adaptive management strategies are needed to monitor, protect, preserve, and restore the Everglades to the bountiful ecosystem of the past.
Above: Five foot long clump of orchids in EVER.
The greater Everglades survival is linked to the Comprehensive Everglades Restoration Plan (CERP http://www.evergladesplan.org/) efforts to restore portions of the greater Everglades ecosystem as well as its original functions and to lay the basis for a sustainable future for the region.
species of fish and 24 varieties of orchids. The park is home to 202 federal or state listed species. Over 1 million visitors experience the park each year. Popular activities include canoeing, camping, boating, wildlife observation and fishing.
1.2.4f Salt River Bay National Historical Park and Ecological Preserve (SARI) The 1,015-acre Salt River Bay National Historical Park and Ecological Preserve
Right: Rainstorm in SARI.
20
Chapter 1: Introduction and Background
was created by Congress in 1992. The water acreage of the park was designated as a National Natural Landmark in 1980 and is home to 27 species that have been listed as rare, threatened, or endangered. Salt River Bay is located in the Salt River watershed on the north side of St. Croix is a large and diverse environment encompassing 4,164 acres (see Figure 1-I). The terrestrial communities surrounding and draining into Salt River Bay are dominated by 1,750 acres of shrubland or
42% of the total area. This shrubland can be classified as gallery shrubland of natural drainage guts, thicket scrub, mixed dry shrubland, sclerophyllous evergreen shrubland and coastal hedge found in a heterogeneous pattern as a result of natural effects and human influences. Developed areas of a residential or commercial nature comprise 847 acres (20 % of total area) and are scattered around Salt River Bay on the east, west and south boundaries.
21
Figure 1-I. Salt River Bay National Historical Park and Ecological Preserve.
South Florida / Caribbean Network Vital Signs Monitoring Plan
Figure 1-J. Virgin Islands National Park.
Pasture and grassland habitat cover 644 acres or 15% of the area. Much of this is dominated by the exotic species, Urochloa maximum, or Guinea grass. The less common habitat types of significant ecological value are coastal woodlands, mangrove forests, and semi-deciduous dry forest, each occupying almost 10% of the area. Wetlands are particularly rare in this area and cover only 74 acres, a mere 1.8%. The diversity and complex pattern of the terrestrial and near shore marine habitats in this watershed, the geological
history of the valley and the close linkage of these features make the Salt River watershed a valuable and critical natural resource. The Salt River estuary opens into the Caribbean Sea through a break in the fringing reef. Outside the reef the benthic community is dominated with rubble and small patch reefs. The Salt River Canyon starts not far from the break in the reef, and splits the shelf as it plunges into the abyss. The walls of the canyon provide large areas for stony corals to grow, and the canyon serves as
22
Chapter 1: Introduction and Background
an aggregation area for many pelagic fish species.
1.3
1.2.4g Virgin Islands National Park (VIIS) Virgin Islands National Park was established on St. John, U. S. Virgin Islands in 1956 (16 U.S.C. Sec. 398). After a number of additions the total park area is now 15,276 acres. In 1976, the United Nations Educational, Scientific and Cultural Organization (UNESCO) through its Man and the Biosphere (MAB) program designated the park as a Biosphere Reserve. Virgin Islands National Park contains examples of most tropical Atlantic terrestrial, coastal and marine ecosystems (see Figure 1-J). These include various types of tropical dry to moist forest, salt ponds, beaches, mangroves, seagrass beds, coral reefs and algal plains. Large portions of St. John’s original forests were cleared in the late 1700s and early 1800s, making most of the present forest late secondary growth. Dominant terrestrial vegetation types include moist forest (17%) and dry evergreen forest (63%) with the rest of the island split between mangroves, salt flats, pasture, dry thicket, thorn and cactus, disturbed vegetation, and coastal hedge.
Park Natural Resources and Management priorities have been compiled from a number of sources including discussions with resource managers, scientists, and park superintendents; network surveys; network meetings; reviews of management plans; reviews of state and territorial conservation strategies; reviews of South Florida restoration efforts; discussions with stakeholders; and direct observation. The following section provides a summary of those methods which have helped the SFCN with Vital Signs planning and ecological model development.
Park Natural Resources and Management Priorities
1.3.1 Issues Identified in Network Scoping Important management issues for SFCN parks were identified through a variety of methods, including an initial issue/stressor survey during the January 9, 2002 network meeting. The SFCN worked with Resource Management staff to develop a list of 27 management issues. During the next year, the network identified other issues and needs the parks were requesting and sent out a more robust survey including management issues, network staffing needs, office space availability, and various technical needs. Each of the parks was sent the survey for park level ranking. The parks returned the survey and the results were shared during the network meeting held in Homestead, Florida on November 4-6, 2003. The high priority management issues identified included the effects of “No-take” zones in the marine environment; recently expanded areas of network parks in which there was little knowledge of natural resources; impacts to fisheries and benthic resources including coral reefs and seagrass beds; declining coral reef resources and how to manage for these declines; exotic plant and animal impacts; impacts of the Comprehensive Everglades Restoration Program; managing recreational use; and regional development. Summary results are provided in Appendix G. Many of the
VIIS contains some of the last remnants of intact Caribbean dry tropical forests and is significant wintering habitat for Neotropical migratory birds (Askins et. al. 1989). Interpretation of recent aerial photographs (1999) shows VIIS marine environment consisting of 34% coral reef and colonized hard-bottom, 20% submerged aquatic vegetation, 17% sand, and 28% unknown (areas deeper than 20 m) (NOAA 2001). Sixteen federally listed endangered and threatened species have been observed at VIIS, including six species of marine mammals, three birds, three reptiles (all sea turtles), two marine invertebrates and two plants. Other faunal species include bats (9), birds (170), reptiles (14), insects (1000s), fish (300+) and many marine invertebrates.
23
South Florida / Caribbean Network Vital Signs Monitoring Plan
network parks are met with continued questions regarding how these issues are being managed, and many times the questions are not well answered. This is primarily due to the inability to communicate large issues from many disparate data sets. An additional benefit of this exercise was to focus park staff on resource-management and monitoring issues, as well as discuss where network staffing could help parks, which parks had available office space, and determine what types of shared network equipment, training, and technical needs existed across the network. An expanded survey format was developed to help ensure all management issues were addressed, however, the results from the initial and the expanded surveys revealed the same overarching issues. These survey results helped the network define short term needs like better vegetation and habitat maps, as well as the need to identify space to grow the program.
program to help park managers determine not only the ecosystem ‘health’ of their parks, but also track how the park is managing towards those desired future conditions stated within these GMPs. 1.3.3 State and Territorial Comprehensive Wildlife Conservation Strategy As the number of species listed under the Endangered Species Act has steadily increased along with the costs involved with saving imperiled species, it has become clear that a more comprehensive approach needs to be taken for wildlife conservation. The U.S. Congress helped to address this need by creating the State Wildlife Grants Program in 2002. This is a national effort with all U.S. states and territories participating with each creating a long-range strategy for managing all fish and wildlife, to be submitted to the U.S. Fish and Wildlife Service by October 1, 2005. The objectives of the strategy are to identify species (and their habitats) of greatest conservation need and to develop and implement high-priority conservation actions to abate problems for those species and habitats. These prudent steps will save millions of tax dollars by preventing declines before species become imperiled. Through the matching requirement, the State Wildlife Grants Program encourages partnerships and cooperation.
1.3.2 General Management Plans The South Florida/Caribbean Network parks are all going through the General Management Plan (GMP) process, with the exception of Dry Tortugas National Park, which finished its plan in 2001. This process takes 3-5 years if not longer to define how the park will be managed for the following 15-20 year timeframe. Each park describes its desired future conditions, and then looks towards proper zoning to balance visitor use with resource protection through a variety of alternatives. Public comment and scoping helps ensure the park’s vision is consistent with the park user’s vision, and through an iterative process, the general management plan is developed.
The State of Florida and U.S. Virgin Islands territorial government are both participating in the program. The Florida Fish and Wildlife Conservation Commission (FWC) has created Florida’s Wildlife Legacy Initiative in order to develop a strategic vision for conserving all of Florida’s wildlife (see http://floridaconservation.org/wildlifeleg acy). Within the U. S. Virgin Islands (USVI) the Government of the Virgin Islands’ Department of Planning and Natural Resources, Division of Fish and Wildlife recently completed its conservation strategy in June 2005 (see http://www.vifishandwildlife.com/Wildlif e/05F01WildlifePlan/Part%201%20Introd uction/table%20of%20contents.htm).
This planning process occurring during development of the Vital Signs monitoring plan helps the park managers look into the future at what might be occurring in their parks two decades away, and think long-term at how resources within the park may be affected over time. Such forward-thinking and planning should assist the Vital Signs planning process and better enable the resulting monitoring
24
Chapter 1: Introduction and Background
The National Park Service and the South Florida/Caribbean Network participated in the development of these strategies and used materials from the strategy documents in developing SFCN’s conceptual models. SFCN hopes to collaborate with these efforts in the future so that regional trends may be better evaluated in the future.
National Park. Both projects have major impacts to the resources, and are working on how best to monitor those effects over time. 1.4
Designing an Integrated Monitoring Program for the SFCN
Should vital signs monitoring focus on the effects of known threats to park resources or on general properties of ecosystem status? Woodley et al. (1993), Woodward et al. (1999), Jenkins et al. (2002) and others have described some of the advantages and disadvantages of various monitoring approaches, including a strictly threats-based monitoring program, or alternate taxonomic, integrative, reductionist, or hypothesistesting monitoring designs (Woodley et al., 1993, Woodward et al. 1999). The approach adopted by SFCN agrees with the assertion that the best way to meet the challenges of monitoring in national parks and other protected areas is to achieve a balance among different monitoring approaches (termed the “hybrid approach” by Noon 2003), while recognizing that the program will not succeed without also considering political issues. This system segregates indicators into one or more of four broad categories. 1) Physical system drivers that fundamentally affect park ecosystems
1.3.4 South Florida Restoration Efforts The Comprehensive Everglades Restoration Plan and the Modified Water Delivery Plan are two very substantial projects which will have long lasting effects on how water passes through the South Florida Parks. The Modified Water Deliveries to Everglades National Park (aka Mod Waters) project is being conducted by the U.S. Army Corp of Engineers to help alleviate some of the hydrologic bottlenecks created by the Central and Southern Project by the Corp in the 1950s when many of the canals were dug throughout South Florida to assist with flood control and water supply. The project will hopefully increase the amount of freshwater capacity to the park by breaching the westernmost canal along the Southeast boundary of Everglades National Park; increase the amount of water from the Water Conservation Areas north of the park into the headwaters of Shark River Slough; and mitigate for flooding along the eastern boundary of the park, specifically around the 8.5 square mile area, where homes repeatedly are flooded during heavy rain events (see http://www.saj.usace.army.mil/dp/mwde np-c111). The Comprehensive Everglades Restoration Plan follows Mod Waters as a major construction project with 68 components all hoping to get the quantity, quality, timing and distribution of freshwater more aligned to how the natural system operated 60 or more years ago (see http://www.evergladesplan.org). This project is a partnership between the U.S. Army Corp of Engineers and the South Florida Water Management District. This federal state partnership will directly affect how water will be released to Everglades National Park, Big Cypress National Preserve, and Biscayne
2) Anthropogenic stressors and their ecological effects 3) Focal resources of parks 4) Key properties and processes of ecosystem integrity When a good understanding of relationships between potential threats and responses by park resources (known effects) exists, monitoring of system drivers, stressors, and affected park resources is conducted. A set of focal resources (including ecological processes) will be monitored to address both known and unknown effects of system drivers and stressors on park resources. Key properties and processes of ecosystem status and integrity will be monitored to improve
25
South Florida / Caribbean Network Vital Signs Monitoring Plan
long-term understanding and potential early warning of undesirable changes in park resources. Natural physical system drivers are major external driving forces such as climate, fire, and hydrology that have large-scale influences on natural systems. Trends in system drivers that will have corresponding effects on ecosystem components may provide early warning of presently unforeseen changes to ecosystems. Anthropogenic stressors are physical, chemical, or biological perturbations to a system that are foreign to that system. Stressors cause significant changes in the ecological components, patterns, and processes in natural systems. Examples include water withdrawal, nutrient enrichment, toxic contaminants, historic timber harvest, poor fishing methods, vessel groundings, off-road vehicle use, poaching, land-use change, and air pollution. It should be noted that anthropogenic stressors may have negative impacts on some species while having positive impacts on others. And even natural system drivers can sometimes push a system out of its equilibrium given the large reductions in natural areas that would otherwise buffer against extremes. Monitoring of stressors and their effects, where known, will ensure short-term relevance of the monitoring program and provide information useful to management of current issues. Focal resources, by virtue of their special protection, public appeal, or other management significance, have paramount importance for monitoring regardless of current threats or whether they would be monitored as an indication of ecosystem integrity. Focal resources might include ecological communities such as coral reefs or hardwood hammocks, or they may be a species that is harvested, endemic, alien, or has protected status. Some examples of key properties and processes of ecosystem integrity include the presence and distribution of top predators, the composition and distribution of seagrass beds, ephemeral ponds which are maintained by alligators as “alligator holes” used by multiple species, or the structure and composition of marsh fish and invertebrate communities which support much of the
26
food web. Collectively, these basic strategies for choosing monitoring indicators achieve the diverse monitoring goals of the National Park Service. 1.4.1 SFCN Approach to Vital Signs Identification Each network is required to design an integrated monitoring program that addresses the monitoring goals listed in section 1.1.1 and is tailored to the highpriority monitoring needs and partnership opportunities for the parks in that network. Although there will be considerable variability among networks in the final design, the basic approach to designing a monitoring program should follow five basic steps: 1) Define the purpose and scope of the monitoring program 2) Compile and summarize existing data and understanding of park ecosystems and resource management issues 3) Develop conceptual models relevant ecosystem components
of
4) Select indicators and specific monitoring objectives for each 5) Determine the appropriate sampling design and sampling protocols These steps are incorporated into a 3phase planning and design process that has been established for the monitoring program. Phase 1 of the process involved defining goals and objectives; beginning the process of identifying, evaluating and synthesizing existing data; developing draft conceptual models; and completing other background work as a prelude to the selection of ecological indicators. Much of this background information is documented in this chapter and appendix reports. Conceptual models are discussed in Chapter 2 and Appendix J. Phase 2 of the planning and design effort involved prioritizing and selecting vital signs and developing specific monitoring objectives for each vital sign that will be included in the network’s initial monitoring program. The process is documented in Chapter 3
Chapter 1: Introduction and Background
and Appendix O. Phase 3 entailed the detailed design work needed to implement monitoring including: outline of strategies for vital signs implementation and relationships with existing programs (Appendix P); outline of sampling design issues (Chapter 4); development of sampling protocols (Chapter 5 and Appendix Q); a plan for data management (Chapter 6 and Appendix R); details on the type of analyses and content of various products of the monitoring effort such as reports and websites (Chapter 7); and the administrative structure (Chapter 8). Chapter 9 outlines the anticipated schedule of protocol development and monitoring activities planned for the 5 years following plan approval and the budget is given in Chapter 10.
1.5
Summary of Current Monitoring Within and Surrounding the Network
The South Florida/Caribbean Network (SFCN) may be one of the more fortunate networks within the Inventory and Monitoring Program because of the amount of historic and ongoing monitoring occurring within and around the parks. Appendix H provides a table of ongoing monitoring activities by park and as part of the CERP RECOVER Monitoring and Assessment Plan (MAP). NOAA’s National Marine Fisheries program has been monitoring commercially exploited fish species for the past 26 years, with many samples collected within South Florida network parks. USGS has been monitoring freshwater fish in South Florida for decades. Park Resource Management has been monitoring birds since the 1950s,
1.4.2 Monitoring Questions and Objectives The SFCN monitoring program is designed around the five broad, servicewide goals (see section 1.1.1 Service-wide Monitoring Goals). These goals were converted to general monitoring questions for each of SFCN’s 44 vital signs (see Table 1-D) and then even more specific monitoring objectives for the 12 protocols SFCN will be developing (see Chapter 5, Table 5-B). Both the monitoring questions and monitoring objectives should be much more specific but link clearly to the overarching servicewide goals. These then lead to the monitoring variables and exact scope of the monitoring. The specific monitoring objectives should be articulated as clearly as possible, leading directly to how data will be collected, interpreted and put to practical use. The clearer these objectives, the easier it will be to design the rest of the monitoring program (MacDonald and Smart, 1993; Olsen et al., 1999; Yoccoz et al. 2001). These monitoring objectives will be refined as protocol development progresses.
27
NPS employee Jeff Miller applying prototype coral monitoring protocol at Dry Tortugas National Park.
South Florida / Caribbean Network Vital Signs Monitoring Plan
Table 1-D. Vital Signs and general monitoring questions. Deferred vital signs marked with “*”. Vital Sign
General Monitoring Questions
Air QualityDeposition
What are the status, trends, and episodic events in air quality in SFCN parks, as measured by wet and dry deposition?
Air QualityMercury
What are the status and trends in mercury deposition?
American Alligator
What are the status and trends in the alligator distribution, abundance, body condition, hole occupancy, nesting, and demographic structure of alligators, esp. in relation to water levels and CERP/MOD Waters Everglades restoration in EVER and BICY?
American crocodile
What are the status and trends in crocodile distribution, abundance, nesting, body condition, demographic structure, growth and survival esp. in relation to water levels, salinities and CERP/MOD Waters Everglades restoration in EVER and BISC?
Amphibians
What are the status and trends in amphibian distribution, abundance (occupancy), community composition, pig frog demographic structure, and mercury levels, esp. in relation to water levels and CERP/MOD Waters Everglades restoration?
Aquatic invertebrates in wet prairies & marshes
What are the status and trends in aquatic invertebrate community composition and structure, esp. in relation to hydrological patterns and water quality in the wet prairies and marshes?
Bats-USVI*
What are the status and trends in bat species abundance and bat roosting locations esp. the red fruit bat and the fisherman bat?
Benthic Communities Extent & Distribution
What is the extent and distribution of marine benthic communities and how are they changing?
Butterflies*
What are the status and trends in abundance and distribution of butterflies?
Coastal Geomorphology
What are the status and trends in soil dynamics (accretion, subsidence and erosion) in mangroves, mud-banks, and salt ponds, esp. in relation to changes in hydrology sea-level, storms/hurricanes, and upland erosion? Where do Florida Bay berms, embankments & mudbanks change in location?
Colonial Nesting Birds
What are the status and trends in colony size, distribution, and nesting status of colonial nesting birds (e.g., egrets, ibis, wood storks, spoonbills, sooty terns, brown pelicans)?
Contaminants*
What are the distribution, range, variability and concentrations of contaminants, including Emerging Pollutants of Concern (EPOCS), in the water column, organisms, and sediments?
Estuarine salinity patterns
What are the spatial and temporal changes in distributions of physical characteristics (conductivity converted to practical salinity units, pH, dissolved oxygen, temperature) in the marine water bodies of Florida Bay (coastal embankments, central bay, "open" bay), Biscayne Bay, and Salt River Bay?
Fire Return Interval Departure
What is the extent and distribution of areas across the landscape where a departure from native fire regimes exists?
Florida Box Turtle*
What are the status and trends in the abundance and distribution of Florida Box Turtles?
Florida panther
What are the status and trends in Florida panther abundance, distribution, mortality, and recruitment?
Focal Fish Species
What are the status, trends, and variability of focal fish species within and near parks, specifically Goliath grouper, Nassau Grouper, Red hind, Sharks (Bonnethead, Lemon, Bull, and Nurse sharks), Spotted sea trout, and Snook?
28
Chapter 1: Introduction and Background
Table 1-D. Vital Signs and general monitoring questions (cont.). Vital Sign
General Monitoring Questions
Forest Ecotones and Community Structure
Are ecotones shifting due to physical conditions (e.g., hydrology, climate change, anthropogenic factors, sea level rise, fire, episodic meteorological and storm wave events, etc.)? What are the status and trends in plant community composition and structure?
Freshwater fish and large macroinvertebrates
What are the status and trends of fish and large macro-invertebrate assemblages community composition, abundance (density & relative abundance), size structure, and distribution, especially in relation to hydrological patterns and water quality in wet prairies and marshes?
Imperiled & Rare Plants*
What are the status and trends in the number of populations, distribution, and population sizes of rare plants?
Invasive/ Exotic Animals
What exotic animal species are present in the parks and which ones are considered invasive or otherwise problematic? What is the distribution of the species? Where have new invasive/exotic species been detected in or near the parks?
Invasive/ Exotic Plants
What are the status and trends in invasive exotic plants extent and distribution? Are new invasive exotic species becoming established in or near the park?
Island Insects*
What are the status and trends in the composition and distribution of major insect groups (e.g., beetles, pollinators)?
Land Use Change
What are the status and long-term trends in landscape change in and around SFCN parks (e.g., changes in land use (municipal, private, commercial, agriculture), land cover, road density, housing density, etc.)? What are the near future changes expected in and around SFCN parks based upon building permits, zoning changes, and community planning decisions?
Landbirds*
What are the status and trends in the abundance and distribution of land birds (residential and migratory) overall and in specific habitats (e.g., pine rocklands, mangroves)? In specific habitats (e.g., pine rocklands), what are the status and trends in fecundity and nestling survivorship?
Mangrove-Marsh Ecotone
Are ecotones shifting or changing in aerial size (widening or narrowing) due to physical conditions (e.g., sea level rise, hydrology, climate change, anthropogenic factors, fire, episodic meteorological and storm wave events, etc.)? What are the status and trends in plant community composition and structure?
Marine Benthic Communities
What are the status and trends of coral reef community percent cover of major taxonomic groups (e.g., coral, algae, gorgonians, sponge, substrate), coral species diversity, coral community structure, rugosity, coral recruitment, coral disease mortality, and algal community structure, incl. among areas with differing management regimes (e.g., no-take zones vs. fished zones)? What are the status and trends in seagrass and other SAV extent, distribution, community composition and habitat quality, especially in relation to known gradients such as onshore-offshore, long-shore gradients, and depths? Is seagrass cover increasing in recently created no-anchor zones?
Marine Exploited Invertebrates
What are the status, variability, and trends in exploited invertebrates: Lobster (relative abundance/density, distribution, size structure, sex ratio, regional harvest); Conch (density, distribution, size structure/maturity); pink shrimp (density, distribution, harvest); blue crab (harvest); stone crab (harvest); oysters (distribution); sponges (harvest); whelks (density, size structure)?
Marine Fish Communities
What are the status, trends, and variability in exploited fish assemblages (e.g., Grouper/Snapper/Parrotfish/Surgeonfish), reef fish communities, and nearshore and estuarine (bay) fish communities? Are there differences among areas with different management regimes? If present within parks, what are the locations and size of spawning aggregations?
29
South Florida / Caribbean Network Vital Signs Monitoring Plan
Table 1-D. Vital Signs and general monitoring questions (cont.). Vital Sign
General Monitoring Questions
Marine Infaunal Community*
What are the status and trends in distribution and abundance of important indicators and keystone organisms, esp. with respect to salinity and nutrient gradients?
Marine Invertebrates-Rare Threatened, Endangered
What are the status and trends in relative abundance & distribion of rare, threatened, and endangered species (Acropora spp., Antipathes spp., and Diadema antillarum)?
Nutrient Dynamics
What are the status and trends in the spatial and temporal distributions of nutrients at specific sites in the wet prairies and marshes, near shore areas, and marine water bodies? What are the status and trends in nutrient loading to the estuaries from all sources and in sediment loading to guts and standing ephemeral pools at VIIS?
Periphyton (Freshwater)
What are the status and trends in periphyton community composition, structure, and nutrient content, especially in response to alterations in water quality and water management (quantity, timing, duration)?
Phytoplankton (Marine)
What are the status and trends in frequency, size, and distribution of algal blooms in and around SFCN park waters? When and where are algal blooms occurring?
Protected Marine mammals
What are the status and trends in the distribution, abundance and condition of rare, threatened, and endangered marine mammals (e.g., manatees, dolphins) regionally and within parks?
Reptiles-USVI*
What are the status and trends in the distribution and abundance (or proportion of area occupied) by native and non-native reptile species at VIIS and SARI? What will be the status and trends of the St. Croix Ground Lizard, Ameiva polops, once the population is introduced to BUIS in 2008?
Sawfish
What are the status and trends in distribution, relative abundance, number of active nursery areas, and demographics (sex ratios, adult/juvenile ratios)
Sea Turtles
What are the status and trends by species in the number of sea turtle nests, distribution of nests, proportion of aborted nest crawls, nesting outcome, # eggs laid/nest, hatching success, and recruitment? What are the status and trends in the population size of nesting sea turtles (at BUIS only)?
Surface Water Hydrology
What are the spatial and temporal patterns (quantity, timing, duration, flow) of freshwater input (surface water, and to a point groundwater) into estuaries/bays and of the general hydrology (quantity, timing, duration, flow) of the freshwater marsh part of the ecosystem? What is the general annual weather pattern, especially in regards to rainfall?
Vegetation Communities Extent & Distribution
What are the status and changes in the extent and distribution of vegetation communities? What changes relate to ecotonal and community structure changes, especially those related to hydrology management, fire management, nutrient enrichment, storm damage, and sea level rise?
Visitor Use
What are the seasonal and long-term trends in the distribution and abundance of visitors and associated activity types? In areas of critical concern, how is visitor use changing over time?
Water Chemistry
What are the status and trends in the spatial and temporal distributions of physical water chemistry (e.g., conductivity, DO, temperature, pH, etc.) in the wet prairies and marshes, near shore areas, and marine water bodies?
Wetland Ecotones and Community Structure
Are wetland ecotones shifting due to changes in hydrology or other physical factors (e.g., fire, nutrients, and episodic metrological events.)? What are the status and trends in plant community composition and structure?
Wetland substrate*
What are the status and trends in the extent and distribution of substrate types at landscape scales over time, especially in relation to hydrology, water quality, fire, and other processes?
30
Chapter 1: Introduction and Background
Florida panthers, deer, and alligators since the 1980’s, and more recently fish, aquatic invertebrates, and plants. The Florida Coastal Everglades Long Term Ecological Research (LTER) group has many studies that continue to analyze the effects of phosphorus on the freshwater system and how it mixes when it meets the oceanic system as it flows through the Shark and Taylor Sloughs of Everglades National Park. More information about the LTER can be accessed at: http://fcelter.fiu.edu/. Dry Tortugas National Park, Buck Island Reef National Monument and Virgin Islands National Park were selected to be part of the NPS Prototype Inventory and Monitoring Program for coral reef ecosystems in the mid 1990s. That program researched, developed, and implemented monitoring protocols for several key resource areas including coral reefs, sea turtles, reef fishes, and water quality. These historic and ongoing data sets are providing invaluable information toward the vital signs program. The SFCN works closely with NOAA’s NCCOS CCMA Biogeography Team coordinating efforts on production of benthic habitat map products for the network parks, and evaluating the coral reef and fisheries of the U.S. Virgin Islands. The Biogeography Program can be accessed at: http://biogeo.nos.noaa.gov/. The U.S. Geological Survey (USGS) and the SFCN collaborate on many projects including benthic mapping, coral reef research especially diseases and bleaching response, plant and animal inventories, water quality monitoring and soil elevation dynamics. The USGS provides resources and support during the Vital Signs Monitoring planning process and beyond. The State of Florida Fish and Wildlife Conservation Commission (FWC), the state of Florida’s Department of Environmental Protection (FDEP), and the Government of the Virgin Islands Department of Planning Natural Resources (VIDPNR) all work in and around the network parks monitoring water quality, game species, and statelisted species in addition to other ongoing projects. The South Florida Water
Management District (SFWMD) conducts a significant amount of water quality monitoring across the South Florida, as well as coordinates the state efforts for the Comprehensive Everglades Restoration monitoring activities. County Resource Management agencies like the MiamiDade County Department of Environmental Management conduct seagrass monitoring, water quality monitoring, and exotic plant and animal management in and around network parks. 1.5.1 Climate Monitoring Climate Monitoring has been addressed by almost all of the networks as a key data set needed to help determine trends of other key Vital Sign indicators (i.e. an environmental co-variate). The Western Regional Climate Center (WRCC) developed a network weather and climate inventory for the SFCN (see Appendix I.2, Davey et al. 2007). The inventory describes broad-scale climatic factors and zones important to network parks, an inventory of weather and climate station locations in and near network parks, results of an inventory of metadata on each weather station, and an initial evaluation of the adequacy of coverage for existing weather stations and recommendations for improvements in monitoring weather and climate. The island-based SFCN park units, such as DRTO and the park units on the relatively small U.S. Virgin Islands, cannot support the same number of weather and climate stations as can larger islands or mainland locations. These park units must rely heavily on outside sources of weather/climate data. This is true particularly with regards to near-real-time stations, where little of any coverage currently exists on Virgin Islands park units. The near-real-time weather stations identified in this report are invaluable for determining current weather conditions, while the climate records available from longer-term stations on these islands are extremely valuable for tracking globalscale climatic changes. Therefore, it is important that the NPS encourage local
31
South Florida / Caribbean Network Vital Signs Monitoring Plan
officials who are responsible for operating these stations to continue to maintain reliable observations.
the Pa-hay-okee or Mahogany Hammock Overlooks. 1.5.2 Air Quality Monitoring Air pollution ambient monitoring and effects information, as well as recommendations for additional air quality-related monitoring, has been prepared for the South Florida/Caribbean Network. The summary report and associated tables and appendixes are provided in Appendix I.1.
No weather/climate station coverage is available currently in central and southern BISC. This coverage gap could begin to be addressed by installing an automated station on Elliott Key, at the main ranger station. Candidate weather/climate station networks for this installation would include the Florida Automated Weather Network (FAWN) and Remote Automated Weather Station Network (RAWS) networks. Weather/climate monitoring efforts in the park unit would likely benefit from such an installation.
The National Atmospheric Deposition Program/National Trends Network (NADP/NTN) is a nationwide network of precipitation monitoring sites. Both Everglades National Park and Virgin Islands National Park support NADP/NTN monitoring stations. The NADP/NTN has also expanded its sampling to include the Mercury Deposition Network (MDN), which currently has over 85 sites in North America. The MDN was formed in 1995 to collect weekly samples of precipitation, which are analyzed for total mercury. Everglades National Park monitors for mercury deposition with this system.
The importance of monitoring wet season/dry season cycles and spatiotemporal patterns in precipitation is quite evident for both BICY and EVER, where precipitation patterns play a integral role in the ecosystems in these park units. Drought monitoring, monitoring of fire conditions, and monitoring of ecosystem health all will benefit from a better understanding of regional convective precipitation patterns, which are quite variable in space and time across both BICY and EVER. In order to improve this understanding, however, the existing coverage of nearreal-time weather stations in these parks would need to be increased, and weather/climate monitoring efforts in both BICY and EVER would benefit by gradually implementing this strategy. Since the RAWS network already has a presence within both BICY and EVER, a natural first step would be to install more of these stations. Potential sites in BICY could include 1) a location along Highway 839 between US Highway 41 and Interstate 75, and 2) northeastern BICY, near the rest area at the Recreation Access Point on Interstate 75. Potential sites in EVER could include 1) the Gulf Coast Visitor Center, 2) the Royal Palm Visitor Center, and 3) along Highway 9336, near access points such as
The Clean Air Status and Trends Network (CASTNet) is the nation's primary source for atmospheric data to estimate dry acidic deposition (http://www.epa.gov/castnet/). Established in 1987, CASTNet now comprises about 95 monitoring sites across the U.S. The majority of the monitoring stations are operated by EPA; however, approximately 30 stations are operated by the NPS in cooperation with EPA. Each CASTNet dry deposition station measures weekly average atmospheric concentrations of SO4, NO3, NH4, sulfur dioxide, and nitric acid; hourly concentrations of ambient ozone; and some meteorological parameters. Everglades National Park installed a monitoring station in 2000. Virgin Islands National Park ran a monitoring station from 1993 until 2004 when it was removed.
32
Chapter 1: Introduction and Background
In 1985, in response to the mandates of the Clean Air Act, Federal and regional/state organizations established the Interagency Monitoring of Protected Visual Environments (IMPROVE) program to protect visibility in Class I air quality areas. Class I areas are national parks greater than 5,000 acres and wilderness areas greater than 6,000 acres, that were established prior to August 7, 1977. All other NPS areas are designated Class II. Everglades and Virgin Islands NPs are Class I areas. The objectives of the IMPROVE program are to: establish current visibility conditions in all Class I areas, identify pollutants (particles and gases) and emission sources responsible for existing man-made visibility impairment, and document long-term trends in visibility. The IMPROVE network is designed to assess regional visibility; standard operation does not identify individual sources that impair visibility at a monitoring site.
Research Center (FIU-SERC), MiamiDade County Department of Environmental Resources Management (DERM) and Florida Department of Environmental Protection (FDEP). Less extensive monitoring in the U.S. Virgin Islands is being conducted by NPS staff, the U.S. Virgin Island Territorial Government, and National Oceanic and Atmospheric Administration (NOAA) National Buoy Data Center in conjunction with the Florida Institute of Oceanography. Due to the complexities of this extensive monitoring across the network, the SFCN role is more of a consolidation and regional disperser of hydrology products (See Appendix F).
A number of research projects have been conducted within SFCN parks looking at air quality parameters; some of which are detailed within the Air Quality summary report from the NPS Air Resource Division (Appendix I). Updated estimates of air quality parameters can be found in the future at the NPS Air Resource Division Air Atlas site http://www.nature.nps.gov/air/maps/Air Atlas/index.cfm.
1.5.4 Biological monitoring Biological monitoring activities occurring in the network parks are summarized in Appendix H. Some of the longer running programs at various parks (although often sharply limited in geographic scope) include creel surveys, fire effects monitoring, reef fish surveys, coral community monitoring, coral disease monitoring, bird and sea turtle migration, recruitment, and seasonal nesting and monitoring of other federally listed species (e.g., panthers, manatees, sooty terns, brown pelicans). CERP has several programs in either pilot phase or recently initiated long-term monitoring.
1.5.3 Physical Science and Water Quality Monitoring Water Quality monitoring currently occurs within all network parks. In South Florida, federal and state agencies have been monitoring hydrology and other resources for many years in order to determine how best to manage the hydrology as part of the Comprehensive Everglades Restoration Program (CERP). Monitoring in South Florida parks is being conducted by NPS staff, the U.S. Geological Survey (USGS), the South Florida Water Management District (SFWMD), Florida International University Southeast Environmental
33
Measurements during juvenile hawksbill sea turtle monitoring program at Buck Island Reef National Monument.
South Florida / Caribbean Network Vital Signs Monitoring Plan
1.5.5 The South Florida Natural Resources Center The South Florida Natural Resources Center (SFNRC), a division of Everglades National Park provides scientific information and environmental assessments to the NPS units of South Florida and to the Department of the Interior. Established in 1978, the center was given the unprecedented mandate to address the impacts of activities taking place outside park boundaries. This unique charter requires that center scientists conduct scientific inquires into the ecology of the region as a whole, evaluating the impacts that land-use and water resources management actions have on the freshwater, estuarine, and coastal ecosystems of south Florida. The SFNRC is organized around four major categories of activities: Natural Resources Management, Inventory and Monitoring, Restoration Assessments, and Applied Science. The center has four offices in South Florida: in Loxahatchee National Wildlife Refuge, the South Florida Ecosystem Office in Homestead, The Daniel Beard Center in EVER, and the Florida Bay Interagency Science Center in Key Largo. More information about the center can be obtained at their website at: http://www.nps.gov/ever/naturescience/s fnrc.htm.
1.5.6 The South Florida/Caribbean Prototype Monitoring Program The South Florida/Caribbean Network merged with the South Florida/Caribbean Prototype Monitoring Program in 2004. The merger of the two programs has allowed the coral reef monitoring protocol developed in 1997 in the U.S. Virgin Islands parks to be expanded into both Biscayne National Park and Dry Tortugas National Park, providing a consistent monitoring effort across network parks and allowing the network parks to talk about trends in coral reef resources in a more consistent manner. Coral monitoring at reef sites using the Aquamap™ Underwater navigation system and underwater video collection provides these parks with trend information regarding live percent cover values of the reef’s basic functional groups and stony coral species, as well as continuous reef water temperature, occurrence of coral disease, and presence of the long-spined urchin (Diadema antillarum). The prototype monitoring program has also developed protocols for sea turtle monitoring, seagrass monitoring, and water quality monitoring in conjunction with BUIS and VIIS. The merger also provided funding to hire a network quantitative ecologist to help optimize sampling efficiency, and assist with data analysis of historical data sets.
Squirrelfish over boulder star coral, Tektite Reef, VIIS. Picture taken before massive coral dieoff in 2005.
34
Chapter 2: Conceptual Models 2.1
results because the term “conceptual model” means different things to different people (e.g., food web diagrams, detailed species life-history descriptions, management-oriented “control” models). Form and details of models differ depending on the purpose, scales of focus, and system complexity. The purpose of the conceptual models in this report is to assist the program with identifying and prioritizing “vital signs” in an adaptive management context. These models do not contain all possible details or relationships in the system. Instead, the level of detail and format chosen for these models is designed to facilitate vital signs selection.
Introduction
In this section we describe the purposes and characteristics of managementoriented conceptual models along with summaries of the SFCN ecological zones conceptual models. Full details about the SFCN conceptual models are given in Appendix J. 2.1.1 Why use conceptual models The NPS Inventory and Monitoring Program requires the development of conceptual models as a prelude to identifying the vital signs to be monitored. Conceptual models assist with designing monitoring programs in an adaptive management context (National Research Council 1990; Margoluis et al. 1998; CALFED Bay-Delta Program 2000a, 2000b; Elzinga et al. 2001; Stevens and Gold 2003; Noon 2003, Ogden et al. 2003; Atkinson et al. 2004; RECOVER 2004). Programs that do not use conceptual models frequently experience difficulty in prioritizing among vital signs, choosing monitoring protocols, and developing appropriate sampling designs. Conceptual models are qualitative or quantitative models used to clearly describe a system and help program designers: • summarize existing knowledge and hypotheses about a system, • select and prioritize important components of the system to monitor, • identify and prioritize critical uncertainties for research, • communicate understanding of the system to all program participants and encourage interdisciplinary dialog, • facilitate review of the program by outside experts by summarizing system complexities in a digestible form (Atkinson et al. 2004).
2.1.2 Development of Conceptual Models SFCN used an adaptive managementoriented framework in designing its conceptual models. This framework links causes of change (physical drivers and anthropogenic stressors) to the state of the environment and to management activities as well as identifying areas of uncertainty that could affect decisionmaking (see Figure 2-A). Similar management-oriented approaches have been applied in other ecosystem management programs, although the terminology varies (New Zealand Ministry for the Environment, 1997; Gibbs et al., 1999; Bertram and Stadler-Salt, 2000; Atkinson et al., 2002; California Resources Agency, 2002; Noon, 2003; MHCP, 2003; CVMSHCP, 2004 draft; RECOVER, 2004; Atkinson et al. 2004). To facilitate the identification and prioritization of vital signs, SFCN divided the ecosystems in the South Florida and Caribbean parks into six ecological zones and developed conceptual models for each plus one extensive sub-model that relates to two of the marine zones:
There are many different types of conceptual models. Sometimes confusion
35
South Florida / Caribbean Network Vital Signs Monitoring Plan
• • • • • • •
Freshwater wet prairies and marshes Forested wetlands and uplands Island interiors Coastal wetlands Florida and Biscayne Bays Coastal shelf and deep oceanic Marine Benthic Communities Submodel The biological communities in these ecological zones are assumed to be affected by similar physical drivers and the same general set of stressors. These ecological zone conceptual models were reviewed and used to focus discussion and identification of indicators at the SFCN Vital Signs Indicator Identification Workshops in January – March 2006 described in Chapter 3.
•
•
• •
Associated States: 2005 (Waddell 2005) Comprehensive Wildlife Conservation Strategy for the U. S. Virgin Islands (U.S. Virgin Islands Division of Fish and Wildlife 2005) The Everglades Handbook: nd Understanding the Ecosystem, 2 Edition (Lodge 2005) The Big Cypress National Preserve (Deuver et al. 1979) South Florida Multi-species Recovery Plan (USFWS 1999)
A brief summary of each zone conceptual model is provided below. Each of these models is given in more detail in Appendix J with various sub-models including vegetation-process models (e.g., vegetationfire-hydrology) and food web model diagrams from the literature where appropriate to help explain complex topics. The relationships among these various models are shown in Figures 2-B and 2-C. Park-specific public-friendly conceptual model diagrams were also created summarizing issues for each park (see Appendix J.10). Appendix K lists all federal and state listed species. Appendix M lists invasive plant species (but not all exotics) and Appendix N lists all known exotic animals in SFCN parks.
The conceptual models draw strongly from the available literature plus consultation with park management. The reader is especially referred to the following references for more details: • Comprehensive Everglades Restoration Program conceptual models (Ogden 2004; Davis 2004; Deuver 2004; Browder et al. 2004; Rudnick 2004) • The State of Coral Reef Ecosystems of the United States and Pacific Freely
Table 2-A. South Florida and Caribbean Ecological Zones and related network parks. Ecological Zones BICY EVER BISC DRTO VIIS BUIS SARI Freshwater wet prairies & marshes Forest uplands and wetlands Coastal wetlands Island interior Florida and Biscayne Bays Coastal shelf & deep oceanic
X X X
X X X X X X
36
X X X X
X X
X X
X X
X X
X
X
X
X
Chapter 2: Conceptual Models
Anthropogenic Stressors
State of Environment Physical System Drivers, Key Background Attributes, & Zone Extent
Management Actions
Biological Drivers & Attributes Primary Producer Dynamics
Consumers Dynamics:
e.g., Vegetation, coral or seagrass community composition, structure, function, succession, productivity
e.g., Biological communities & food web dynamics
MANAGEMENT-ORIENTED CONCEPTUAL MODEL Figure 2-A. Key components of management-Figure 2-A. Key components of managementoriented conceptual models. Conceptual models facilitate adaptive management by showing how system drivers, stressors and management actions are hypothesized to affect key components of the environment and their interactions. The components of conceptual models include: • Anthropogenic Stressors: human-associated activities or side-effects thereof that either promote or inhibit change in the state of the environment such as water management, fire suppression, and contaminants. • Physical System Drivers, Key Background Attributes, & Extent of Zone: part of the state of the environment that are important physical processes and frequently either drive or restrict change such as Hydrology, Fire Frequency and Severity, Temperature Range, or Frost Frequency. Key background attributes such as Geology and Climate fundamentally shape the system. And for nearly all of the zones, the actual size, distribution, and shape of the zone itself may change. This plays a key role in affecting the biological components of the system. • Biological Drivers and Attributes: Primary Producer Dynamics and Consumer Dynamics: these include biotic components and interactions in the system such as food web dynamics, plant succession, keystone species, etc. • Management Actions: ongoing or potential management actions in response or anticipation of changes in the State of the Environment. These are not typically included in the diagrams, but are instead listed at the end of each conceptual model.
37
38
Coastal shelf / oceanic ecological zone
Florida & Biscayne Bays ecological zone
Island interior ecological zone
Coastal wetlands ecological zone
Forested uplands and wetlands ecological zone
Freshwater wet prairies and marshes ecological zone
Marine Benthic Communities sub-model
Food web diagram
Vegetation-hydrology diagram
Food web diagram
Vegetation-hydrology diagram
Vegetation-fire figures & diagrams
Vegetation-hydrology figures
Vegetation-fire diagram
Food web diagram
Figure 2-B. Inter-relationships among south Florida and Caribbean Network conceptual models and sub-models. Figures in blue represent the models developed in detail in this report. represent sub-model figures included in the larger models.
South Florida & Caribbean Region-wide model
Seagrass community eutrophication diagram
Food web diagram
Relation between hardbottom & soft-bottom communities
South Florida / Caribbean Network Vital Signs Monitoring Plan
Chapter 2: Conceptual Models
Figure 2-C. South Florida / Caribbean Network Ecological Zones.
39
South Florida / Caribbean Network Vital Signs Monitoring Plan
2.2
Top: Sawgrass marsh with periphyton on water surface at Shark River Slough in EVER. Bottom: Muhly grass wet prairie in glade near Long Pine Key in EVER during dry season.
Freshwater Marsh (includes slough): Freshwater marshes are graminoid/herbaceous wetlands with long-hydroperiods of historically around 10-12 months, although postEverglades drainage hydroperiods range from 7-12 months. The fasterflowing center of the broad marshy river is called a “slough.” However, the topography is more complex than a single flat river. Slightly elevated sawgrass “ridges” are interspersed with deeper “sloughs” with tree islands called hammocks or heads dotting the landscape. Vegetation in these long-hydroperiod marshes is typically dominated by sawgrass (Cladium jamaicense), spikerush (Eleocharis spp.), and panicgrass (Panicum hemitomon, P. rigidulum) (Rutchey et al. 2005).. (Please note: Tree islands are covered in greater detail in the Forested Uplands and Wetlands zone). Everglades National Park contains two distinct sloughs: Shark River Slough, the main slough, and Taylor Slough, a narrow, eastern slough that flows into northeast Florida Bay. Lostmans Slough and a series of other sloughs through Big Cypress National Preserve supply freshwater to northwest Everglades and the Ten Thousand Islands.
Freshwater Wet Prairies and Marshes Ecological Zone
The Freshwater Wet Prairies and Marshes Ecological Zone is a vast, shallow, clearwater, oligotrophic (low nutrients) system that includes the deeper regions of Shark River Slough, Taylor Slough, Lostmans Slough, and Mullet Slough plus large expanses of wet prairies. This zone expands northwards outside the EVER and BICY into the state-managed Water Conservation Areas and the hydrology of the Everglades is highly dependent on water management in these areas.
Some deeper areas of sloughs and alligator holes, plus canals and borrow pits, have water all year round and typically contain open water with a myriad of sparse graminoid and emergent vegetation such as spikerush (Eleocharis spp.), panicgrasses (Panicum spp.), low stature sawgrass (Cladium jamaicense) , cattail (Typha spp.), arrowhead (Sagittaria spp.), pickerelweed (Pontederia cordata), waterlily (Nymphaea spp.), green arum (Peltandra virginica), swamplily (Crinum americanum), spiderlilies (Hymenocallis spp.) (Rutchey et al., 2005). These areas concentrate larger aquatic species during drydown periods, becoming popular wildlife viewing areas (e.g., Anhinga Trail).
40
Chapter 2: Conceptual Models
Freshwater wet prairies: Wet prairies border the deeper marshes; they have shorthydroperiods (historically 5-9 months, but post-drainage around 2-8 months) and they are dominated by graminoid/ herbaceous plants. Wet prairies include marl prairies, shortsawgrass prairie, muhly prairie, mixed grass/sedge prairies and rocky glades prairies and typically include vegetation dominated by muhly grass (Muhlenbergia filipes), little bluestem (Schizachyrium scoparium), Gulfdune paspalum (Paspalum monostachyum), black sedge (Schoenus nigricans), sparse sawgrass species (< 1.5 m tall), bluejoint panicgrass (Panicum tenerum), sparse beakrush (Rhynchospora sp.), and/or cordgrass (Spartina bakeri) (freshwater only) (Rutchey et al. 2005).. These large wet prairies have marl sediments (marl is a calcareous material produced by periphyton that settles on the limestone). These prairies extend on either side of the deeper Shark River and Taylor Sloughs and also occur as glades among forest areas.
preservation value; the rich abundance and diversity of wading birds, fish, and vegetation including unique and rare listed species; recreational fishing, canoeing, and wildlife viewing opportunities; their cultural heritage; and as a watershed for Florida Bay and the Ten Thousand Islands. A diagram showing the key drivers and stressors affecting vegetation community and consumer community dynamics is given in Figure 2-D. Issues are briefly summarized below with more details provided in Appendix J.3. Some of the most important drivers impacting the wet prairies and marshes vegetation community dynamics include hydrology, major weather events (hurricanes, droughts), fire, water quality, sea level rise and the underlying geology, topography, and soils. The main physical driver in this system is the surface water hydrology coupled with the flat topography. Seasonal rains historically caused Lake Okeechobee to overflow in a shallow, wide sheet that moves at a leisurely rate that averages around 100 feet (30 meters) per day. This process channeled life-giving waters through the Water Conservation Areas into Everglades National Park and out into
The freshwater wet prairies and marshes of EVER and BICY are valued for their unique ecosystems with world-wide
41
South Florida / Caribbean Network Vital Signs Monitoring Plan
wet prairies and marshes zone. Fire suppression can allow the marsh-forest ecotone to shift as shrubs and trees (including mangroves) gradually invade the wet prairies and marshes. Unseasonal human-initiated fires not only affect vegetation composition and structure but potentially topography as dry-season fires burn the peat substrate. Off-road vehicles have created discernable trails in BICY.
Great egret at Anhinga Trail, EVER.
A freshwater marshes and prairies food web is provided in Figure 2-E. The major driver affecting food web community dynamics is changes in hydrology (amount, timing, duration, and quality). When the fish and large macroinvertebrates of this vast “river of grass” are concentrated along drying fronts, they have historically supported large numbers of wading birds (e.g., white ibis [Eudocumus albus], snowy egrets [Egretta thula], great egrets [Ardea albus], wood storks [Mycteria americana], little blue herons [Egretta caerulea], tricolor herons [Egretta tricolor]), alligators (Alligator mississippiensis), and other wildlife. The major anthropogenic stressors are the water diversions, canals, levees, and water level reversals that have severely altered the system surface water hydrology, (i.e., flood duration, depth, seasonality, and effects of droughts). This in turn has impacted the entire food web with reductions in the biomass of fish, amphibian, and invertebrates produced in the vast wetland and consequent declines in wading bird communities and shifts in locations of supercolonies. Alligators likewise move out of the drying wet prairies into deeper sloughs, borrow pits, and canals. Alligators are important biological drivers which, in addition to being an important top predator, maintain and enhance alligator holes which can provide important refugia during the dry season. The major toxic contaminant problem is mercury which is aerially deposited, becomes methylated and bioaccumulates in mid- and top-level predators (e.g., wading birds, large fish, pig frogs [Rana grylio], and panthers [Puma concolor coryi]). Pesticides from agriculture outside the park can also
Florida Bay. Wetland vegetation community composition and structure changes in response along ecotones from long-hydroperiod marshes and sloughs, especially in the Water Conservation Areas (WCAs), Shark River Slough and Taylor Slough, to short-hydroperiod wet prairies. Within the WCAs, Shark River Slough and Taylor slough there is a patterning of ridge and slough formation interspersed with tree islands which play important roles for the fauna in the park. Other key drivers are major weather events such as droughts, which sharply impact this wetland system, and hurricanes, which can carry salt water far inland, nutrient dynamics (historically this is a low nutrient system), water chemistry (e.g., pH, dissolved oxygen), the periphyton mat which is an important base of the food web and is responsive to changes in flood duration and water quality, and fire size, severity, and return interval. Pesticides and phosphorous enrichment from agricultural areas north and east of EVER and BICY are also a concern. Phosphorous enrichment allows abnormal expansion of cattails into wet prairies and sloughs, alters vegetation composition and structure, and shifts periphyton composition into less digestible forms for other organisms. Sea level rise is expected to cause shifts in the mangrove-marsh ecotone as mangroves and other coastal wetlands move into the
42
Chapter 2: Conceptual Models
affect aquatic invertebrates, fish and amphibians and may also bioaccumulate up the food chain.
The vital signs that relate to the Freshwater Wet Prairies and Marshes Zone conceptual model include:
Other stressors include land use change, invasive species and visitor use. Land use change is resulting in the reduction in habitat outside parks that affects regional species such as wading birds as well as increasing edge effects and humaninitiated fires. Invasive plants and animals are a major problem with new predators being established (e.g., constrictors and pythons [Boa constrictor, Python spp.], Cuban tree frogs [Osteopilus septentrionalis], and Mayan cyclids [Cichlasoma urophthalmus)). Other invasive species such as apple snails (Pomacea “canaliculata group”) and brown hoplo (Hoplosternum littorale) are rising concerns (see Appendix N for a complete list). The primary visitor use disturbances include roadkill along Tamiami Trail and park roads killing animals such as alligators, turtles, and otters, plus off-road vehicle use in BICY which is a stressor in the dry season. Airboats used to be a stressor but are now restricted within Everglades National Park.
Air Quality-Deposition Air Quality-Mercury American Alligator Amphibians Aquatic Invertebrates in Wet Prairies & Marshes Colonial Nesting Birds Contaminants Fire Return Interval Departure Florida Box Turtle Freshwater fish and large macroinvertebrates Invasive/Exotic Animals Invasive/Exotic Plants Land Use Change Landbirds Nutrient Dynamics Periphyton (Freshwater) Surface Water Hydrology Vegetation Communities Extent & Distribution Visitor Use Water Chemistry Wetland Ecotones and Community Structure Wetland Substrate
The key management issues in the Freshwater wet prairies and marshes Ecological Zone include rehabilitation of system hydrology, fire management, controlling and preventing the introduction of invasive plants and animals, reductions in phosphorous loading from outside the park, determining methods to reduce or mitigate mercury bioaccumulation, managing recreational impacts, and protection and management of rare plants and animals and their habitats.
43
Alligator at Anhinga Trail, EVER. The permanently flooded borrow pits at Anhinga Trail in EVER have become a popular wildlife viewing area.
South Florida / Caribbean Network Vital Signs Monitoring Plan
Comprehensive Everglades Restoration Plan map of program components. From Comprehensive Everglades Restoration Plan web page http://www.eve rgladesplan.org /about/rest_pla n_cerpmap.cfm. (downloaded 8/10/2005)
44
45
Anthropogenic Stressors
Physical Drivers & Attributes
Rainfall, droughts
Climate cycles
Alligators maintain & widen holes
Regional extent, distribution & connectivity of zone
Deeper holes, moats, depressions, sloughs as aquatic refugia
Sea-level rise
Roads
Fire return interval, size, severity
Temperature range, frost frequency
Habitat conversion
Water diversions, reversals
WQ-Chemistry (DO, pH, turbidity salinity gradient,)
Periphyton
Invasive/ exotic plants
Wetland ecotones and community structures (e.g., short- vs. long-hydroperiod communities, tree encroachment on prairies, Typha spp., etc.)
Vegetation Communities Extent & distribution
Primary Producer dynamics, e.g., structure, composition, abundance, diversity, richness, disease, herbivory, competition, succession, transport, demographic rates, recruitment
Wetland substrate: Peat/ marl formation
Contaminants (e.g., Hg, ↑P pesticides, other)
Land use change: Rapid urban development
Surface water hydrology (depth, timing, duration, extreme events, seasonal drydowns that concentrate aquatic fauna)
Underlying geology
Topography (ridges, sloughs, rocky glades marl prairies)
Major weather events
Fire suppression & alt. timing
Agriculture
Nonconsumptive human disturbance
WQ – Nutrient Dynamics, Contaminants
Air quality (deposition, mercury)
Introduce invasive species
Harvest (fishing, hunting, collecting)
Trash
Aquatic invertebrates
Freshwater fish & large macro-invertebrates
Invasive/exotic animals Species at Risk (T&E, rare)
Reptiles Terr. Inverts.: Butterflies
Consumer dynamics e.g., structure, composition, abundance, diversity, richness, disease, predation, competition, decomposition, transport, demographic rates, recruitment, extirpations, establish new populations Mammals Alligators Colonial nesting birds (Wading birds) Landbirds Amphibians
Groundwater hydrology
Canals, levees, borrow pits
↑ Visitor Use: Tourism,recreation, boating, fishing
Figure 2-D. South Florida wet prairies and marshes ecological zone conceptual model diagram. Solid and dotted lines show assumed effects of anthropogenic stressors, physical and biological drivers and attributes. Boxes with red print directly relate to a Vital Sign. (Use of dotted lines is used to clarify and does not indicate lesser importance).
Biological Drivers & Attributes
Global climate change
Chapter 2: Conceptual Models
46
FLORIDA REDBELLY TURTLE
DETRITUS & ASSOCIATED BACTERIA/FUNGI
CRAYFISH
OLIGOCHAETES, GRASS SHRIMP, AMPHIPODS, SMALL LARVAL INSECTS
MOSQUITOFISH, GOLDEN TOPMINNOW, MARSH KILLIFISH, BLUEFIN KILLIFISH
PIG FROG
WATER SNAKES
OTTER, MINK
PERIPHYTON
TADPOLES, FLAGFISH, SAILFIN MOLLY, LEAST KILLIFISH
BLUEGILL
LARGEMOUTH BASS, WARMOUTH SPOTTED SUNFISH, YELLOW BULLHEAD FLORIDA GAR
LARVAL & ADULT DRAGONFLIES
WADING BIRDS, ANHINGA
SEMINOLE RAMSHORN
APPLE SNAIL
REDEAR SUNFISH
SNAIL KITE, LIMPKIN
Figure 2-E. Wet prairies and marshes food web. Boxes with red print relate to proposed vital signs [Figure modified from Lodge 2005; used with permission].
MACROPHYTES SEEDS/FRUITS
MARSH RABBIT, ROUNDTAILED MUSKRAT
WHITETAILED DEER
BABY
SOFTSHELL TURTLE
ALLIGATOR JUVENILE
COOT, MOORHEN, PURPLE GALLINULE
BOBCAT
RACOON
PANTHER
VULTURES
South Florida / Caribbean Network Vital Signs Monitoring Plan
Chapter 2: Conceptual Models
2.3
Forest Uplands and Wetlands Zone
The Forest Uplands and Wetlands Zone is located in EVER and BICY and consists of pine rocklands and flatwoods, temperate and sub-tropical hardwood hammocks, tree islands, cypress swamps, strands and domes, and dwarf cypress. Considerable overlap exists between this zone and the wet prairies, marshes, and sloughs zone as fire and hydrology allow trees to either invade or be eliminated from marshlands. A few of the larger vegetation communities are described below. Other forest and woodland communities are described in Rutchey et al. (2005). Slash Pine Woodland: Slash pine (Pinus elliottii var. densa) is the dominant overstory species typically occurring in a matrix of diverse herbaceous/graminoid or shrub understory, often including bluestem (Andropogon spp.), wax myrtle (Myrica cerifera), saw palmetto (Serenoa repens), among others (Rutchey et al. 2005). Fire is an essential process for survival of the pine community, clearing out the shade-tolerant hardwoods. Slash pine is fire-tolerant due to its multi-layered bark of which only the outer bark is scorched during fires and due to the long-pine needles protecting meristems. The underlying substrate strongly impacts the understory composition creating two distinctive communities: • Slash pine rocklands grow on top of rocky limestone ridges and are found at Long Pine Key in EVER and in southeast BICY, (e.g., near Pinecrest). In southeast BICY, a thin layer of sandy soil may be present overlaying limestone rock and these pine woodlands can be considered a bridge between the pine rocklands and flatwoods (Snyder et al. 1990). • Slash pine flatwoods grow on poorly drained, acidic, sandy substrate, (e.g., Bear Island in BICY).
From top to bottom: Pine rocklands in EVER, hardwood hammock in EVER, and cypress forest strand during dry season in BICY.
47
South Florida / Caribbean Network Vital Signs Monitoring Plan
Slash pine rocklands are particularly rare worldwide and contain many rare understory and epiphytic species. Slash pine flatwoods are more common throughout central Florida and occur more typically in BICY. Although the overstory is similar in these two communities, the understory communities differ, causing fire to move differently through these woodlands.
Fire in BICY. Fire is a major driver in Everglades and Big Cypress.
thrive in the moisture-laden air inside the hammock. Cypress Forest: Pond Cypress (Taxodium ascendens) and Bald Cypress (T. distichum) are deciduous conifers that thrive in ponded water and slow seepage swamps. Vast forests cover BICY and extend into EVER. These trees form dense clusters called cypress “domes” in natural waterfilled depressions. Trees in the deeper water at the center grow taller than those further away from the center. Cypress “strands” occur along sloughs and running water. In EVER and BICY, stunted cypress trees, called dwarf cypress, grow in sparse stands in wet prairies.
Sub-tropical and Temperate Hardwood Hammocks: Hammocks are dense stands of sub-tropical and temperate hardwood trees whose composition depends on flood, frost, and fire frequency and along with fire severity. Typical communities include “Sub-tropical hardwood forest,” “Temperate hardwood forest,” “Hardwood swamp forest” and “Bayhead Forest” (for others see Rutchey et al. 2005). Hammocks appear as teardrop-shaped tree islands in the middle of the ridge-andslough marshes or as hardwood areas within pine or cypress forests. Some typical sub-tropical species include mahogany (Swietenia mahogoni), gumbo limbo (Bursera simaruba), and cocoplum (Chrysobalanus icaco) whereas familiar temperate species include live oak (Quercus virginiana), laural oak (Quercus laurifolia), and hackberry (Celtis laevigata) (Rutchey et al. 2005). Shaded from the sun by the tall trees, ferns and bromeliads
The Forest Uplands and Wetlands Ecological Zone is valued for its rare vegetation communities, rare and endangered plants and animals, hiking, wildlife viewing, canoeing, and additionally in BICY for recreational fishing, hunting of deer and pigs, off-road vehicle (ORV) use, and oil and mineral extraction. The pine rockland community on Long Pine Key in EVER and in some areas of the Florida Keys is unique and contains many plants endemic to south Florida. EVER and BICY contain the largest dwarf cypress stands worldwide. The term “Big Cypress” refers to the vast stands of cypress rather than the size. The larger “bald cypress” trees were logged in the past two centuries. The few remaining giants are extremely old; some with trunks over six feet wide and several hundred years old. Sub-tropical hardwood “hammocks” contain tropical vegetation that has successfully dispersed to south Florida from the Caribbean, including rare orchids and bromeliads. Tree islands of varying size dot the wet prairies and marshes which provide important nesting habitat for species in the wet prairies and marshes zone such as alligators, redbellied turtles and wading birds. This zone also contains many cultural sites used by the Miccosukee Indian Tribe.
48
Chapter 2: Conceptual Models
A diagram showing the key drivers and stressors affecting vegetation community and consumer community dynamics is given in Figure 2-F. Issues are briefly summarized below with more details provided in Appendix J.4. Some of the most important drivers impacting forest vegetation community dynamics include hydrology, climate (temperature range, frost frequency, rainfall), major weather events (hurricanes, droughts), fire, water quality, dispersal agents, and the underlying geology, topography, and soils. Similar to the wet prairies and marshes, much of the surface water hydrology in this zone is dependent on influx of water from areas north of EVER and BICY. Minor differences in elevation cause differences in flood duration which in turn affect forest community composition and structure along hydrological gradients. Most forest tree species in this zone tolerate varying degrees of flood duration resulting in ecotonal differences in overstory and even larger ecotonal differences in understory forest species composition structure. The major anthropogenic stressor on the system is the alterations in regional hydrology due to water diversions and canals south of Lake Okeechobee plus additional diversions to the north and west of BICY. The limestone geology of south Florida is highly porous causing a strong interrelationship between groundwater and surface water levels. Thus changes in surface water hydrology also affect groundwater levels in the slightly elevated drier hammocks and pine “uplands”.
cypress dome interiors than would occur in the wet season causing greater damage to some rare communities. Much of these forests are in succession stages from logging and agriculture that occurred in the early 1900’s. Habitat loss has also impacted some of the rarer plant species reducing them to a few populations within park boundaries. Rising urbanization could also increase aerial deposition of nitrogen and sulfur in the system as well as pollutants which may especially impact some rare plants. Nutrient enrichment due to agricultural runoff (EVER, BICY), fish camps and inholdings (BICY), especially phosphorous, is a concern and may affect forest community structure. Wading bird nesting colonies may also cause localized impacts on nutrient enrichment. Frost frequency determines the northward and coastal-to-inland expansion of sub-tropical species including rare plant species and may change with global climate change. Major weather events such as hurricanes can cause direct physical destruction to forests and resulting canopy openings are rapidly exploited by invasive plant species. Invasive plants and animals remain one of the greatest threats to this zone with invasive trees (e.g., Australian pine [Casuarinas spp.], Melaleuca [Melaleuca spp.]), invasive shrubs (e.g., Brazilian pepper [Schinus terebinthifolius]) and vines (e.g.,
Other non-hydrological drivers are important as well to forest community composition and structure. Fire size, severity and return interval is a major driver in the system that restricts hardwood species expansion into pinelands and cypress, forest expansion into the wet prairies and marshes, and tree island size and expansion. Unfortunately, human-initiated, dry season fires and droughts can allow fires deeper access into moist hammock and
49
Alligator with large non-native python in its jaws. (Photo by Everglades National Park staff).
South Florida / Caribbean Network Vital Signs Monitoring Plan
Lygodium, (Lygodium spp.]) causing major structural changes in forest communities, changing hydrology and fire dynamics, and reducing habitat quality for rare plants and animals (see Appendixes M and N for complete lists).
disturbance occurs around campgrounds and trails. Although wading birds primarily feed in the wet prairies and marshes zone and coastal wetlands zone, they also feed in the forested wetlands and their nesting colonies frequently occur in the forests and tree islands and need to be free from invasive predatory species and disturbance.
The food web is similar to the wet prairies and marshes zone given in Figure 2-E, except that periphyton is largely missing under the tree canopy and detritus, insects, and influx from marsh areas presumably play a larger role. Many of the drivers and stressors affecting the food web are similar to the wet prairies and marshes zone including changes in surface water hydrology (timing, depth, duration, and quality), mercury contamination, and invasive animal species. However, other drivers and stressors are different, including land use changes, global climate change, additional contaminant concerns, and visitor use. Historic logging coupled with the largescale loss of forested lands to development, especially the rare pine rocklands community, and fragmentation of remaining areas, has impacted many of the species dependent on these communities including cavity-nesting landbirds such as bluebirds (Sialia sialis) and red-cockaded woodpeckers (Picoides borealis), rare butterflies such as the Schaus swallowtail (Papilio aristodemus ponceanus), old-growth species such as the presumed extinct ivory-billed woodpecker (Campephilus principalis), and land-bound species such as the Florida panther, snakes, and the Florida box turtle (Terrapene carolina bauri). Historic hunting and collecting has also impacted some species. Climate change may cause further changes by influencing the timing of migration and nesting of species such as neotropical migratory landbirds. Mosquito spraying within EVER is a concern, especially regarding some of the rare butterfly species. Oil drilling activities have the potential for spills and contamination in BICY. The primary visitor use disturbance is roadkill (both parks), ORV use (BICY), hunting (BICY), fishing (BICY), and illegal collection (both parks). Some additional
The key management issues in the Forest Uplands and Wetlands Ecological Zone include rehabilitation of system hydrology, fire management, control and prevention of introduction of invasive plants and animals, reductions in phosphorous loading from outside the park, determining methods to reduce or mitigate mercury bioaccumulation, managing recreational and extractive use impacts, managing hunting and fishing, and protection and management of rare plants and animals. The vital signs that relate to the Forest Uplands and Wetlands Zone conceptual model include: Air Quality-Deposition Air Quality-Mercury American Alligator Amphibians Butterflies Colonial Nesting Birds Contaminants Fire Return Interval Departure Florida Box Turtle Florida panther Forest Ecotones and Community Structure Freshwater fish and large macroinvertebrates Imperiled & Rare Plants Invasive/Exotic Animals Invasive/Exotic Plants Land Use Change Landbirds Nutrient Dynamics Surface Water Hydrology Vegetation Communities Extent & Distribution Visitor Use Water Chemistry Wetland Substrate
50
51
Anthropogenic Stressors
Physical Drivers & Attributes
Major weather events
Roads
Climate cycles
Rainfall, droughts
Regional extent, distribution & connectivity of zone (including corridors)
Fire return interval, size, severity, timing
Temperature range, frost frequency
Habitat conversion
WQ-Chemistry (DO, pH, turbidity)
Imperiled & rare plants
Invasive/exotic plants
Forest Ecotones and Community Structure (e.g., shrub & tree encroachment on prairies, hammock expansion into pinelands, tree island change, etc..)
Vegetation Communities Extent & distribution
Primary Producer Dynamics, e.g., structure, composition, abundance, diversity, richness, disease, herbivory, competition, succession, transport, demographic rates, recruitment
Wetland substrate: Peat accretion & loss
Contaminants (e.g., Hg, ↑P pesticides, oil, other)
African dust
Trash
Aquatic invertebrates
Terrestrial. Invertebrates :Butterflies
Reptiles: Box turtles
Invasive/exotic animals
Freshwater fish & large macro-invertebrates
Amphibians
Alligators
Species at Risk (T&E, rare): FL Panther
Landbirds (esp. cavity nesting birds) Mammals
Consumer dynamics e.g., structure, composition, abundance, diversity, richness, disease, predation, competition, decomposition, transport, demographic rates, recruitment, extirpations, establish new populations, abnormalities, contaminant load
WQ –Nutrient Dynamics, Contaminants
Harvest: Fishing, hunting collecting
↑ Visitor Use: Tourism, recreation, camps, ORV use, fishing
Nonconsumptive human disturbance
Air quality (deposition mercury)
Introduce invasive species
Historic agriculture & logging
Groundwater hydrology
Canals, levees, borrow pits
Land Use Change: Rapid urban development (incl.inholdings)
Surface water hydrology (depth, timing, duration, extreme events, seasonal drydowns that concentrate aquatic fauna)
Agriculture
Underlying geology
Water diversions , reversals
Topography & soils (ponds, depressions, rocky glades, sandy substrate, ridges, sloughs, tree islands, etc..)
Fire suppression & alt. timing
Oil, gas, mineral extraction
Figure 2-F. Florida Forested uplands and wetlands ecological zone conceptual model diagram. Solid and dotted lines show assumed effects of anthropogenic stressors, physical and biological drivers and attributes. Boxes with red print directly relate to a selected Vital Sign. (Use of dotted lines is to clarify and does not indicate lesser importance).
Biological Drivers & Attributes
Global climate change
Chapter 2: Conceptual Models
South Florida / Caribbean Network Vital Signs Monitoring Plan
2.4
Top: Dry shrubland vegetation at BUIS. Bottom: “Spite Highway” through coastal hardwood hammock on Elliot Key, BISC.
sub-tropical coastal shrublands (coastal hardwood shrublands, nicker bean shrublands, coastal hardwood scrub), and sub-tropical coastal hammocks. Grasslands in the US Virgin Islands are typically an early successional stage from other land uses. Island interior vegetation communities are described more completely in USVI Division of Fish and Wildlife (2005) and Rutchey et al. (2005).
Island Interior Ecological Zone
The Island Interior Ecological Zone includes the terrestrial areas of islands in national parks that are inland of the mangroves and beaches. Beaches, mangroves, and tidal marshes are covered in the Coastal Wetlands Zone conceptual model (Section 2.5). The Island Interior Ecological Zone is found in VIIS on St. John, BUIS on Buck Island, inland areas of SARI, the keys in BISC, DRTO, and possibly a few islands in EVER in the Ten Thousand Islands and Florida Bay.
This community assemblage is valued for its unique and rare plants and fauna (see Appendix K), its dry tropical and subtropical vegetation, as stopover habitat for migrating and over-wintering landbirds, and its hiking and recreational communities. Smaller islands are valued as predator free nesting areas for some colonial nesting seabirds, shorebirds and wading birds and sea turtles.
Vegetation primarily consists of tropical dry shrublands, tropical dry forests, a limited amount of tropical moist forest,
A diagram showing the key drivers and stressors affecting vegetation community and consumer community dynamics is given in Figure 2-G. Issues are briefly summarized below with more details provided in Appendix J.5. The vegetation communities in this zone are strongly affected by climate, topography, tropical storms, sea level rise, rapid urbanization, invasive species, contaminants, historic and current land use, and possibly air quality. The hot climate coupled with little available standing freshwater leads to dry tropical and sub-tropical vegetation community composition that is adapted to such conditions. Freshwater exists in karst (BISC) or gut (VIIS, BUIS) formations and in ephemeral streams (VIIS, SARI). The steep elevation of USVI parks results in orographic effects and landslides that influence vegetation succession, composition and structure. The shallow elevation of islands in BISC, DRTO, and EVER makes them susceptible to complete inundation during storm surge events. Hurricanes cause physical damage to vegetation, resetting plant succession processes. Sea level rise may gradually cause shrinking of these island interior areas and in the case of South Florida
52
Chapter 2: Conceptual Models
parks, may result in their eventual loss over the next century if deposition processes cannot keep pace. Rapid urbanization on St. John and St. Croix is reducing and fragmenting habitat outside and within (inholdings) VIIS and SARI, increasing related stressors such as construction impacts, increased hydraulic loading on septic systems, increased solid waste, introduction of new invasive species, increased contaminants in the ephemeral streams on the islands, and possibly increased freshwater runoff from lawns into dry natural areas which alter plant and invertebrate communities. Much of the vegetation on these islands is in succession from historic land uses including agriculture, logging, and residential. Elliott Key, other Keys in BISC, and Garden Key and Loggerhead Key at DRTO have had historic residential homes, lighthouses, agriculture, logging, and, of course, Fort Jefferson on DRTO. Some facilities remain to support park staff housing, picnic areas and camping areas. Air quality is periodically reduced by African dust (all parks), volcanism (USVI parks), and urbanization effects which may impact soil nutrient levels.
Introduced goats in vegetation on St. John, USVI
provide predator-free habitat for seabird, shorebird, and wading bird colonies. Consequently, these smaller islands are strongly impacted by any introduction of non-native species (especially predators) or even arrival of urban-adapted native predators such as raccoons (Procyon lotor) when they historically were not present in large numbers on the islands. On St. Croix and St. John urbanization has had impacts on inland freshwater quality. Sedimentation from construction
Island food webs (see Figure 2-H) are strongly affected by island size, invasive species, and urbanization impacts. Island isolation coupled with island size, limited freshwater and founder effects has strongly impacted the foodwebs that have developed on each island. The dominant native organisms are birds, reptiles, amphibians (except BUIS and DRTO), bats and island insects. Large predators and herbivores were absent from DRTO and the USVI parks. Thus introduced species such as rats (Rattus rattus and R. norvegicus), mice (Mus musculus), goats (Capra hircus), deer (Odocoileus virginianus), mongoose (Herpestes javanicus) (VIIS, SARI only), and Cuban tree frogs, pythons (EVER, BISC) have had devastating effects on island foodwebs (see Appendix N for complete list). Introduced plant species are a problem, reducing habitat quality for native species (see Appendix M for invasive plant species). The smaller islands often
Construction occurring just outside SARI and right to the edge of the mangroves. Coral communities are just off-shore (2005).
53
South Florida / Caribbean Network Vital Signs Monitoring Plan
is filling in guts and impacting water quality which may in turn affect aquatic invertebrates, freshwater fish and amphibians (as well as coral reefs offshore). Nutrient enrichment is also a concern upstream of SARI. Other urbanization impacts include a rapid reduction in available habitat for species on these already small islands, increased roadkill and urban edge effects such as disturbance and introduction of new invasive species. Some visitor use disturbance occurs along trails and campgrounds.
Air Quality-Deposition Air Quality-Mercury Amphibians Bats-USVI Butterflies Coastal Geomorphology Colonial Nesting Birds Contaminants Forest Ecotones and Community Structure Freshwater fish and large macroinvertebrates Imperiled & Rare Plants Invasive/Exotic Animals Invasive/Exotic Plants Island Insects Land Use Change Landbirds Nutrient Dynamics Reptiles-USVI Surface Water Hydrology Vegetation Communities Extent & Distribution Visitor Use Water Chemistry
The key management issues in the Island Interior Zone include reduction of urbanization and inholding development impacts (VIIS and SARI only), control of and preventing the introduction of invasive plants and animals, management of recreation impacts, and protection and management of rare plants and animals. The vital signs that relate to the Island Interior Zone conceptual model include: Dry tropical forest on Buck Island, BUIS.
54
55
Anthropogenic Stressors
Physical Drivers & Attributes
Biological Drivers & Attributes
Extent, distribution, connectivity of island interior zone
Island size
Surface Water Hydrology (xeric)
Rainfall, temperature range
Coastal geomorphology & salt ponds & guts sedimentation
Major weather events
Climate cycles
Roads
Forest/scrub Ecotones & Community Structure
Vegetation Communities Extent & Distribution
Imperiled & rare plants
Invasive/exoti c plants
Fire
Introduce invasive species
NonConsumptive Human disturbance
Trash & debris
↑ Visitor use/ Tourism: ↑ Recreation
Historic & Current Harvest of rare spp.
Amphibians
Species at risk (T&E, rare)
Island insects, butterflies
FW fish & invertebrates
Reptiles
Landbirds Invasive/exotic animals
Bats
Top predators, e.g., Raptors, raccoons
Consumer dynamics e.g., structure, composition, abundance, diversity, richness, disease, predation, competition, decomposition, transport, demographic rates, recruitment, extirpations, reintroductions
Air Quality (Deposition, visibility)
African dust, volcanism
Contaminants
Water quality (Nutrients Dynamics, Chemistry, Sediment, Contaminants)
Urban edge effects, disturbance
Land Use Change: Rapid urban development (VIIS, SARI)
Primary Producer dynamics, e.g., structure, composition, abundance, diversity, richness, disease, herbivory, competition, succession, transport, demographic rates, recruitment, extirpations, reintroductions
Landslides (USVI)
Earthquakes (USVI)
Orographic effects (USVI)
Topography, slopes, soils
Geology, island origin
Habitat conversion
Historical land use (agric., logging)
Figure 2-G. Island interior ecological zone conceptual model diagram. Solid and dotted lines show assumed effects of anthropogenic stressors, physical and biological drivers and attributes. Boxes with red print directly relate to a selected Vital Sign. (Use of dotted lines is to clarify and does not indicate lesser importance.)
Dispersal distance to island
Sea level rise
Global climate change
Chapter 2: Conceptual Models
56
Detritus (decomposing flora & fauna incl. tidal detritus)
Inputs from coastal wetlands: Sea turtle eggs, Marine Fish
Primary consumers Island insects, incl. butterflies, aquatic invertebrates
Small Predators Birds, Bats, Lizards, Crabs, Freshwater fish, Amphibians (native & introduced*)
Mid-level Predators Snakes (native & introduced*), Introduced Amphibians*, Birds, Fish-eating Bats
Figure 2-H. Island interior food web. Introduced species have had a major impact and are indicated by a “*”. Red items are directly related to a selected Vital Sign.
Omnivores Pigs*, Rats*, Mice*
Large Predators Raptors, Raccoons, Mongoose*, Cats*
Vegetation (native & introduced*)
Small Herbivores Birds, Bats, Lizards
Large Herbivores Feral Donkeys*, Feral Goats*, Deer*, Iguanas*
South Florida / Caribbean Network Vital Signs Monitoring Plan
Chapter 2: Conceptual Models
2.5
inundation or only seasonal flushing. Red mangroves are more common along coastal areas and black and white mangroves more common inland. Black mangroves are dominant in areas with concentrated salinity due to evaporation (USFWS 1999). Hammock/berm forest mangroves are on elevated areas such as the “Buttonwood Ridge” in EVER. Dwarf or scrub mangroves that grow less than 5’ in height occur in areas of EVER, BICY, and the Florida Keys (USFWS 1999).
Coastal Wetlands Zone
The Coastal Wetlands Model includes mangrove estuaries, mudflats, beaches, halophytic prairies and marshes, coastal lakes and lagoons, some of which are described in greater detail below. This is a highly dynamic zone in which each of these communities transition into each other and back due to the drivers and stressors acting upon them. This ecological zone is found in all seven parks in the South Florida/Caribbean Network. Mangroves: Mangrove forests are found along shorelines and in the coastal channels and winding rivers in south and central Florida and the Caribbean. Red mangroves (Rhizophora mangle), identified by their stilt-like roots, black mangroves (Avicennia germinans) and white mangroves (Laguncularia racemosa) thrive in tidal waters, where freshwater mixes with saltwater. Buttonwood (Conocarpus erectus) is found at slightly higher elevations that are inundated during storms. Mangroves are only a narrow band in VIIS and SARI but can extend up to 12 miles inland in the Everglades (Smith, 1994).
Halophytic-tidal prairies and marshes: Halophytic prairies and marshes vary greatly in tidal inundation from frequent daily flooding to occasional tidal flooding during storms. Typical
Six mangrove community types are found within SFCN parks. These include overwash mangroves, fringe mangroves, riverine mangroves, basin mangroves, hammock/berm forest mangroves, and dwarf or scrub mangroves (USFWS 1999). Overwash mangroves include island areas that are frequently inundated or overwashed with tides. Fringe mangroves are thin forests bordering waterbodies such as the thin mangrove fringe found in VIIS and BUIS. Riverine mangroves occur in river floodplains and along tidal creeks and are daily inundated with tides, (e.g., Shark River in EVER). Basin mangroves occur in depressions both along the coast and further inland. These may receive daily tidal
57
Top: Red mangroves along western edge of Biscayne Bay, BISC.
Bottom: Salicornia marsh with dead black mangrove remnants from hurricane damage in EVER. Buttonwoods are in background on the left.
South Florida / Caribbean Network Vital Signs Monitoring Plan
important feeding areas for wading birds and shorebirds. Coastal lakes and basins: Coastal lakes and basins occur in EVER in the area of mangroves and tidal prairies typically ranging from oligohaline to mesohaline conditions. The submerged aquatic vegetation support seasonal populations of coot (Fulica Americana), scaup (Aythya affinis), widgeon (Anas americana) and pintail (Anas acuta)(Davis 2004b). Tidal flats: Tidal flats in Florida Bay and other coastal areas vary from calcareous, carbonate muds to sandy areas exposed during low tides and are popular feeding grounds for shorebirds and wading birds. Beaches: Beaches in the SFCN vary from narrow beaches fringed by mangroves, to some areas of wider sandy beaches in BUIS, DRTO and EVER, and include calcareous mud/sand beaches, coralline beaches, and gravel beaches.
Top: Salt pond in VIIS. Bottom: Sandy beach on Buck Island, BUIS
This coastal zone is valued for many reasons. Mangroves protect shorelines from erosion and dampen effects of wave action on coastal resources and nearby private property. Tidal wetlands and mangroves provide highly productive nursery habitat for juvenile fish, pink shrimp (Farfantepenaeus duorarum), bivalves, and conch contributing to commercial and recreational fisheries. Wading birds congregate here to feed in tidal flats, estuaries, salt ponds, tidal marsh and mangroves. Many bird species nest in the mangrove trees. Beaches and smaller mangrove islands provide nesting habitat for protected sea turtles and terns. Halophytic prairies and buttonwood areas provide important habitat for rare plants such as orchids and bromeliads. Beaches and tidal wetlands provide recreational and fishing opportunities for park visitors.
vegetation includes coastal cordgrass (Spartina spp.) and black rush (Juncus roemerianus). Typical halophytic herbaceous prairie vegetation can include saltgrass (Distichlis spicata), smutgrass (Sporobolus spp.), keysgrass (Monanthocloe littoralis), saltwort (Batis maritima), glasswort (Salicornia spp.) and sea purslane (Sesuvium spp.) (Rutchey et al. 2005). Salt ponds: Salt ponds occur in VIIS, BUIS, and SARI inside the mangroves that are maintained through tidal seepage or periodic breaching of the coastal berm. Such salt ponds can reach hypersaline conditions as water is evaporated. These serve as
58
Chapter 2: Conceptual Models
A diagram showing the key drivers and stressors affecting vegetation community and consumer community dynamics is given in Figure 2-I. Issues are briefly summarized below with more details provided in Appendix J.6. The coastal wetlands zone is highly dynamic zone influenced by freshwater inputs, currents and tides, sea level rise, major weather events, coastal geomorphology, and water quality. The mixture of freshwater inputs, currents and tides influences the salinity regime and coastal geomorphology which in turn strongly influence the vegetation community that establishes there. Mangrove estuaries are considered among the most productive in the world and are the climax community for this zone. Mangroves themselves contribute detritus, and mangrove roots provide substrate for algal growth – both of which greatly add to the estuarine and coastal productivity. This is an environment of extremes and vegetation must tolerate wide swings in inundation, and water chemistry (e.g., salinity, temperature, dissolved oxygen and pH). Mangrove community composition at a particular spot is a function of salinity, degree of tidal flushing, freshwater inputs, local topography, nutrients, soils, canopy closure, and time since disturbance. As sea level rises, the mangroves wetlands may either be able to remain in place due to soil accretion or may be pushed inland into freshwater marshes and forests or up against an urban edge. This will partially be offset by freshwater inputs in EVER, BICY and BISC which if restored from their currently low levels may help slow these ecotonal changes. Hurricanes and tropical storms, in addition to creating general vegetation destruction, can alter coastal geomorphology by causing breaks in berms, reconnecting/disconnecting salt ponds and lagoons to/from the sea, moving large amounts of sediment, and creating new berms. Storms can also cause sudden changes in inland movement of coastal wetlands by carrying salt water
and propagules inland. These alterations are difficult to predict. The vegetation in this zone is affected by other drivers and stressors as well. Sediment runoff from coastal development into coastal wetlands is a problem in VIIS with some salt ponds filling up and more depositing in the mangroves and some washing out to the coastal reefs. Nutrient enrichment could also lead to algal blooms which can then cause local dissolved oxygen problems for fish and aquatic invertebrates. Invasive plant species, such as Brazilian pepper (Schinus terebinthifolius), lather leaf (Colubrina asiatica), and Australian pine (Casuarina equisetifolia) are displacing native vegetation. Dredging outside the parks could bring contaminants into the park. Other sources of change are more localized such as boat groundings, illegal collection, herbicide use, and treetrimming by uninformed land-owners. However, if unmanaged, these smaller stressors can also have a large cumulative negative impact on the resources. The highly productive mangrove estuaries in turn provide productive nursery grounds for juvenile fish and invertebrates such as sea trout (Cynoscion nebulosus), common snook (Centropomus undecimalis), pink shrimp, bivalves and conch, and sawfish (Pristis pectinata). A
59
14-18 foot storm surge due to Hurricane Wilma impacts southwest Florida in 2005 (Downloaded from NOAA web page on 08/11/2006 http://www.srh.no aa.gov/mfl/events/ ?id=wilma).
South Florida / Caribbean Network Vital Signs Monitoring Plan
Entangled dead frigate bird on Buck Island, BUIS.
Baby sea turtles scramble to sea on Buck Island, BUIS.
Estuarine productivity varies with salinity, hydrology and nutrient status in the estuary which are all affected by freshwater input, tides, currents, and sea level. As low nitrogen, high phosphorous salt water mixes with high nitrogen, low phosphorous freshwater a highly productive interface is produced, particularly where Shark River meets the Gulf of Mexico. Similarly, changes in the salinity gradient affect productivity in the bays. Decreases in freshwater inputs to Everglades National Park over the past 50 years have resulted in increased salinity levels in Florida Bay and Biscayne Bay. This, in turn, has reduced estuarine productivity levels and fish production (Davis 2004b; Browder et al. 2004). The salinity gradient also affects the distribution and abundance of crocodiles (Crocodylus acutus). Adult crocodiles are able to tolerate higher salinities than alligators, but juvenile crocodiles need salinities close to fresh water (Davis 2004b). As the salinity gradient has moved inland, Biscayne Bay and Florida Bay mangrove areas have become more saline, resulting in an overall reduction in brackish habitat that is hypothesized to have negatively impacted crocodile populations as these young reptilians are sensitive to extreme salinity levels. In the Everglades, many wading bird colonies have greatly diminished in the mangrove areas around Florida Bay, presumably due to alterations in freshwater inputs, alterations in estuarine fish productivity and alterations in freshwater marsh and wet prairies fish and invertebrate productivity (Davis 2004b; Ogden 2004).
simplified food web model showing the relationship between mangrove wetlands and reef fish communities is given in Figure 2-J. The dense mangrove roots and tidal marshes provide protection for the smaller juvenile fish which later emigrate out into the bays and coastal shelf areas. The high abundance of fish and invertebrates, in turn, affect the nesting populations and distribution of colonies of wading birds and shorebirds such as wood storks, great egrets, roseate spoonbills (Ajaia ajaja), least terns (Sterna antillarum), roseate terns (Sterna dougailii), sooty terns (Onychoprion fuscatus fuscatus), brown pelicans (Pelecanus occidentalis), brown boobies (Sula leucogaster), masked boobies (Sula dactylatra), magnificent frigatebirds (Fregata magnificens), and others.
Some additional drivers and stressors affecting coastal wetland food webs include crocodilians, invasive species, contaminants, excessive trash, and visitor use. Crocodiles may play an important role in keeping some tidal channels open. Invasive estuarine species are a major concern in all parks with the Mayan cichlid already severely altering estuarine fish communities in Florida Bay (Davis 2004b). Other introduced cichlids are listed in Appendix N. Aquariums, ship
60
Chapter 2: Conceptual Models
bilge water and boat motors are all sources of introduction of aquatic invasives. Small islands in this zone have been critically important in providing predator free seabird, wading bird and sea turtle habitat and the introduction of invasive terrestrial predators, such as rats and pythons, or even trash-subsidized native predators such as raccoons can be devastating. Contaminants such as mercury, pesticides, herbicides, and oil from aerial deposition, urban runoff, ships, and off-shore dumping are all problems. Catastrophic oil or chemical spills are a real concern as all parks are near or contain shipping lanes and St. Croix contains an oil refinery. Excessive trash levels from off-shore dumping, lost nets and lines, and storm debris entangle and kill wading birds, seabirds, sea turtles and other fauna and clutter sea turtle nesting beaches. Illegal collection of rare plants, indigo snakes and other species are a continuing concern. Visitor disturbance of nesting seabirds and sea turtles and illegal collection of eggs or rare plants are continuing concerns.
The vital signs that relate to the Coastal Wetlands Zone conceptual model include: Air Quality-Deposition Air Quality-Mercury American crocodile Amphibians Bats-USVI Coastal Geomorphology Colonial Nesting Birds Contaminants Estuarine Salinity Patterns Focal Fish Species Forest Ecotones and Community Structure Invasive/Exotic Animals Invasive/Exotic Plants Island Insects Land Use Change Landbirds Mangrove-Marsh Ecotone Marine Exploited Invertebrates Marine Fish Communities Marine Infaunal Community Nutrient Dynamics Periphyton (Freshwater) Phytoplankton (Marine) Protected Marine mammals Reptiles-USVI Sawfish Sea Turtles Surface Water Hydrology Vegetation Communities Extent & Distribution Visitor Use Water Chemistry Wetland Ecotones and Community Structure
The major management issues in the Coastal Wetlands Ecological Zone include rehabilitation of freshwater and sediment inputs, reductions in or mitigation of contaminants and debris, control of invasive species and prevention of new introductions, management of recreation impacts, and protection and management of rare plants and animals.
Sooty terns and brown noddys, DRTO.
61
Anthropogenic Stressors
Physical System Drivers & Attributes
62
Crocodilians maintain channels
Climate cycles
Water diversions
Major weather events
Fire
Invasive plant species
Mangrove-marsh ecotones and community structure (e.g. , shoreline, mangrove, marsh encroachment inland, etc..) Imperiled & rare Phytoplankton, plants algal epiphytes
Vegetation Communities Extent & distribution
Harvest: Fishing, Collecting
WQ –Nutrient Dynamics, Contaminants
Air quality (deposition, mercury)
Introduce invasive species
Nonconsumptive human disturbance
↑ Visitor Use: recreation, boating, fishing
Trash, debris, flotsam, jetsam, groundings, lost fishing gear
Consumer dynamics e.g., structure, composition, abundance, diversity, richness, disease, predation, competition, decomposition, biological transport, demographic rates, recruitment, abnormalities, contaminant loads Focal fish species Colonial nesting Marine fish (juveniles) birds communities (juveniles) Island Insects Reptiles Bats Marine Exploited Amphibians invertebrates, Species at risk other invertebrates Landbirds (T & E, rare): Crocodile, Sea turtles, Marine Infaunal Invasive/exotic Manatees, sawfish Community animals
Temperature range, frost frequency
Canals, levees, physical alterations & structures (sea walls, roads, etc.)
Surface water hydrology (freshwater influx) WQ-Chemical (Salinity gradient, DO, pH, turbidity)
Rainfall
Contaminants- Acute & Chronic (e.g., Hg, oil, septic systems, catastrophic spills, accidents, tourist by-products)
Primary Producer dynamics, e.g., structure, composition, abundance, diversity, richness, disease, herbivory, competition, succession, transport, demographic rates
Topography, elevation, & distribution of soils/sediments
Water budget, depth, duration, periodicity of inundation, ET, Surface & Ground water interactions
Regional distribution, extent, connectivity, dispersal distance of zone
Coastal geomorphology (Beach & berm deposition & erosion; Soil/peat accretion in tidal wetlands & mangroves)
Tidal channels
Currents, tides, wave action
Sediment Underlying influx geology
Sea level rise
Dirt roads, construction (VIIS,SARI)
Sand from coral & organisms
Habitat conversion
Land use / urban & agric. development, marinas
Figure 2-I. Coastal wetlands ecological zone conceptual model diagram. Solid and dotted lines show assumed effects of anthropogenic stressors, physical and biological drivers and attributes. Boxes with red print directly relate to a selected Vital Sign. (Use of dotted lines is to clarify and does not indicate lesser importance.)
Biological Drivers & Attributes
Global climate change
South Florida / Caribbean Network Vital Signs Monitoring Plan
Chapter 2: Conceptual Models
ADULT GAME FISHES
PINK SHRIMP
JUVENILE FISHES
Figure 2-J. Mangrove estuarine effects on food web (From Lodge 2005; used with permission).
Fish among mangrove roots in VIIS.
63
South Florida / Caribbean Network Vital Signs Monitoring Plan
2.6
Florida and Ecological Zone
Biscayne
bottom historically has been covered by seagrass which shelters fish and shellfish and provides for much of the productivity in the bay. However, recent problems include seagrass dieoffs, algal blooms, and declining shellfish and sponge populations. Since the seagrass dieoff, the turbidity of the bay has increased.
Bays
The primary focus of this ecological zone is Biscayne Bay and Florida Bay although other much smaller bays exist in both the Ten Thousand Islands region and in the U.S. Virgin Islands parks. Top: Florida Bay from Flamingo, EVER. Bottom: Biscayne Bay looking towards keys in background. Water quality station visible in lower right.
Florida Bay: Florida Bay is a triangular-shaped, very shallow, carbonate mud and sand bay bordered on the southeast by the Florida Keys, on the north by the Everglades, and on the west by the Gulf of Mexico. Depths in most areas of the bay are 6 feet or less with many areas 3 feet or less. Much of the
Biscayne Bay: Within the boundaries of Biscayne National Park, Biscayne Bay is a shallow bay bordered on the west by a thin boundary of mangroves buffering it from a rapidly urbanizing south Florida. The Bay is bordered on the east by the northernmost extent of the Florida Keys. Depths in the bay are less than 15 feet with most considerably shallower. Light is able to reach the bottom throughout. Both Florida Bay and Biscayne Bay are valued for their nursery habitat for pink shrimp and harvestable fish, abundance and diversity of fish and crustaceans, feeding habitat for seabirds, shorebirds, and wading birds, and rare and listed species such as manatees (Trichechus manatus), crocodiles, sea turtles, and colonial nesting seabirds, shorebirds and wading birds. Recreational boating and fishing is popular in both parks. Commercial fishing is allowed in Biscayne Bay for fish, lobster (Panulirus argus), crabs, and pink shrimp. Biscayne Bay is also valued for its good water quality and clarity. A diagram showing the key drivers and stressors affecting vegetation community and consumer community dynamics is given in Figure 2-K. Issues are briefly summarized below with more details provided in Appendixes J.7 and J.9. The extent and health of the seagrass beds within both shallow bays as well as the mangroves and tidal marshes bordering the bays all contribute to primary and secondary productivity within the bays. Seagrass covers large portions of the softbottom areas of Biscayne Bay and Florida
64
Chapter 2: Conceptual Models
Bay. Seagrass community composition is a good indicator of water quality as composition changes in response to estuarine salinity patterns, nutrients levels, as well as currents, light, and time since disturbance. Seagrass beds in Biscayne Bay appear to be doing well. However, in Florida Bay a large seagrass dieoff occurred in 1987, the causes of which are still unclear and from which the bay has not recovered. Both Biscayne Bay and Florida Bay historically had greater freshwater surface and groundwater influx than at present. With the reduction of freshwater influx, both bays have become more saline with less areas of brackish water. Hardened structures such as the Flagler Railway have altered currents through Florida Bay and canals have restricted flows to Biscayne Bay which have reduced associated coastal wetlands. Rehabilitation of flows by the Comprehensive Everglades Restoration Plan (CERP) is expected to decrease the salinity in the bays which are expected to affect seagrass community composition as well as improving coastal wetlands. Effects of sea level rise are difficult to predict, but it may cause retreat of mangroves inland with some resulting expansion of both Biscayne and Florida Bays, increase in depths, alteration in currents within the basins in the bays, and increase of the tidal prism.
have resulted in algal blooms, especially in southern Biscayne Bay, Card Sound, Barnes Sound and northeastern Florida Bay. Algal blooms are destructive, cutting off light to seagrass communities and, as the algae decomposes, reducing oxygen for fish and invertebrates. Black water events have also occurred which appear algae related but whose cause is less clear. Excessive nutrients are thought to come from agricultural runoff, construction projects and malfunctioning septic systems. The extent of seagrass, mangroves and tidal marsh strongly affects the associated fish and invertebrate communities that utilize these habitats. A simplified food web model that applies to both the bays and marine areas is given in Figure 2-L. Approximately 70 percent of South Florida's recreationally and commercially important fishes, crustaceans, and shellfish spend a portion of their young lives in the bays’ protective environment. Fish and other fauna migrate between the bays and the productive coral reefs and areas outside the bays. Manatees spend considerable time foraging in seagrass habitats and dolphins are a frequent sight. Coastal wetlands of the bays provide important habitat for juvenile fish and invertebrates that later move deeper into the bays and out onto the reefs of the coastal shelf. Reductions in freshwater input coupled with habitat conversion and channelizing of flows have severely restricted and in places eliminated brackish water and brackish estuarine
Other stressors of seagrass and other submerged aquatic vegetation are also impacting resources. Scarring of seagrass beds occurs by boat groundings and propeller scars from careless boat drivers. Hurricanes can cause seagrass “blowouts” as well as increasing probabilities of boat groundings and debris which abrade habitats. Storms also alter coastal geomorphology and mud banks which in turn affect currents and tidal flushing. Seagrass scars can take decades to recover and can even expand through time depending on tides and currents. Damaging fishing methods such as trawls which drag across the bottom may also damage habitats. In addition to increased nutrient loading causing changes in seagrass communities, excessive nutrients
65
Seagrass bed in BISC.
South Florida / Caribbean Network Vital Signs Monitoring Plan
Bay has the potential to release contaminants which will affect the park. Storms also have the potential to cause contaminant spills as water treatment systems are overwhelmed and boats are capsized. As a consequence of these changes, biota in the bays are under stress. Fish communities are changing and some species such manatees, sawfish, and crocodiles are federally listed as endangered. Current major management issues in the Florida and Biscayne Bays Ecological Zone include rehabilitation of freshwater inputs, reductions in or mitigation of contaminants and debris, management of fishing, boating, and recreation, restoration of damaged seagrass or mangrove areas, protection and management of rare species, and determining cause of major seagrass dieoff and recovery of seagrass beds. Control of invasive species could become a larger concern in the future.
Water quality instrument in BISC.
habitat within the bays, especially Biscayne Bay, which in turn have greatly reduced nursery habitats for juvenile fish species, shrimp and crabs, causing local declines in species such as sea trout, common snook, red drum (Sciaenops ocellatus), tarpon (Megalops Atlanticus), oysters (Crassostrea virginica), manatees, and crocodiles and impacted shorebird, wading bird and seabird communities. The rapid increase in local human populations has lead to great increases in visitor use resulting in increased levels of boating and fishing that have strongly affected fish communities (both bays) and invertebrate communities (Biscayne Bay). In Biscayne Bay, abandoned or “ghost” traps continue to collect and eventually kill fish and crustaceans. Boat collisions with wildlife, especially manatees, remain a problem. Increases in contaminants and trash refuse have potentially impacted upper trophic level species such as dolphins, crocodiles, large fish, and manatees either directly or through changes in prey communities or bioaccumulation of toxins. Pollutants such as pharmaceuticals, birth control pill hormones, caffeine, antibiotics, etc. are an emerging concern as they are not normally filtered during sewage treatment. Dredging north of Biscayne
The vital signs that relate to the Florida and Biscayne Bays Zone conceptual model include: Air Quality-Deposition Air Quality-Mercury American crocodile Benthic Communities Extent & Distribution Coastal Geomorphology Colonial Nesting Birds Contaminants Estuarine Salinity Patterns Focal Fish Species Invasive/Exotic Animals Land Use Change Mangrove-Marsh Ecotone Marine Benthic Communities Marine Exploited Invertebrates Marine Fish Communities Marine Infaunal Community Nutrient Dynamics Phytoplankton (Marine) Protected Marine mammals Sawfish Sea Turtles Surface Water Hydrology Visitor Use Water Chemistry
66
67
Anthropogenic Stressors
Physical Drivers & Attributes
Biological Drivers & Attributes
Ocean currents, tides Major weather events
Introduce invasive species
Disease
Temperature range, extremes
Freshwater influx (Surface Water Hydrology & groundwater)
Canals, levees
WQ-Chemistry (Salinity gradient, DO, pH, turbidity)
Rainfall
Contaminants (e.g., Hg, oil, septic systems, EPOCs)
Land Use: Rapid urban development / habitat conversion
Phytoplankton (abundance & composition; harmful algal blooms)
Invasive/exotic plants
Boat groundings, anchor damage, prop damage
Transport to/ from other marine areas
Nonconsumptive human disturbance Boat collisions with wildlife
Trash, debris, lost fishing gear
Marine infaunal communities
Zooplankton
invertebrates, other invertebrates
Species at risk (T & E, rare): Crocodile, sea turtles, manatees, sawfish, dolphins
Communities (e.g. Bay fish community)
Invasive/exotic animals
Focal fish species (e.g., sharks, sea trout, snook)
birds
Consumer dynamics e.g., structure, composition, abundance, diversity, richness, disease, predation, competition, biological transport, demographic rates, sediment producers, eroders, recruitment, abnormalities, contaminant load Colonial nesting Marine Exploited Marine Fish
WQ – Nutrient Dynamics, Contaminants
Air quality (deposition, mercury)
Harvest in & outside zone, damaging fishing methods
Visitor Use: Tourism, recreation, boating, fishing
Figure 2-K. Florida and Biscayne Bays Ecological Zone conceptual model diagram. Solid and dotted lines show assumed effects of anthropogenic stressors, physical and biological drivers and attributes. Boxes with red print directly relate to a selected Vital Sign. (Use of dotted lines is to clarify and does not indicate lesser importance).
Marine benthic communities (e.g., seagrass density, composition)
Benthic Communities Extent & Distribution (e.g., seagrass, open sand, hard-bottom, etc..)
Primary Producer dynamics, e.g., structure, composition, abundance, diversity, richness, disease, predation, competition, biological transport, demographic rates, sediment producers, eroders, recruitment
Light penetration
Bay currents, waves, tidal prism
Climate cycles
Catastrophic spills / accidents
Sediment Underlying influx geology
Sea level rise
Water diversions,
Bay shape, extent, very shallow Bay depth & bathymetry, distribution of soft& hard-bottom sediments; Coastal Geomorphology (e.g mudbanks & basin dynamics)
Sediments from organisms
Influence of tidal wetlands
Hardened Structures, e.g. Flagler Railway
Global climate change (incl. UV penetration)
Chapter 2: Conceptual Models
68
Compete for space
HardBottom
Algae
Sunlight
SoftBottom
High nutrients
Compete for light & nutrients
Low nutrients Seagrass (soft-bottom community)
Coralivores Butterflyfish, fireworms
Herbivorous Fish Parrot fish, Surgeon Fish
Phytoplankton
Detritus (from mangroves, tidal wetlands, & decomposing marine flora & fauna)
Primary consumers Planktonivores, Zooplankton, infaunal community, detritovores, small algal grazers, filter feeders, e.g., periwinkle, sea urchins, shrimp, sponges
Small Predators & mobile invertebrate feeders wrasse, damselfish, trumpetfish, crabs, lobster
Mid-level Predators (predominantly piscivores) groupers, grunts, snapper, jacks, triggerfish, baraccuda, moray eels, sea turtles
Large predators of small fish & invertebrates: Baleen Whales
Figure 2-L. Simplified conceptual model of marine community food web in south Florida and Caribbean parks. The width of the connecting line represents the hypothesized effect strength. Sea turtles are located in both “Large Herbivores” & “Mid-level Predators” boxes.
Coral polyps w/ Zooxanthellae (hard-bottom community)
Large Herbivores Manatees, Sea turtles
Very Large Predators Piscivores (apex predators) Sharks, Large Groupers, Dolphins
South Florida / Caribbean Network Vital Signs Monitoring Plan
Chapter 2: Conceptual Models
2.7
Coastal Shelf and Deep Oceanic Ecological Zone
The Coastal Shelf and Deep Oceanic Ecological Zone includes the marine park areas with the exception of areas covered in the Florida Bay and Biscayne Bay model. Thus, this zone includes the marine areas of VIIS, BUIS, DRTO, SARI, BISC east of the Keys, and a small area of EVER northwest of Florida Bay. Included in this zone are soft- and hard-bottom benthic communities, the light-driven photic zone in the water column and the deep, aphotic zone. Much less is known about the deep aphotic zone which is only found in the deeper areas of BUIS 2001 expansion, the SARI underwater canyon, and the deeper areas of VICR (not yet included in the network of SFCN parks).
communities, seagrass communities and the marine consumer food web are described separately, they should be seen as inter-related.
The “Coastal Shelf and Deep Oceanic Ecological Zone” is valued for its commercial and recreational fishing (fish, lobster, crabs, conch, and shrimp), recreational boating, recreational diving and snorkeling, coral reefs and seagrass beds, abundance and diversity of marine life, and food web support for wideranging megafauna such as large fish, sea turtles, dolphins, sharks, and whales.
The extent and distribution of hardbottom and soft-bottom sediments affects the resulting benthic communities that emerge. Seagrass and other submerged aquatic vegetation dominate the softbottomed communities whereas hardand soft-corals, sponges and algae dominate the hard bottomed communities. Many of the stressors affecting seagrass are similar to the bays model with a few exceptions: changes in salinity are not much of an issue in the coastal zone with the possible exception of Salt River Bay in SARI and occasionally during large rain runoff events in VIIS and west EVER. Nutrient enrichment is a concern primarily due to malfunctioning septic systems, problems during major storms, and possibly large cruise ships which carry as many as 5000 people. Sediment runoff is a large concern in the USVI due to the rapid development occurring on steep slopes causing problems for both seagrass and coral communities. Disease and invasive species could become issues in the future. Algal blooms are rarely a problem but could increase in frequency as development continues.
A diagram showing the key drivers and stressors affecting vegetation community and consumer community dynamics is given in Figure 2-M. Issues are briefly summarized below with more details provided in Appendix J.8 and J.9. The marine ecosystem is interconnected. Healthy reefs are dependent upon healthy seagrass and mangrove communities which buffer reefs from land-based nutrient enrichment and sedimentation problems. Healthy reefs are also strongly dependent upon balanced fish and invertebrate food webs with sufficient levels of herbivores to keep algal overgrowth in check. In turn, healthy fish and invertebrate communities are dependent upon healthy seagrass beds, coral reefs, and mangroves. Thus, although anticipated effects on coral reef
69
Elkhorn coral (Acropora palmata) at Hawksnest reef on north side of St. John, U.S. Virgin Islands.
South Florida / Caribbean Network Vital Signs Monitoring Plan
Blue tangs U.S. Virgin Islands.
Lost trap lodged in coral reef at Biscayne National Park.
antillarum) have resulted in algal overgrowth that inhibits coral recruitment. Coral communities are so sensitive to water quality degradation, they have been proposed as a water quality indicator by the EPA. There is growing concern over apparent declines in coral cover (NOAA 2001), declines in the main reef-building corals, and over the apparent lack of successful re-growth or recruitment of the main reef-building corals. Staghorn coral (Acropora cervicornis) and Elkhorn coral (A. palmata) cover have been reduced to such a degree that, coupled with the lack of evidence of successful reproduction, these species have been listed as threatened under the Endangered Species Act. Black coral (Antipathes spp.) have been further hit by over-harvesting for jewelry and are now also considered rare. With increasing urban development and tourism coupled with global climate change and intense fishing pressures, these problems are expected to only get worse.
Coral reef communities are already under severe stress Caribbean-wide. Outbreaks of coral disease, increased coral bleaching due to rising ocean temperatures, nutrient enrichment and sedimentation problems in VIIS, contaminant problems, altered food webs, boat groundings, anchor damage, and visitor disturbance (kicking, touching reef by divers) are all taking heavy tolls on the coral reefs. Lost traps and lines and storm debris abrade reefs causing even further damage. Losses of live coral cover are rarely, if ever, “recovered,” with that lost substrate being colonized by algae for decades. Nutrient enrichment coupled with the loss of herbivorous fish and the herbivorous long-spined sea urchin (Diadema
The simplified food web model given in Figure 2-L also applies to the Coastal Shelf and Deep Oceanic Zone. Marine fish and exploited invertebrate communities are under considerable pressure due to overfishing and damaging fishing methods, contaminants and changes in mangroves, seagrass, and coral reefs (including habitat loss). The largest changes have been a loss or severe reduction in the large top predators in the system and reductions in the numbers and size of mid-level predators, herbivores and some crustaceans such as lobsters. Recently, introduced species such as the lionfish (Pterois spp.) have become more of a concern. Contaminant concerns are similar to those discussed in the Florida and Biscayne Bays zone. Buck Island Reef National Monument has been established as a no-fishing zone and a section of Dry Tortugas National Park has a Research Natural Area (RNA) zoned and implemented in the current General Management Plan. While controversial, the concept is that the creation of no-take sanctuaries will allow coral reef and
70
Chapter 2: Conceptual Models
The vital signs that relate to the Coastal Shelf and Deep Oceanic Zone conceptual model include: Air Quality - Deposition Benthic Communities Extent & Distribution Contaminants Estuarine Salinity Patterns Focal Fish Species Invasive/Exotic Animals Land Use Change Marine Benthic Communities Marine Exploited Invertebrates Marine Fish Communities Marine Infaunal Community Marine Invertebrates-Rare, Threatened, Endangered (RTE) Nutrient Dynamics Phytoplankton (Marine) Protected Marine mammals Sawfish Sea Turtles Surface Water Hydrology Visitor Use Water Chemistry
seagrass beds to recover along with a balanced marine food web. Healthy fish communities in no-take zones are expected to increase to the point that there will be spillover effects around the zones, increasing the size, and number of fish and crustaceans caught by commercial and recreational fisheries outside the no-take zones. However, at present the zones are still in early phases and need long-term monitoring. Current major management issues in the Coastal Shelf and Deep Oceanic Ecological Zone include reduction of sediment inputs, reductions in or mitigation of contaminants and debris, management of fishing, boating, and recreation, including “no-take” zones, and protection and management of rare plants and animals. Control of invasive species could become a larger concern in the future.
71
Left: Undersized lobsters illegally taken at BISC (Photo from BISC staff).
Below: Longspined sea urchins are important herbivores on reefs that appear to be recovering from a Caribbean-wide dieoff.
Anthropogenic Stressors
Physical Drivers & Attributes
72
Sediment influx
Sea level rise
Major weather events
Disease
Marine benthic communities (e.g., seagrass density, composition)
Benthic Communities Extent & distribution (e.g., seagrass, coral open sand, algal plain, etc..)
Phytoplankton (abundance & composition; harmful algal blooms)
Invasive/exotic plants
Primary Producer Dynamics, e.g., structure, composition, abundance, diversity, richness, disease, predation, competition, biological transport, demographic rates, sediment producers, eroders, recruitment
Marine Groundwater
Introduce invasive species
Harvest in & outside zone Boat groundings, anchor damage, prop. damage, damaging fishing methods
Nonconsumptive human disturbance (e.g., diving , noise)
Boat collisions with wildlife
Trash, debris, flotsam, jetsam, lost fishing gear
↑ Visitor Use/ Tourism: water-based activities, recreation, boating, fishing, commercial shipping, cruise ships
Species at risk (T&E, rare): Acropora spp., sea turtles, protected marine mammals
Invasive/exotic animals
Consumer Dynamics e.g., structure, composition, abundance, diversity, richness, disease, predation, competition, biological transport, demographic rates, sediment producers, eroders, recruitment, abnormalities, contaminant loading Colonial nesting Marine fish communities Marine Exploited birds (structure, composition, invertebrates, abundance) other invertebrates Focal fish species (e.g., goliath Marine benthic communities Marine infaunal grouper, sharks) (e.g. Coral communities) communities
Air quality Freshwater flux Transport to/ (deposition (Surface from other ) water marine areas hydrology & groundwater) WQ-Chemistry WQWQ – Nutrient (Salinity gradient, Temperature Dynamics, DO, pH, turbidity) range, extremes Contaminants
Rainfall
Contaminants- Acute & Chronic (e.g., Hg, oil, septic systems, catastrophic spills, accidents, EPOCs)
Currents, waves, tides, winds
Climate cycles
Light penetration
Underlying geology
Earthquakes (USVI)
Water diversions
Ocean floor bathymetry, reef structure & location, distribution of soft- & hard-bottom sediments, bedrock permeability; Coastal Geomorphology
Sediments from organisms
Influence of tidal wetlands
Construction & road runoff
Land Use Change: Rapid coastal development / habitat conversion
Figure 2-M. Coastal Shelf / Deep Oceanic Ecological Zone conceptual model diagram. Solid and dotted lines show assumed effects of anthropogenic stressors, natural system drivers, and biological attributes upon each other. Boxes with red print directly relate to a selected Vital Sign. (Use of dotted lines is to clarify and does not indicate lesser importance).
Biological Drivers & Attributes
Global climate change (incl. UV penetration)
South Florida / Caribbean Network Vital Signs Monitoring Plan
Chapter 3: Vital Signs 3.1
network Conceptual Ecological Models (CEM) (See Chapter 2 and Appendix J). These models helped focus discussion and facilitate the identification of potential Vital Signs indicators at three Indicator Identification Workshops held from January through March of 2006: 1) Bays and Marine Ecosystems of South Florida; 2) Wetlands and Uplands of South Florida; and 3) United States Virgin Islands (USVI) Ecosystems. The workshop participants reviewed the conceptual models, identified important indicators and developed indicator worksheets. In the USVI workshop, participants reviewed indicator worksheets developed in the two South Florida workshops, expanded those indicators and added new ones to ensure coverage of USVI ecosystems. The workshop and ranking process is covered in detail in Appendix O. The seventy workshop participants represented NPS staff, U.S. Geological Survey, National Oceanic and Atmospheric Administration, South Florida Water Management District, USVI-Department of Planning and Natural Resources, local universities, NGOs, and other local experts (full participant list in Appendix O.2).
Introduction
“Vital Signs” are a “subset of physical, chemical, and biological elements and processes of park ecosystems that are selected to represent the overall health or condition of park resources, known or hypothesized effects of stressors, or elements that have important human values. The elements and processes that are monitored are a subset of the total suite of natural resources that park managers are directed to preserve "unimpaired for future generations," including water, air, geological resources, plants and animals, and the various ecological, biological, and physical processes that act on those resources.” (http://science.nature.nps.gov/im/monito r/glossary.cfm) This chapter describes the 44 vital signs identified for the SFCN, the process used to identify them, their relationships in the conceptual models, which ones will be implemented with current funding, the subset of core vital signs that SFCN will be focusing most of its energy on, and the relationship to existing programs. 3.2
Process for Choosing Vital Signs
The network developed its prioritized list of vital signs through initial scoping of management issues in the parks, development of conceptual models, holding indicator identification workshops, conducting online web ranking, and meetings with the Board of Directors (BOD) and Science and Technical Committee (STC) (see Table 3A). The SFCN has been gathering information about natural resource management issues since 2001 through meetings, surveys, and data mining, which were used in the development of the
73
Local experts identify indicators at South Florida Wetlands and Uplands indicator identification workshop.
South Florida / Caribbean Network Vital Signs Monitoring Plan
Table 3-A. Summary of steps taken in identifying and prioritizing SFCN Vital Signs Time
Event Management issues survey
Steps taken Initial identification and ranking of park management issues and monitoring needs
January- August 2005
Conceptual model development
SFCN staff drafted conceptual models to assist Vital Signs identification
Appendix J
Sept. - Dec. 2005
Meetings with park staff
Presentations to park staff on vital signs process and lists of existing monitoring programs compiled
Appendix H
January - March 2006
Vital Signs Indicator Identification workshops
In three workshops, 72 workshop participants reviewed network conceptual models, identified 69 potential indicators, and filled out indicator worksheets
Appendix O.1, O.2, O.6
April 2006
Vital Signs Web-based Ranking Process
The indicator worksheets were loaded into an online database. 102 area scientists, park and agency staff ranked the indicators for “Ecological Significance” and "Feasibility"
Appendix O.3, O.4
May 2006
Vital Signs Ranking Meeting
SFCN Board of Directors and Science & Technical Committee reviewed the ranked list of indicators, reduced the number to 62 indicators, made minor modifications, and accepted the list.
Appendix O.5
June - Sept. 2006
Vital sign consolidation
SFCN staff consolidated the 62 indicators into 41 vital signs and assigned funding categories
Appendix O.6
October 2006
Science & Technical Committee Meeting
Review of revisions to vital sign list and funding assignments
January – August 2007
Vital Sign Strategies & Protocol Development Summaries
SFCN staff draft vital sign strategies and protocol development summaries, assess funding/staff requirements & revise vital sign funding categories
Chapter 5, Appendix P, Q
Review & Finalize List
SFCN Vital Signs Plan reviewed by Science & Technical Committee, External Reviewers, and WASO. New vital signs added: Air Quality-Deposition; Air Quality-Mercury; Water Chemistry
Table 3.4-A
2001-2003
Sept. 2007 – April 2008
SFCN Vital Signs Ranking Meeting participants
74
Product Appendix G
Chapter 3: Vital Signs
• •
69 indicator worksheets were uploaded into the SFCN ranking database and then ranked via the web for ecological significance and feasibility using neutral ranking criteria by 102 workshop attendees, park staff, and other interested members of the scientific community (see Appendix O.3).
•
•
During May 9-10, 2006 the SFCN Board of Directors and the Science and Technical Committee discussed the rankings, asked for some indicators to be consolidated, made some minor modifications below the top 20, and agreed upon the list. The group also agreed that monitoring contaminants was very important; but, was cost prohibitive to take on at the current level of network funding. Each park then prioritized the top half of the indicators with regards to importance to management (see Appendix O.5).
•
It should be noted that NPS I&M funding cannot be used to replace existing monitoring program funding by other entities. The vital signs were categorized by park as (+) Category 1: Vitals signs for which the network will develop protocols and implement monitoring using funding from the vital signs and water quality monitoring programs. (◊) Category 2: Vital signs that are being monitored by a network park, another NPS program, or by another federal or state agency using other funding. The network will collaborate with these other monitoring efforts. In some cases SFCN staff may participate in monitoring and/or analysis but commitment is $10K or less of staff time and resources per year. (○) Category 3: Vital signs which cannot currently be implemented because of limited staff and funding. (-) Vital sign either does not apply to the park or is of minimal importance to park management.
The revised list of 62 indicators was, in general, more detailed than vital signs identified for other Inventory and Monitoring Program networks. As advised by the Washington program office, the SFCN staff then further consolidated the indicators, added two Air Quality vital signs and a Water Chemistry vital sign for a total of 44 vital signs, and placed them in the National Inventory and Monitoring Program framework (Table 3-B). The original indicator details (see Appendix O.6) and rankings were retained and used in the development of the final monitoring program. 3.3
Indicator rankings Opportunities to collaborate (e.g., CERP, park monitoring, NOAA) Opportunities where co-location or other techniques can reduce costs Suites of indicators that when monitored together synergistically add value by describing system condition more completely, even though some individually may have ranked lower Low-cost indicators which could be accomplished with little additional funding despite ranking slightly lower than more expensive indicators
Vital Signs for the South Florida / Caribbean Network
SFCN’s 44 vital signs are shown in Table 3.3-A in the national framework by funding category and with suggested measures. Funding constraints will unfortunately allow SFCN to monitor only some of the vital signs. The criteria used to select those vital signs that SFCN will implement during the next 35 years included:
A revised rank for each vital sign was created by assigning each vital sign the rank of the highest ranking workshop
75
South Florida / Caribbean Network Vital Signs Monitoring Plan
indicator it contained and then collapsing the list. During the subsequent planning however, the original ranks and indicator worksheet details for the multiple indicators that compose each vital sign were kept in mind.
For those who may be confused looking for a single “Water Quality” vital sign, multiple vital signs were included: “Estuarine salinity patterns,” “Nutrient Dynamics,” “Water Chemistry”, and “Contaminants.” A weather and climate vital sign was not identified in the workshops and is not included; however rainfall will be tracked as part of the “Surface water hydrology” vital sign.
Some adjustments were made to the list to better coordinate with the National I&M program. The workshops identified generalized vegetation ecotones and community structure vital signs. However to fit with the National I&M program framework, these general vegetation vital signs were split into three – “Mangrove-Marsh Ecotone,” “Forest Ecotones and Community Structure,” and “Wetland Ecotones and Community Structure” – and assigned the same priority rank. Three additional vital signs were added after the vital signs ranking process to coordinate better with the NPS-Air Resources and NPS Water Resources Divisions: “Air Quality- Deposition”, “Air QualityMercury”, and “Water Chemistry.”
3.4
Links of Vital Signs to Conceptual Models
Use of the conceptual models in Appendix J coupled with the high level of experience the workshop participants had with indicator selection relating to the Comprehensive Everglades Restoration Plan, the U.S. Virgin Islands Prototype, and other indicator identification efforts, led to selection of vital signs with strong linkages to the key issues and resources discussed in Chapter 2 and in greater depth in the Appendix J (see Table 3-C and Appendix J).
Hermit crab race used as ranking tie breaker
76
Level 2 Air Quality
77
Biological Integrity
VIIS
BUIS
BISC
BICY
-
○
-
-
◊ ○ ◊
◊
◊ ◊ ○ ◊
◊
◊ ○ ○
-
◊
-
◊ ○ ○ ◊ ○ ○
-
+ ◊ ◊ ◊ + ◊ ◊
+ + + + + ◊ ◊
-
+ -
○ ○ ○ ○ ○ ○ ○
◊ ◊
◊
◊
◊
-
+ ◊ ◊ + ◊
-
◊
◊
-
+ + - + + +
-
◊
○
-
○ ○ ○ ○ ◊ ○ ○
○ ○ ○ ○ ◊ ○ ◊
DRTO
Funding Category EVER
+ Vitals signs for which the network will develop protocols and implement monitoring using funding from the vital signs or water quality monitoring programs. ◊ Vital signs that are being monitored by a network park, another NPS program, or by another federal or state agency using other funding. The network will collaborate with these other efforts. ○ Vital signs which cannot currently be implemented because of limited staff and funding - Vital sign either does not apply to the park or is of minimal importance to park management [] indicates priority rank. 1 is highest.
Invasive/Exotic Animals Invasive/Exotic Animals Invasive species present, distribution, vegetation types [12] invaded, new species detected along common invasion points (e.g. canals)
Invasive Species
Water
Wetland substrate [35] Extent and distribution of substrate type (marl vs. peat), sediment elevation changes in cypress strands/domes Surface Water Water stage, flow, timing, and duration, discharge of Hydrology [3] freshwater to specific estuaries, rainfall Estuarine salinity Conductivity converted to practical salinity units, pH, DO, patterns [9] temperature in the marine water bodies (coastal embankments, central bay, "open" bay) Water Chemistry Temperature, DO, pH, Conductivity, organic carbon Nutrient Dynamics Nutrient Dynamics [4] Flux measurements of nutrients at specific locations, N, P, DO, Chl a, and other currently collected parameters. Toxics Contaminants [19] Concentrations in water column, organisms, and sediments: Hg (Total/Methyl); Metals, Hydrocarbons, PAHs, Pesticide/Herbicide/Insecticide, PCB's, EPOCs (Pharms, Caffeine, Estrogen/hormone related), non-regulated contaminants (vessel anti-fouling paint). Aquatic Macroinverte- Periphyton (Freshwater) Community composition & structure, organic/inorganic brates and Algae [17] (calcite) content, nutrient content Phytoplankton Location, size, duration, and type of algal bloom events (Marine)[34] Invasive/Exotic Plants Invasive/Exotic Plants Invasive species present, aerial extent, distribution, new [5] exotic species detected at common invasion points categorized by invasive potential, vegetation types invaded
Mercury deposition Soil elevation change in mangroves & salt ponds, location & extent of mud banks, buttonwood embankment and berms
Network Vital Sign Measures [rank] Air Quality-Deposition Wet/dry deposition of anions, cations
Air Contaminants Air Quality-Mercury Coastal/ Coastal Oceanographic Geomorphology [27] Features and Processes
Level 3 Wet & Dry Deposition
Stream/River Channel Characteristics Hydrology Surface Water Dynamics Water Quality Water Chemistry
Geology & GeomorSoils phology
Level 1 Air and Climate
National I & M Program Framework
SARI
Table 3-B. SFCN Vital Signs and measures in national framework by level of funding.
Chapter 3: Vital Signs
78
Network Vital Sign Marine Benthic Communities [1]
Measures Percent cover of major taxonomic groups (coral, algae, gorgonians, sponge), coral species diversity,community structure, rugosity, recruitment, disease mortality, algal community structure, episodic assaults (bleaching); Seagrass and other SAV community composition, cover and habitat quality of seagrass and other SAV habitat Community composition and physical structure (e.g. canopy height, vegetative cover of each plant species, canopy cover in each stratum (canopy, herb layer, shrub layer, etc)), shifts in community boundaries, soil depth, litter depth
BICY
◊
-
-
○ ○ ○ ○ ○ ○ ○ - ○ ○ ○ ○ ○ ○ Population abundance, distribution To be determined
-
○
-
○
○ ○ ○ ○ ○ ○
+ ○ -
-
Species composition, abundance, distribution, species richness/ diversity, in conjunction with water and sediment quality monitoring Community composition, abundance (density,relative abundance), MBI
Marine Infaunal Community [36]
+ + + + + +
+ + + + + + +
-
Lobster (Spatial/temporal distribution, abundance/density, size structure), Conch (spatial distribution, density, size structure, proportion immature), regional commercial harvest (Lobster, Conch, Crabs, Shrimp, Stone Crab, Blue Crab, Oysters, Sponges)
Community composition & structure (e.g. canopy height, vegetative cover by species, canopy cover in each stratum (canopy, herb layer, shrub layer)), shifts in community boundaries (e.g. hammock/pine), soil depth, litter depth
-
Marine Exploited Invertebrates [10]
Forest Ecotones and Community Structure [14,15,16]
Aquatic invertebrates in wet prairies & marshes[32] Terrestrial Invertebrates Butterflies [40] Island Insects [41]
Freshwater Invertebrates
Marine Invertebrates
Forest/Woodland Communities
◊
+ + ○ + + + +
+ + + ◊ + +
BUIS
-
VIIS
BISC
Wetland Communities Wetland Ecotones and Ridge and slough patterning and depth amplitude, slough to Community Structure prairie plant composition gradients, number and elevation ◊ [14,15,16] change in tree islands, wet prairie-forest ecotones change
Intertidal Communities Mangrove-Marsh Ecotone [14,15,16]
Level 2 Level 3 Focal Species Marine Communities or Communities
DRTO
Funding Category EVER
+ Vitals signs for which the network will develop protocols and implement monitoring using funding from the vital signs or water quality monitoring programs. ◊ Vital signs that are being monitored by a network park, another NPS program, or by another federal or state agency using other funding. The network will collaborate with these other efforts. ○ Vital signs which cannot currently be implemented because of limited staff and funding - Vital sign either does not apply to the park or is of minimal importance to park management [] indicates priority rank. 1 is highest.
Level 1 Biological Integrity (cont.)
National I & M Program Framework
SARI
Table 3-B. SFCN Vital Signs and measures in national framework by level of funding (cont.).
South Florida / Caribbean Network Vital Signs Monitoring Plan
79
At-risk Biota
Network Vital Sign Marine Fish Communities [2]
T&E Species and Communities
Mammals
Birds
American crocodile [21]
Marine InvertebratesRare Threatened, Endangered (RTE) [6] Sea Turtles [20]
Colonial Nesting Birds [8] Landbirds [24] Bats-USVI [39]
Florida Box Turtle [38]
BICY
Nest counts by species, distribution of nests, nest crawl outcome (nest, no nest), egg counts/nest, nesting outcome, hatching success Animals/ shoreline km, nests/region, size distribution, body condition, annual survival, increase in body length
Abundance, distribution, community composition Roost locations, roost population counts, relative activity levels Species dependent (Acropora, Diadema, Antipathes)
Location, size of colonies by species, fledging success
Population size,structure, proportion of habitat occupied.
BUIS
-
-
+ ○ ○ -
-
-
◊
-
○
◊
+ ◊ ◊ ◊ ◊ ◊
- ○ ○ ○ - -
+ ○ +
◊
◊
◊
○
-
-
○ ○
◊
-
◊
-
◊
◊
-
-
◊ ○ ◊
+ + + ○ + +
-
○ ◊
-
-
-
○ ○ ○ ○ ○ ○ ○
◊
-
-
◊
-
◊
-
◊
+ -
○
VIIS
+ + + ◊ + +
BISC
○ ◊
Measures Fish community taxonomic composition, richness/diversity/eveness, taxonomic dominance, trophic classification, index of trophic complexity, targeted species (Grouper, Snapper, (parrotfish, surgeonfish in USVI), baitfish) ○ spatial/temporal distribution, abundance/density, size structure, recruitment, biomass, fishing pressure, spawning aggregation characteristics
Focal Fish Species [30] Goliath Grouper (Red Hind in USVI), Sharks, Spotted Sea trout, Snook – relative abundance/density, occupancy, spatial/ temporal distribution, density, size structure, catch per unit effort Fishes (freshwater) Freshwater fish and Community composition, abundance (density and relative large macroabundance), size structure, invasive species present invertebrates [18] Amphibians & Reptiles American Alligator [22] Animals/km, sex ratio, size distribution, body condition index, alligators per hole, nests/km2 Amphibians [25] Proportion of area occupied, distribution, community composition, population structure, total mercury content Reptiles-USVI [37] Population size,structure, proportion of habitat occupied.
Level 2 Level 3 Focal Species Fishes (marine) or Communities (cont.)
DRTO
Funding Category EVER
+ Vitals signs for which the network will develop protocols and implement monitoring using funding from the vital signs or water quality monitoring programs. ◊ Vital signs that are being monitored by a network park, another NPS program, or by another federal or state agency using other funding. The network will collaborate with these other efforts. ○ Vital signs which cannot currently be implemented because of limited staff and funding - Vital sign either does not apply to the park or is of minimal importance to park management [] indicates priority rank. 1 is highest.
Level 1 Biological Integrity (cont.)
National I & M Program Framework
SARI
Table 3-B. SFCN Vital Signs and measures in national framework by level of funding (cont.).
Chapter 3: Vital Signs
Level 2 At-risk Biota (cont.)
80
Fire & Fuel Dynamics Landscape Dynamics
Land Cover and Use
Fire & Fuel Dynamics
Visitor Use
Level 3 T&E Species and Communities (cont.)
Fire Return Interval Departure [29] Vegetation Communities Extent & Distribution [7] Benthic Communities Extent & Distribution [23] Land Use Change [11]
Visitor Use [13]
Sawfish [26]
Network Vital Sign Protected Marine mammals [28] Imperiled & Rare Plants [31] Florida panther [33]
BICY
-
◊
◊
-
-
◊
-
-
◊
-
◊
◊
◊
○ ◊
-
-
◊
-
-
-
◊
-
-
+ + -
Land use change, permitting/zoning changes, demographics within 1 mile of USVI parks, 75 miles of S. Florida parks
-
+ + +
+ + + + + + -
+ + + + ◊ + +
◊
◊
-
◊
○ ○ ○ ○ ○ ○ ○
BISC
◊ ○ ○ ◊ ○ ○
VIIS
◊
BUIS
Extent and distribution of benthic community types using remote sensing.
Fire location, size, perimeter, dates, ignition source (lightning, human), time since last burn Extent, distribution, shape, orientation of vegetation community types using remote sensing
Measures Distribution, abundance, size, condition/disease (manatees, dolphins) Targeted rare plant species distribution,population sizes, mortality, recruitment, extent of habitat. Population abundance, distribution, mortality, cub survivorship Adult distribution & relative abundance, distribution of nurseries, recruitment, movement patterns Distribution and abundance of visitors including: activities, demographics, person days, spatial distribution/ density, numbers of people/cars/boats - both commercial and private
DRTO
Funding Category EVER
+ Vitals signs for which the network will develop protocols and implement monitoring using funding from the vital signs or water quality monitoring programs. ◊ Vital signs that are being monitored by a network park, another NPS program, or by another federal or state agency using other funding. The network will collaborate with these other efforts. ○ Vital signs which cannot currently be implemented because of limited staff and funding - Vital sign either does not apply to the park or is of minimal importance to park management [] indicates priority rank. 1 is highest.
Landscapes (Ecosystem Pattern and Processes)
Human use Visitor and Recreation Use
Level 1 Biological Integrity (cont.)
National I & M Program Framework
SARI
Table 3-B. SFCN Vital Signs and measures in national framework by level of funding (cont.).
South Florida / Caribbean Network Vital Signs Monitoring Plan
81
Butterflies Island Insects
Aquatic Invertebrates in Wet Prairies & Marshes
National I&M Framework Level 1 SFCN Vital Sign Air and Air Quality-Deposition Climate Air Quality-Mercury Geology & Coastal Geomorphology Soils Wetland Substrate Water Surface Water Hydrology Estuarine Salinity Patterns Water Chemistry Nutrient Dynamics Contaminants Periphyton (Freshwater) Phytoplankton (Marine) Biological Invasive/Exotic Plants Integrity Invasive/Exotic Animals Marine Benthic Communities Mangrove-Marsh Ecotone Wetland Ecotones and Community Structure Forest Ecotones and Community Structure Marine Exploited Invertebrates Marine Infaunal Community
Valued Resources and/or Services D
D D D D D R
R R
R R
R
R R R R R
R
R
R
Currents, transport & dispersal R R
R
R
R R R
R
Coastal geomorphology & sea level rise R
R
D
Habitat conversion outside parks R R
R R
R R
R
Freshwater & estuarine hydrology and human alterations R
R R R R R
R
R D R R R R R
R
R R
R
R
R R R R
R R R
R D
R
R R
R
Fire & altered fire regimes Water Quality- Nutrient enrichment Water Quality - Sedimentation R
Water Quality - Contaminants R
R R
R
D
Air quality R R
R
R
D D
Invasive fauna, flora and disease R
R
D D R R R R
D
R
Harvest & harvest methods Human disturbance (e.g., visitor use, boat scars, trash) R R R R
R R
●
●
● ●
● ● ●
●
●
● ●
● ● ● ●
● ●
● ●
Wet prairies and marshes ● ●
Forested Wetlands and Uplands ● ●
Island Interior ● ●
●
● ●
● ● ●
●
● ● ●
Coastal Wetlands ●
● ● ● ● ● ● ● ● ● ● ● ● ● ● ●
● ● ●
● ●
● ● ●
●
● ● ● ● ●
● ● ●
Florida Bay & Biscayne Bay
Conceptual Models
● ●
● ●
●
● ● ● ● ●
●
Coastal Shelf & Deep Oceanic
Key issues (Physical drivers and stressors) from Chapter 2
Major weather events
D
Climate & global climate change
Table 3-C. Linkages of Vital Signs to valued resources and key issues (physical drivers and stressors) from conceptual models.
Chapter 3: Vital Signs
Valued Resources and/or Services
Major weather events
82
D
D
R
R
R R
D=Vital Sign is a direct measure of a valued resource or key issue (stressor and/or driver) R=Vital Sign strongly responds or otherwise relates to the key issue but is not a direct measure
Human use Landscapes (Ecosystem Pattern and Vegetation Communities Extent & Distribution Processes) Benthic Communities Extent & Distribution Land Use Change
R
R
R
R
R
R D
R R
R R R
R R R R R R R
R R
R
R
R
R R R
R
R R
R
Coastal geomorphology & sea level rise
American Alligator Amphibians Reptiles-USVI Florida Box Turtle Colonial Nesting Birds Landbirds Bats-USVI Marine Invertebrates-RTE Sea Turtles American crocodile Protected Marine mammals Imperiled & Rare Plants Florida panther Sawfish Visitor Use Fire Return Interval Departure D D D D D D D D D D D D D D
Currents, transport & dispersal R R
Habitat conversion outside parks R
D D
R
D
R
R
R
R
R
R
R
R
Fire & altered fire regimes Water Quality- Nutrient enrichment Water Quality - Sedimentation R
Water Quality - Contaminants R R
R R R R R R R
R R
R
R R
Air quality R
R
Invasive fauna, flora and disease R R R
R R
R R
R R R
R
R
R
R
R R R R R R R R R R R R R R D
Harvest & harvest methods Human disturbance (e.g., visitor use, boat scars, trash) D D
● ● ●
● ● ●
●
●
● ●
● ●
● ●
● ●
● ●
● ●
Wet prairies and marshes ●
Forested Wetlands and Uplands ●
Island Interior ●
●
●
●
● ● ●
● ●
●
● ●
●
●
● ●
● ● ●
● ● ●
● ●
● ●
● ● ●
●
● ●
Coastal Wetlands ● ●
Florida & Biscayne Bays
Conceptual Models
● ●
● ●
●
● ●
● ●
Coastal Shelf & Deep Oceanic
Key issues (Physical drivers and stressors) from Chapter 2 Freshwater & estuarine hydrology and human alterations
Freshwater fish and large macro-invertebrates
National I&M Framework Level 1 SFCN Vital Sign Biological Marine Fish Communities Integrity Focal Fish Species
Climate & global climate change
Table 3-C. Linkages of Vital Signs to valued resources and key issues (physical drivers and stressors) from Ecological Zone Conceptual
South Florida / Caribbean Network Vital Signs Monitoring Plan
Chapter 3: Vital Signs
3.5
network. For example, water quality monitoring is an important covariate and will be a critical dataset to evaluate when examining trends in biological indicators. Thus, coordinating with existing water quality sampling programs in South Florida and the USVI will be essential (see Appendix F.2). Most of the Threatened and Endangered species identified as vital signs are already being monitored by the parks or USFWS.
SFCN Category 1 Vital Signs and Relationship between the Network, Park-Based, and External Agency Monitoring Activities
The justifications and strategy of approach for each vital sign are given in Appendix P. Table 3-D shows SFCN contributing towards data collection for 17 of the 34 vital signs for which some degree of reporting will occur (10 are deferred due to insufficient funds).
Agencies implementing the Comprehensive Everglades Restoration Plan (CERP), i.e. SFWMD & ACOE, spent about $8.7 million in monitoring and research in the CERP Greater Everglades and Southern Estuaries modules in 2007. The Restoration Coordination and Verification (RECOVER) arm of CERP has three primary responsibilities: 1) evaluate and assess Plan performance; 2) refine and improve the plan during the implementation period, and 3) ensure that a system-wide perspective is maintained throughout the restoration program. RECOVER’s Assessment Team (AT) is developing the Monitoring and Assessment Plan (MAP). A number of the participants in the SFCN indicator
“Vegetation Communities Extent and Distribution” and “Benthic Communities Extent and Distribution” were not included in the list because the current SFCN mapping projects are being conducted with NPS I&M Program funding as a one-time effort. Future funding for mapping is unclear although it is hoped additional funding will become available in the future. Thirty-three of the vital signs are already being monitored in some or all of the parks by park staff, other government agencies, and NGOs. The SFCN anticipates working closely with these ongoing monitoring activities across the
Table 3-D. SFCN Category 1 Vital Signs. Group SFCN Category 1 Vital Signs Marine
Inter-tidal and above
Marine Benthic Communities * Marine Fish Communities * Marine Exploited Invertebrates * Marine Invertebrates – Rare, threatened, endangered (RTE) Colonial Nesting Birds * Land-use Change * Wetland Ecotones and Community Structure * Forest Ecotones and Community Structure * Mangrove-Marsh Ecotone * Freshwater fish and large macro-invertebrates * Amphibians * Coastal Geomorphology * Invasive/Exotic Plants Invasive/Exotic Animals Surface Water Hydrology (weather stations) Periphyton Aquatic invertebrates in wet prairies & marshes
“*” = requiring >0.3 FTE of SFCN Staff time
83
South Florida / Caribbean Network Vital Signs Monitoring Plan
identification workshops have also been heavily involved in CERP and the development of the MAP. Eighteen of the SFCN Vital Signs overlap either in part or entirely with the CERP MAP, and SFCN staff members attend Assessment Team meetings to ensure coordination between the two programs. The CERP footprint doesn’t fully cover all South Florida park units, and in some cases the SFCN will work to augment monitoring, where applicable to ensure park-wide coverage.
Because so many of the vital signs are already being monitored either in their entirety or in part by other groups, SFCN has identified four basic roles with regards to the vital signs which are summarized in Table 3-E and described below: • SFCN implements monitoring: SFCN either conducts or pays for field data collection and analysis, and will need to adopt an existing protocol or develop a new protocol • SFCN gathers data from other groups & analyzes: SFCN expects to conduct additional data analyses on data collected by an existing program to report on trends within park boundaries (i.e. the other group is reporting regional trends), analyze multi-park trends, correlate to other vital signs, answer additional questions, and/or otherwise assist park staff • SFCN summarizes reports from other groups, provides web links: an existing program is conducting the data collection, analysis and reporting. SFCN will gather these reports for posting on the SFCN internet/intranet webpage, review the reports and provide brief summaries on the web page and annual report • Deferred: monitoring is deferred due to insufficient funding/staff time
The marine ecosystems are monitored extensively by several groups within the National Oceanic and Atmospheric Administration (NOAA), including the Southeast Fisheries Science Center, the Biogeography Program, the National Coral Reef Institute at Nova Southeastern University, and others. The Florida Fish and Wildlife Conservation Commission’s Fish and Wildlife Research Institute, University of Miami-RSMAS and Florida International University all have monitoring programs. The SFCN has established a strong working relationship with all of these groups, and intends to develop even stronger partnerships in the future as protocols are developed, and data is shared among programs.
84
85
2
3
4
5
Surface Water Hydrology
Nutrient Dynamics
Invasive/Exotic Plants
1
Rank
Marine Fish Communities
Marine Benthic Communities
Network Vital Sign in Priority Rank Order
SARI Weather stations - VIIS, SARI, BUIS Hydrology - EVER, BICY Hydrology - BISC Hydrology - VIIS Hydrology - SARI - Adding crest gage BICY, BISC, DRTO, EVER VIIS BUIS, SARI SRF-Digital Sketch Mapping Corridors of Invasiveness Voluntary Reporting Program
BUIS, VIIS
BISC - Bay EVER - Florida Bay
BISC (Coastal Shelf), DRTO
Seagrass - Outer BISC, DRTO, BUIS, SARI, VIIS Seagrass - Florida Bay & Biscayne Bay
Component Coral - Index sites Coral - Extensive design 2-20m deep Coral - Deep Coral >20m deep Feasibility Assessment Coral - Temperature Monitoring
X (with EPMT)
X (with park staff)
? ? X (with park staff, NOAA) X X (with park staff)
X (with NOAA, FWRI)
X (with park staff?) ?
X
X
SFCN Conducts monitoring X X
X
X
X X
X X
X
? ?
X
?
SFCN gathers data from other groups & analyzes
X
X X
X
X
X
X
SFCN summarizes reports from other groups, provides web links
X
Deferred
Table 3-E. SFCN role for each Vital Sign component. Components are detailed in Chapter 4 and Appendix P. Grey rows indicate vital signs components for which a park or another agency is lead; for which outside funding would be required (mapping) or for which monitoring is deferred.
Chapter 3: Vital Signs
86
12 13
Invasive/Exotic Animals
Visitor Use 14, 15,16
11
Land-use Change
Wetland Ecotones & Community Structure
10
Marine Exploited Invertebrates
8
Colonial Nesting Birds
9
7
Vegetation Communities Extent & Distribution
Estuarine salinity patterns
6
Rank
Marine Invertebrates-Rare, Threatened, and Endangered
Network Vital Sign in Priority Rank Order
EVER BISC, BICY, supplement EVER
Pink shrimp Harvest data-Lobster, Shrimp, Crabs (Stone, blue, others), Sponges Oysters, Whelk Land-use change Permiting/zoning changes next 1-3 yrs Surveying other programs for new species Canals - EVER, BICY
Queen Conch
Spiny lobster
BISC- Colony monitoring DRTO - Colony monitoring BUIS, VIIS - Colony monitoring SARI - Colony monitoring
BISC - Colony monitoring, SRF flights
EVER - Colony monitoring, SRF flights
BISC, DRTO, BUIS, VIIS, SARI,BICY (western 1/3)
Diadema Black Coral Feasibility Assessment EVER, BICY (eastern 2/3)
Acropora species
Component
Table 3-E. SFCN role for each Vital Sign component (cont.).
X
X (with park staff)
X
X (with park staff) X (with park staff, NOAA)
?
SFCN helps with initial location of colonies X X (with park staff)
X (Funds from NPS Natl. Mapping Prgm)
X X
SFCN Conducts monitoring
X
X X
X
X ? X
X
X
SFCN Gathers data from other groups & analyzes
X
X
X
X
X
X
SFCN summarizes reports from other groups, links to web pages X Assist protocol development?
X
X
Deferred
South Florida / Caribbean Network Vital Signs Monitoring Plan
17 18
Periphyton (Freshwater)
Freshwater fish and large macro-invertebrates
87
29 30 31
Fire Return Interval Departure
Focal fish species
Imperiled & Rare Plants
33
32
28
Protected marine mammals
Aquatic invertebrates in wet prairies & marshes Florida panther
27
Coastal Geomorphology
BICY NW corner
Fl Bay - Mapping mud banks, berms
X
24 25 26
X
X X (Funds from NPS Natl. Mapping Prgm)
X (Funds from NPS Natl. Mapping Prgm)
23
Sediment Elevation Tables (SETs)
X
BICY NW corner EVER + NE BICY BICY NW corner EVER + NE BICY X
X
X
All parks
BISC, BICY, EVER, VIIS
Component
SFCN Conducts monitoring
Contaminants Sea Turtles American crocodile American Alligator Benthic Communities Extent & Distribution Landbirds Amphibians Sawfish
19 20 21 22
14, 15,16
Rank 14, 15,16
Mangrove-Marsh Ecotone
Network Vital Sign in Priority Rank Order Forest Ecotones & Community Structure
Table 3-E. SFCN role for each Vital Sign component (cont.).
X
X
X
X
SFCN Gathers data from other groups & analyzes
X
X
X
X X
X X X X X
X
X
X
SFCN summarizes reports from other groups, links to web pages
X
X
Deferred
Chapter 3: Vital Signs
35 36 37 38 39 40 41 ----
Water Chemistry
Rank 34
Wetland substrate Marine Infaunal Community Reptiles-USVI Florida Box Turtle Bats-USVI Butterflies Island Insects Air Quality-Deposition Air Quality-Mercury
Network Vital Sign in Priority Rank Order Phytoplankton (Marine)
88
BUIS, SARI
VIIS
BICY, BISC, DRTO, EVER
Component
Table 3-E. SFCN role for each Vital Sign component (cont.).
SFCN Conducts monitoring
X
X X X
SFCN Gathers data from other groups & analyzes
X X X
SFCN summarizes reports from other groups, links to web pages X
X
X X X X X X X
Deferred
South Florida / Caribbean Network Vital Signs Monitoring Plan
Chapter 4: Sampling Design 4.1
and limitations of repeated diving, plus limited knowledge of underwater habitats in SFCN parks. Some areas of BUIS are extremely deep, well below diveable depths. Consequently, practical considerations, such as accessibility, feasibility, knowledge, and cost, will limit design alternatives that can be realistically implemented in these parks. A design should also be flexible enough to allow continued sampling within a restricted range of high-priority areas or sites if funding drops to levels too low to support the full program.
Introduction
Designing scientifically sound ecological monitoring programs is an emerging field which is still in a process of learning and development. Some principles that SFCN is employing include: • Good clear monitoring questions/ objectives with a clearly defined target population and applicable to management decision-making • Based upon best available scientific information, both ecological and statistical design • Allows unbiased inference to the target population, across space and time • Sufficient precision and statistical power to answer monitoring questions in a manner timely and informative to management • Simple, robust and flexible through time • Cost-effective and logistically feasible • Leverages historical work, existing protocols and collaborates with existing programs, where doing so doesn’t otherwise conflict with the principles above.
The SFCN is composed of four small and widely separated parks (BUIS, DRTO, SARI, and VIIS) and three relatively large closely located parks (BICY, BISC, and EVER). A number of the parks within the SFCN (BICY, BISC, EVER, SARI, and VIIS) are surrounded by a radically altered matrix of rapid urbanization and habitat conversion. Additionally, the Comprehensive Everglades Restoration Plan (CERP), which affects some 18,000 2 mi , is a driving force in the water management of the three large parks (BICY, BISC, and EVER) of the network. Thus, a great deal of monitoring is currently underway (see Appendixes F & H). As thirty-three of the vital signs are already being monitored or partially monitored by the parks, other government agencies and NGOs, SFCN’s role in the sampling design of many of these programs is limited unless assistance is requested with power analysis and improving the rigor of such designs. In this chapter, we discuss basic concepts and terminology of sampling design, summarize the sampling designs for all vital signs components in a table, and describe in greater detail the sampling designs of SFCN’s core set of vital signs plus a few additional vital signs involving SFCN sampling design planning.
These principles involve tradeoffs – usually in costs and feasibility versus the rest. Because proper monitoring of natural resources is usually very expensive and time-consuming, the sampling designs should provide reliable information in a cost-efficient manner. Monitoring in the forests and wetland areas of EVER and portions of BICY and VIIS are particularly daunting because these parks contain large areas that are difficult to access and the wilderness area of EVER has limits on types of access, transportation, and tools used within the park. Monitoring the marine areas is challenged by the ever present dangers
89
South Florida / Caribbean Network Vital Signs Monitoring Plan
4.2
to record the elements through counts, observation, or other form of measurement. Frequently the definition of the target population and monitoring objectives are refined as sampling design development proceeds, such as the target population for amphibians in EVER may be restricted to “amphibian communities in buffered areas along roads, trails and other accessible areas within Everglades National Park” due to feasibility constraints.
Basic Concepts and Terminology
In this section we introduce terminology and provide the conceptual framework for our proposed sampling designs for monitoring vital signs in SFCN parks discussed later in this chapter. Much of the following is adapted from the Southwest Alaska Network Phase 3 report (Bennett et al. 2006). We begin by defining status as a measure of a current attribute, condition, or state, and trend as a measure of net change, which includes contributions from immigration or emigration as well as those occurring within the area of interest. Status applies to specific points in time, whereas trend pertains to measurements across multiple time periods. A sampling design used for monitoring vital signs dictates where, when, and how often to sample. We distinguish a sampling design which describes the distribution of sampling units in time and space from the sampling unit methodology, which describes how to best record information from sample locations.
Two common types of error common to surveys are bias and precision. Bias refers to a persistent error that is not due to random chance – for example, if a temperature recorder consistently records one degree lower than the actual temperature or if a portion of the bird nests counted are always hidden from view. The degree of spread or variance in estimates from repeated samples is referred to as precision. The precision can be improved through using better sampling unit methodologies that reduce variation due to instrumentation, different observers, and by using spatially balanced sampling designs.
One of the most important steps in developing a sampling design is clearly identifying monitoring questions/ objectives and the target population about which any sampling will be used to draw inferences. The sampling design should be optimized to answer the objectives. The target population or sampling frame is the collective population(s) of animals, plants, natural resources, or environmental attributes of interest within a specified geographic area. Note that this is a statistical population; it may or may not refer to a biological population, e.g., the target population may be amphibian communities within Everglades National Park while the true biological population will extend outside park boundaries. The target population is divided into sampling units. Sampling units are non-overlapping collections of elements or attributes which are measured such as individual animals or plants. Common examples of sampling units include plots, quadrats, point counts, transects, or individual nests. A sample is a subset of units chosen
There are two basic components of a sampling design for monitoring natural resources: membership and revisit designs. A membership design dictates how sampling units are chosen to become members of a panel, which includes how to spatially allocate sampling effort (McDonald 2003, as cited in Bennett et al. 2006). Sample selection methods used in membership designs can be placed in one of two categories: non-random and random sampling. Non-random sampling is a choice of units based on convenience, perceived representativeness, haphazard contact, or other subjective criteria – unfortunately statistical inference is limited to those sites actually sampled. Attempting to expand beyond these sites will nearly always result in selection bias, usually of an unknown magnitude. This bias could potentially be mitigated if the relationship between vital sign metrics in non-
90
Chapter 4: Sampling Design
randomly sampled units and unsampled units is reasonably approximated by a model (e.g., known habitat or environmental associations). In addition, bias will likely be reduced if a large proportion of the target population is (non-randomly) sampled, especially if sample locations are spatially balanced. However, neither of these scenarios can be assumed without validation, which is one reason why non-random sampling approaches have been criticized in the literature (e.g., see Anderson 2001, Morrison et al. 2001).
thereof, see Thompson 2002). The generalized random-tessellation stratified (GRTS) (Stevens and Olsen 2004) design is a recently proposed probability sampling method that is spatially balanced and increases program flexibility by allowing sampling units to be easily removed while still maintaining a balanced design in cases of decreased funding. Not all sampling units need to be selected with the same probability. For example, the target population may be partitioned into different homogeneous strata based upon geology, hydrology, access, or some other non-changing feature. Sampling can be portioned among these different strata to allow increased sampling in some and decreased sampling in others to reduce overall sampling variance or reduce sampling costs. This can allow decreased sampling in areas that are difficult to access or increased sampling in areas of higher variance where greater effort is needed.
However, in cases where only a few samples units (1-2) can be analyzed, using best judgment in their placement makes as much sense as a random selection. We will refer to them as index sites. Some of the vital signs are monitored with nonrandomly selected index sites chosen by best judgment. For example, SFCN will be placing one weather station each in BUIS and SARI and possibly DRTO. Since the variance in the parameters of interest (e.g., air temperature, rainfall, wind speed) across the island is of less interest than seasonal trends and extremes, these stations will be placed using best judgment in areas that meet the minimum standards for appropriate operation of the equipment and are easily accessible to park staff. Other examples of nonrandomly selected monitoring that have value are those which have been measuring long-term trends, even if the geographic scope of inference is limited. These include permanent water quality and water stage stations, alligator transect monitoring, sooty tern monitoring, and some long-term vegetation plots.
Some typical strata considerations that may be included in SFCN sampling designs include • Marine: o Hard-bottom versus soft-bottom habitat o Different types of hard-bottom habitat and/or coral reef communities o Accessibility: 20m depth • Intertidal & above: o Hydrology/elevation/topography o Coastal versus inland o Underlying geology (i.e. pine rocklands in EVER & BICY) o Accessibility (distance to roads & trails; “wilderness” designation)
However, the preferred membership design involves random or probability sampling which employs some form of randomized procedure to select units. Because of this, each potential sample has a known probability of selection and results can be statistically inferred to the larger target population. Common examples of probability sampling schemes include simple random, systematic, and stratified sampling (or some combination
A revisit design determines when and how often selected units are sampled (or visited) among sampling occasions and hence how to temporally allocate sampling effort (McDonald 2003; as cited in Bennett et al. 2006). For example, members of one panel may be sampled during every sampling occasion and
91
South Florida / Caribbean Network Vital Signs Monitoring Plan
members of another panel may be sampled every tenth sampling occasion. Sampling frequency will be dictated both by level of temporal variation in the vital sign measure and by logistical/funding constraints.
present is less than 100%. The probability of detecting an individual or species within a sampling unit, given it is present, is called the probability of detection or detectability. Organisms such as amphibians, fish, birds, rare plants, etc., may not always be detected by the observer even when present. This leads to an underestimation of abundance or occupancy, greater variance in results, and possibilities for misinterpretation of data when changes in detectability, for example, due to a change in observers or vegetation succession are misinterpreted as a trend. Methods such as proportion of area occupied (MacKenzie et al. 2002), double-observer (Nichols et al. 2000), dual-frame, capture-recapture (Amstrup et al. 2005) and distance sampling (Buckland et al. 2001) have been developed to account for this component of individual detectability and factor them into estimates (see also Williams et al. 2002, Thompson 2002). Accounting for detectability makes results less biased and more defensible by creating estimates of the true abundance or occupancy rather than relative abundance which is typical of many sampling programs. It also allows greater flexibility in changes in protocols through time as changes in detectability due to different methods and observers are now factored directly into the estimates. SFCN will work to promote sampling unit methodologies that incorporate methods that properly account for incomplete detectability whenever possible as well as incorporate them into the SFCN monitoring protocols.
An important consideration when choosing a revisit design is the tradeoffs between using permanent sampling units versus re-randomizing units versus some combination of the two. For communities with a high degree of spatial variance such as coral or vegetation, using permanent transects or plots can greatly reduce variance and consequently sample sizes. There is a tradeoff however, in that using permanent sampling units can reduce the future flexibility of sampling designs in the face of habitat succession or other changes. Thus, for mobile species such as fish, birds, and amphibians, the tradeoffs of using permanent plots versus rerandomizing each year must be considered. In order to achieve sufficient sample size within current staffing constraints, SFCN may distribute sampling across time by rotating sampling efforts through different panels or collections of sampling units during different years (see Figure 4A). We define a panel of sampling units to be those that are sampled together during the same sampling period (McDonald 2003; as cited in Bennett et al. 2006). For example, it may be feasible to sample only a fifth of selected vegetation plots during a given year so a different fifth is sampled each year over a 5-yr period, which would be a rotating panel design consisting of five panels. SFCN may choose to rotate sampling within all parks each year or may instead consider rotating sampling among parks, in which all sampling units are sampled in one or two parks in a given year, and then other parks in subsequent years.
SFCN will work to create scientifically defensible yet feasible and flexible sampling designs for the protocols for which it is responsible and for those other vital signs that it is asked to provide assistance. Well designed sampling programs make the subsequent steps of analysis and reporting much easier and readily explainable to management.
Another source of bias occurs when the detection of an animal or plant when
92
Chapter 4: Sampling Design
Sampling Occasions Panel
1
2
3
4
5
6
7
8
9
10
11
12
13
14
15
16
17
18
19
20
1
X
X
X
X
X
X
All sampling units revisited each year X X X X X X X X
X
X
X
X
X
X
1 2 3 4 5 6 7 8 9 10 : :
X
X X
X
One permanent panel while other sampling units are re-randomized each year X X X X X X X X X X X X X X X
X
X
1 2 3 4 5
X
1 2 3 4 5 6 7 8 9 10 11
X X
1 2 3 4 5 6
X
X X X X X X X X : : 5 year rotation X
X X
X X
X X
X
X
X
X X X X
X X
X X
X X
X
X X
X X
X
X X
One panel always sampled, others 10 year rotation X X X X X X X X X X X X X X X X X X X X
X
X
X
X
X
X X X X
Panels sampled twice, then again after 4 years (allows estimate of inter-annual variation) X X X X X X X X X X X X X X X X X X X X X X X X X X X X X X X X X X
Figure 4-A. Examples of different sampling panel designs distributing effort through space and time. A panel is a group of sampling units that are sampled together during the same sampling period.
93
X
X
X
South Florida / Caribbean Network Vital Signs Monitoring Plan
4.3
gathering similar data from the literature to provide estimates of temporal and spatial variability and detection probabilities (Elzinga et al. 2001, p.192, has compiled a list). Selecting welldesigned sampling unit methodologies that minimize sampling variation due to instrumentation and observer variation also contribute to lower sample sizes. Sometimes a complete shift in approach is necessary as in the case of monitoring amphibians where calculating proportion of area occupied is now considered a more cost-effective and less biased approach than estimating abundances.
Episodic monitoring
SFCN network parks are subject to a number of major disturbance events including hurricanes, coral bleaching, fire, and algal blooms. Increased sampling in the wake of such events allows an immediate understanding of the current status of park resources, can clarify the role those events had in trends versus other long-term factors, and can sometimes resolve critical uncertainties. To allow for this increased effort, sampling of other vital signs may be delayed or even postponed until the following year. Vital signs components that could receive increased monitoring by SFCN staff following a hurricane include coral monitoring, sediment elevation tables, and vegetation monitoring. SFCN is not undertaking water quality monitoring or endangered species monitoring, but may provide assistance to other groups in the wake of a hurricane, when practical.
Depending on the complexity of the sampling design, sample sizes may be initially estimated by using standard equations (e.g., Thompson 1998) or by using commercial software (e.g., SAS Institute, Inc.) or freeware (R; http://www.r-project.org/) statistical programs to run simulations to estimate sample sizes required under various design scenarios. Determining sample sizes will be an iterative process such that after 3-5 years of data are gathered, another analysis may be conducted to refine sample size requirements and improve the design over time.
4.4 Minimum Sample Size Required for Detecting a Trend The minimum number of units sampled across space and time is dictated by • the minimum change that management would like to detect, • the acceptable Type 1 Error (probability of a false positive or false conclusion of change), • the acceptable Type 2 Error (probability of a false negative or failure to detect change), • the unexplained variance involved with the protocol, and • budgetary restrictions
4.5 Overview Designs
of
SFCN
Sampling
Below we discuss the sampling designs of the “Category 1” SFCN Vital Signs towards which SFCN plus a section on water quality monitoring. Only a few vital signs will work well together by being covisited/located. These are shown in Table 4-A. Table 4-E at the end of this chapter summarizes the target populations, sampling and revisit designs and lead agency for all SFCN vital signs. Additional details are given in the Protocol Development Summaries in Appendix Q.
Detecting a large change will require fewer sampling units and less robust data than a small change. Determining appropriate sample sizes requires consulting with management and/or local experts regarding the level of change that is desirable to detect and the level of Type 1 and Type 2 errors that are acceptable. Estimates of variance are made by either gathering some initial pilot data or
94
Chapter 4: Sampling Design
Table 4-A. SFCN Category 1 vital signs showing co-located/co-visited vital signs Group
SFCN Category 1 Vital Signs
Co-visited/located vital signs Marine Invertebrates-Rare, Threatened, Endangered - Diadema; Marine Exploited Invertebrates- Conch; sub-set of Marine fish communities monitoring; coral reef temperature
Marine Benthic Communities Marine Marine Fish Communities Marine Exploited Invertebrates Colonial Nesting Birds Wetland Ecotones and Community Structure Forest Ecotones and Community Structure Intertidal and above
Mangrove-marsh ecotone
Coastal Geomorphology
Freshwater fish and large macro-invertebrates
Periphyton; Aquatic invertebrates
Amphibians Land-use Change Invasive/Exotic Plants Invasive/Exotic Animals Surface water hydrology (rainfall, crest gage)
4.5.1 Marine Benthic Communities (with Marine Invertebrates-RTE (Diadema); Marine Exploited Invertebrates (conch); subset of marine fish communities) SFCN has divided the marine benthic world into two main types of substrate: hard-bottom and soft-bottom, which strongly affect the communities that establish. The primary focus of this vital sign is on coral reef communities on hardbottom substrate and submerged aquatic vegetation on soft-bottom substrate with very different sampling designs and sampling unit methodologies in each. Although other communities exist such as algal plains, these were not selected as the focus of this effort.
• Coral water temperature monitoring at reef depth Index coral monitoring sites at BISC, BUIS, DRTO and VIIS: Intensive coral monitoring sites were established as part of the prototype program at BUIS and VIIS beginning in 1999 and then expanded to BISC and DRTO in 2004. The protocol, “Using videography to monitor coral reefs, and using the AquaMap system” (for random within-site transect selection) was peer-reviewed in 1998. These index sites were selected because they were the sites of historical work, were sites of high coral cover, or were otherwise of management interest. 2 Site size ranges from 7,125-20,200 m . Twenty permanent, ten meter transects were randomly selected at each site. Each transect is videotaped annually and analyzed. During unusual events (e.g., bleaching/disease outbreaks) the frequency may increase. These sites have proven invaluable in documenting the declines after the 2005 bleaching and disease outbreak event and provide a rigorous set of monitoring data within these sites and SFCN plans to continue monitoring them.
1) Coral Reef Communities: The monitoring strategy for coral communities in the SFCN is split into four different components: • Index coral monitoring sites at BISC, BUIS, DRTO, VIIS • Extensive assessments of stony coral communities containing reef building coral species < 20m depth • Deep stony coral communities >20m depth
95
South Florida / Caribbean Network Vital Signs Monitoring Plan
Extensive assessments of stony coral communities containing reef building coral species 2- 20m depth: Because the index coral monitoring sites protocol is very localized in inference, SFCN is working to expand upon the existing protocol to a design that allows inference to all coral communities with >5% stony coral cover and between 2-20m depth throughout the park and will allow inside versus outside comparisons of marine protected areas (issue at DRTO and potentially BISC; BUIS is entirely protected). This sampling design is still in development with preliminary work being conducted at DRTO but will likely involve much 2 smaller sites (1600m ) of 4 transects, distributed throughout hard-bottom habitat in the parks, sampled in a rotating design. The majority of sampling effort and revisit frequency would be at sites with higher coral cover (>5% stony coral cover) but a low-level focus and long revisit interval (10-20 years) would be used for low coral cover hard-bottom. SFCN also hopes to establish such designs at BISC, BUIS, and SARI. Resource management at VIIS felt the 5 intensive sites already established there were sufficient to answer their questions.
comparable to another pilot coral monitoring effort that is currently conducted with fish monitoring in Florida Keys and DRTO by NOAA, RSMAS, and FWC, but is re-randomized each year. Doing so might lend power to detect changes at lower coral cover sites, however, it is unclear whether this other effort will have long-term funding. Deep stony coral communities >20 m depth: SFCN will assess feasibility of the use of underwater remotely operated vehicle (ROV) and/or drop cameras to collect imagery of these areas for a more qualitative level of monitoring. Much less is known about these deep coral reefs. These deep areas occur in BUIS, DRTO, SARI and VIIS. Coral –water temperature monitoring at reef depth: At each intensive site and at a subset of the park-wide sites, continuous data loggers are being used to record water temperature at reef depth to serve as a covariate when assessing sudden changes. 2) Seagrass and other SAV 20m feasibility assessment TBD
1-2 yr rotation
Index sites with random permanent transects within site
Coral reefs of management interest
Coral - index sites
TBD
Revisit design
Membership design
Target population
Component
Subset overlap with coral monitoring; seagrass monitoring
Subset overlap with coral monitoring
Queen Conch?
Marine fish communities; queen conch
Coral-index sites; coral extensive design
Coral-temperature monitoring; Diadema; Subset of marine fish communities
SFCN with others?
SFCN/Park staff/NOAA
NOAA, FWRI with SFCN assistance
FHAP-SF, DERM, SFCN/Park staff?
SFCN/ Park staff/ NOAA
SFCN
SFCN
SFCN
Co-location/ Lead Agency Co-visitation protocols or University Coral-temperature monitoring; Diadema; SFCN subset of marine fish communities
Table 4-E. Sampling design components for SFCN Vital Signs. White rows are those vital signs components for which SFCN is the lead agency or for which SFCN anticipates expending substantial field effort in cooperation with another agency. Grey rows indicate vital signs components for which a park or another agency is lead; for which outside funding would be required (mapping) or for which monitoring is deferred; TBD abbreviates “To be developed.” Vital Sign Strategies are further described in Appendix P. Protocols are further described in Chapter 5 and in Appendix Q. Priority rank is given in brackets [ ].
Chapter 4: Sampling Design
Nutrient Dynamics[4]
Target population
Hydrology – EVER, BICY
114
Permanent stations at canals
Monthly grab samples
Freshwater prairies; marine nutrient levels
Nutrient levels, 1 site per bay selected by conductivity, pH, DO in 15 best judgment bays
EVER
VIIS
Biannual grab samples
Monthly grab samples
Park-wide marine nutrient 15 permanent sites levels
DRTO
75 permanent sites
Monthly grab samples
25 permanent sites
Biscayne Bay marine nutrient levels
BISC
Monthly grab samples
16 freshwater permanent sites
Freshwater prairies nutrient levels
Permanent station selected by best judgment Continuous on Salt River near park boundary
Continuous
Continuous
BICY
Hydrology - SARI - adding Flows into Salt River Bay crest gage
Hydrology – VIIS
Continuous
Revisit design
Permanent stations chosen at gates, by best Continuous judgment, and where models showed deficiency
Index sites chosen for convenience
Membership design
2 stream gages in Guinea gut, Lameshur Bay ephemeral guts selected Gut by best judgment
Canal flows into Biscayne Bay
Water depth, timing, duration into and across EVER & BICY and into FL Bay
Air temperature, rainfall, Weather stations - SARI, winds at selected index BUIS, possibly DRTO sites to provide covariates for other vital signs
Component
Surface Water Hydrology – BISC Hydrology[3]
Network Vital Sign in Priority Rank Order
Table 4-E. Sampling design components for SFCN Vital Signs (cont.)
Estuarine salinity patterns; pytoplankton
Estuarine salinity patterns; pytoplankton
Park staff
Park Saff/ SFWMD/FIU/US GS
FIU
FIU/DERM /SFWMD
Park Saff/ SFWMD
SFCN with Park staff
USGS (continued funding uncertain)
Joe Boyer/FIU
Park staff, SFWMD, USGS
SFCN with Park staff
Co-location/ Lead Agency Co-visitation protocols or University
South Florida / Caribbean Network Vital Signs Monitoring Plan
115
Annual or biennial
Every 10-15 years
Complete map Complete map
All natural areas in WCAs and parks All natural areas within parks
Every 10-15 years
TBD
Black coral within network parks (at diveable TBD depths?)
Co-located on coral-index site transects and parkRotation TBD wide transects
TBD
Opportunistic
Black Coral Feasibility Assessment
Acropora species
Voluntary reporting
Diadema population size at coral reefs in parks
Acroporiid populations within parks
Voluntary Reporting Program
Diadema
All invasive plant species within south Florida
Corridors of Invasiveness
Revisit schedule to each area weighted by likelihood of problem
Two-phase design - All roads, trails, campgrounds, entry points sampled with either complete samples or random transects depending on area
Newly established exotic and invasive species in parks
Annual or biennial
Complete aerial survey
Visible targeted invasive plant species populations in parks
SRF-Digital Sketch Mapping
Revisit design
Membership design
Target population
Component
EVER, 2/3 BICY Vegetation Communities Extent BISC, DRTO, BUIS, VIIS, & Distribution [7] SARI, 1/3 BICY
Marine Invertebrates-Rare, Threatened, Endangered [6]
Invasive/Exotic Plants [5]
Network Vital Sign in Priority Rank Order
Table 4-E. Sampling design components for SFCN Vital Signs (cont.)
CERP/ SFWMD
Coral - index sites; coral - extensive design
SFCN with NPS Natl. Mapping Prgm
CERP/ SFWMD
SFCN
SFCN
Park staff
EPMT with SFCN assistance
EPMT & SFCN
EPMT with SFCN assistance
Co-location/ Lead Agency Co-visitation protocols or University
Chapter 4: Sampling Design
116
Marine Exploited Invertebrates [10]
Estuarine salinity patterns [9]
Colonial Nesting Birds [8]
Network Vital Sign in Priority Rank Order All wading bird colonies in BICY, BISC, EVER and Complete aerial surveys WCAs
EVER - colony monitoring, SRF flights
TBD
SARI - colony monitoring
Harvest data-lobster, shrimp, crabs (Stone, Blue, others), Sponges
Pink Shrimp
Queen Conch
Spiny Lobster
Biscayne & Florida Bays
Brown Pelican nesting
BUIS, VIIS - colony monitoring
South Florida commercial harvest
Population size, size distribution, sex ratio within parks Population size, size distribution, maturity ratio within seagrass in parks Juvenile pink shrimp relative abundance in West, South Central & North Central Florida Bay, the Southwest Coast, Biscayne Bay
Fishing boat captain reporting
Continuous
2x annually
5 yr rotation
TBD; probably GRTS or stratified random within regions Mixture of historic design plus stratified random in newer sites
Annual
Continuous and monthly
TBD
Annual or biennial
Nutrient dynamics; phytoplankton
Seagrass monitoring
FWRI, Park staff
NOAA- SEFSC /USGS
SFCN, NOAA with others
SFCN
SFCN with Park staff Park staff, NOAA, AOML, FIU, DERM
Park staff
Park staff with SFCN
SFCN
Weekly or monthly, Dec-Jun 2-3 times during breeding season
FAU with SFCN assistance to locate colonies
Park staff
Co-location/ Lead Agency Co-visitation protocols or University
SRF, monthly DecJun
SRF, monthly DecJun
Revisit design
TBD
Salinity levels through Permanent sites time in Biscayne & FL Bays
TBD
Complete surveys
Sooty tern & brown noddy Surveys during breeding colonies at DRTO (other season (sub-sample in species also counted) time)
DRTO - colony monitoring
All wading bird colonies at BICY – colony monitoring BICY visible from Complete surveys helicopter surveys All wading and shorebird BISC- colony monitoring colonies at BISC visible Complete surveys from helicopter surveys
Target population
Component
Membership design
Table 4-E. Sampling design components for SFCN Vital Signs (cont.)
South Florida / Caribbean Network Vital Signs Monitoring Plan
117
Wetland Ecotones and Community Structure [14/15/16]
Visitor Use [13]
Invasive/Exotic Animals [12]
Land-use Change [11]
Network Vital Sign in Priority Rank Order Land-use within 5 miles of USVI parks, 75 miles of S. Complete map Florida parks New permits/zoning changes along & near park boundaries
Land-use change
Permitting/zoning changes next 1-3 yrs
BISC, BICY, supplement EVER?
EVER-CERP funded
Canals - EVER, BICY
1-2 yr rotation
Continuous
3 yr rotation of CSSS Marl Prairies (?); 5-10 yr rotation of marl prairie-slough transects (?); longer rotation for ridge & slough plots (?)
5-10 yr rotation
TBD: Probably sample of hotspots using transects within canals Park visitation counts, vendor reporting, trailhead surveys CSSS monitoring pts & transects within marl prairies; permanent randomly selected transects from prairies to slough; permanent unequal probability selection of ridge & slough plots TBD; probably combination of historical sites plus stratified random selection of additional community sampling units and ecotonal transects
Park visitation by general use type
CSSS marl prairies; transitions between marl prairies and ridge & slough; ridge & slough
Vegetation communities structure & composition; gradients along critical ecotones
Annual
Annual
Every 5 years
Revisit design
New exotic aquatic species in canals adjacent to parks
Exotic species detected by Surveying other programs various monitoring Varies with program for new species programs within parks
Complete survey
Target population
Component
Membership design
Table 4-E. Sampling design components for SFCN Vital Signs (cont.)
SFCN/ Park staff
CERP, FIU, SFWMD, FAU
Park staff
SFCN/Park staff
SFCN/Park staff
SFCN
SFCN
Co-location/ Lead Agency Co-visitation protocols or University
Chapter 4: Sampling Design
118
5-10 yr rotation
2-5x annually
2x annually
TBD; probably combination of historical sites plus stratified random selection of additional community sampling units and ecotonal transects
Vegetation communities structure & composition; gradients along critical ecotones
Vegetation communities structure & composition; gradients along critical ecotones
EVER-multistage with Periphyton composition & GRTS selection of main structure in EVER Shark units, mapping each unit, River Slough, Taylor 3 subsamples/unit; Slough, and WCAs NE BICY - pilot study TBD; Control-impact design w/ restricted random selection of paired sampling sites of Periphyton composition & marsh/cypress domes, 3 structure in NW corner of samples per unit & 5 BICY throws/sample. (possible restrictions due to access & proximity to hydrology stations)
Forest Ecotones and Community BISC, BICY, EVER, VIIS Structure [14/15/16]
All parks
EVER
Mangrove-Marsh Ecotone [14/15/16]
BICY NW corner
5-10 yr rotation
TBD; probably combination of historical sites plus stratified random selection of additional community sampling units and ecotonal transects
Periphyton (Freshwater) [17]
Revisit design
Membership design
Component
Target population
Network Vital Sign in Priority Rank Order
Table 4-E. Sampling design components for SFCN Vital Signs (cont.)
Freshwater fish and large macroinvertebrates; aquatic invertebrates
Freshwater fish and large macroinvertebrates; aquatic invertebrates
SFCN
FIU, SFWMD
SFCN, USGS, CERP, FIU, FAU, other programs
SFCN, Park staff, other prgms
Co-location/ Lead Agency Co-visitation protocols or University
South Florida / Caribbean Network Vital Signs Monitoring Plan
119
EVER + NE BICY
Population size, growth, survival in south Florida
Population size, body condition, nesting success within EVER and WCAs, Historic or reference sites reported by region & subregion Major benthic communities extent & spatial distribution
Sea Turtles [20]
American crocodile [21]
American Alligator [22]
Benthic Communities Extent & Distribution [23]
Every 10-15 years
Annual
Historic or reference sites
Sea turtle nesting occurrences & successful reproduction on park nesting beaches
Complete map
Complete sample or large Daily-biweekly sub-sample of nesting during nesting beaches season Annual
Research, varies
Research, varies
2x annually
2-5x annually
Revisit design
Research, varies
BICY NW corner
EVER-multistage with GRTS selection of main units, mapping each unit, 3 subsamples/unit; NE BICY - pilot study
FW fish, crayfish, grass shrimp abund., community composition & structure in EVER Shark River Slough, Taylor Slough, and WCAs TBD; Control-impact design w/ restricted FW fish, crayfish, grass random selection of shrimp abund., paired sampling sites of community composition & marsh/cypress domes, 3 structure in six basins in samples per unit & 5 NW corner of BICY (3 throws/sample. (possible impacted, 3 not-impacted) restrictions due to access & proximity to hydrology stations)
Membership design
Target population
Component
Contaminants [19]
Freshwater fish and large macroinvertebrates [18]
Network Vital Sign in Priority Rank Order
Table 4-E. Sampling design components for SFCN Vital Signs (cont.)
FL Bay-mapping mud banks, berms
Periphyton; aquatic invertebrates
Periphyton
SFCN with NPS Natl. I & M Prgm
USGS/UF
USGS/UF
Park staff
Various researchers, agencies
SFCN
FIU, FAU, Park staff, USGS, Audubon of Florida
Co-location/ Lead Agency Co-visitation protocols or University
Chapter 4: Sampling Design
Annual
TBD
120
species
Aquatic invertebrates in wet BICY NW corner prairies & marshes [32]
fish
TBD; Control-impact design w/ restricted random selection of Aquatic invertebrates paired sampling sites of community composition & marsh/cypress domes, 3 structure in NW corner of samples per unit & 5 BICY throws/sample. (possible restrictions due to access & proximity to hydrology stations)
Creel-census (fishery dependent); reef fish monitoring (stratified random); individual studies (juv. sea trout monitoring; MOTE shark monitoring; USVI red hind)
Goliath Grouper, Nassau Grouper (Red Hind in USVI), Sharks, Spotted Sea Trout, Snook – relative abundance/density, occupancy, spatial/ temporal distribution, density, size structure, catch per unit effort
Focal [30]
All known burns within BICY, EVER
BICY, EVER vegetation
Fire Return Interval Departure [29]
Aerial survey counts of all visible adults
2x annually
Variable
Annual
Annual
Every 10-15 years
Annual
Preliminary work: Markrecapture of adults, nursery surveys, creel surveys
Complete map
Annual or bi-annual, 3x per sampling year
Revisit design
GRTS with strata
Membership design
South Florida manatee population size, mortality
Fl Bay - mapping mud FL Bay mud banks & banks, berms berms
Target population Amphibian communities in buffered areas along roads, trails, accessible areas of parks Regional sawfish population size, distribution, location of nursery grounds, reproduction, habitat use Sediment Elevation Tables Coastal mangroves and (SETs) salt pond elevations
Component
Protected Marine mammals [28]
Coastal Geomorphology [27]
Sawfish [26]
Amphibians [25]
Network Vital Sign in Priority Rank Order
Table 4-E. Sampling design components for SFCN Vital Signs (cont.)
Park staff, FWRI, MOTE, RSMAS, SFNRC, UVI
Park staff with SFCN/USGS
FWRI, FKNMS
SFCN with Park staff; NPS Natl. I & M Prgm
SFCN, USGS
Freshwater fish and large macroSFCN invertebrates; periphyton
Benthic Communities Extent & Distribution
Mangrove-marsh ecotone
MOTE
SFCN
Co-location/ Lead Agency Co-visitation protocols or University
South Florida / Caribbean Network Vital Signs Monitoring Plan
Regional air quality
Air Quality-Mercury
121
Index site at EVER
Weekly
Park staff w/SFWMD
Park staff w/NPS-ARD
Regional air quality
Air QualityDeposition Weekly
Permanent water quality monitoring stations selected by best judgment Monthly and continuous synoptic sampling
Algal blooms using Chlorophyll a as proxy by region within EVER, BISC & adjacent waters
Phytoplankton (Marine) [34]
1 Index site each at EVER, VIIS
FIU, NOAA, SFWMD, USF
Annual
Florida panther [33]
Nutrient dynamics; estuarine salinity patterns
Park staff in cooperation with regional efforts
Radio-collaring of all adults
Co-location/ Lead Agency Co-visitation protocols or University
Regional and within park panther population size, home ranges, denning, habitat use
Revisit design
Membership design
Component
Target population
Network Vital Sign in Priority Rank Order
Table 4-E. Sampling design components for SFCN Vital Signs (cont.)
Chapter 4: Sampling Design
South Florida / Caribbean Network Vital Signs Monitoring Plan
122
Chapter 5: Sampling Protocols are essential for effective monitoring of vital signs through time.
“Monitoring protocols are detailed study plans that explain how data are to be collected, managed, analyzed, and reported, and are a key component of quality assurance for natural resource monitoring programs. Protocols are necessary to ensure that changes detected by monitoring actually are occurring in nature and not simply a result of measurements being taken by different people or in slightly different ways. . . . A good monitoring protocol will include extensive testing and evaluation of the effectiveness of the procedures before they are accepted for long-term monitoring. Peer review of protocols and revisions are essential for their credibility. The documentation should include reviewers’ comments and authors’ response.” Oakley, et al. (2003) 5.1
The National Park Service Inventory and Monitoring Program requires that all monitoring towards which SFCN funding is to be used either A) use an existing protocol developed by another agency or program that has already been peerreviewed and field-tested or B) if developed internally must: (1) follow the Oakley et al. (2003) protocol standards, (2) be peer-reviewed, and (3) be approved by the Regional I&M Coordinator before they are finalized for long-term monitoring. The Oakley et al. (2003) format basically consists of three main types of information: a narrative, SOPs, and any supplemental materials. The narrative contains an overview of the background and objectives, sampling design, field methods, data handling, analysis and reporting, personnel requirements and training, and operational requirements. The SOPs are detailed procedures for all components described in the narrative. Supplemental materials include databases, GIS layers, related data and reports, reviewer comments, etc.
Protocol Development and SFCN Role Relative to Existing Programs
SFCN will be developing twelve formal monitoring protocols during the first five years (Table 5-A). Monitoring protocols identify methods for gathering data, outline a process to collect data, and establish how data will be analyzed and reported. A good monitoring protocol should be appropriate for the task, accurate, reliable, feasible, and costeffective (Margoluis et al. 1998). Good rigorous protocols contain detailed study plans, clear objectives, unambiguous stepby-step Standard Operating Procedures (SOPs) for data collection, management, QA/QC and analysis, training and equipment requirements, documentation of protocol changes, and relevant support information. Careful design and documentation of protocols is necessary to ensure that changes detected by monitoring actually are occurring in nature and do not stem from measurement variability introduced when different people or methods are used (Oakley et al. 2003). Rigorous protocols
Thirty-three of the vital signs are already being monitored either in their entirety or in part by other groups. For vital signs already being monitored by existing programs, SFCN will work to gather and archive copies of the existing protocols, SOPs and QA/QC guidelines. As appropriate, SFCN will develop SOPs for how the network will analyze and report results from these other groups. Some CERP funded programs are still in the process of developing protocols and final versions may not be available for several years. CERP has its own protocol documentation and quality review process
123
South Florida / Caribbean Network Vital Signs Monitoring Plan
Table 5-A. SFCN protocols to be developed in Oakley et al. (2003) format sorted by year due. Many will be adaptations or expansions of existing protocols. Protocol
Component Coral - Index sites Coral – Extensive design, 2-20m deep Coral - Deep Coral >20m Feasibility Assessment Coral - Temperature Monitoring Seagrass - Outer BISC, DRTO, BUIS, SARI, VIIS
Year Due 2007 2008 2014 2007 2009*
Diadema
2007
Conch
2009**
BISC
2009
Corridors of Invasiveness
2009
Land-use change Permitting/zoning changes next 1-3 yrs
2009 2009
BISC (Coastal Shelf), DRTO
2009
BUIS, VIIS, SARI Florida Bay & Biscayne Bay (EVER, BISC) Soil Elevation Tables (SETs)
2009* 2009*** 2009
BISC, BICY, EVER, VIIS
2010
BICY NW corner
2010
Canals - EVER, BICY
2010
Mangrove-Marsh Ecotone
All parks
2010
Spiny Lobster Amphibians
Network-wide BICY, EVER, VIIS
2010 2012
Marine Benthic Communities
Colonial Nesting Birds Invasive/Exotic Plants – Corridors of invasiveness Land-use Change
Marine Fish Communities Soil Elevation Forest Ecotones & Community Structure Freshwater fish, invertebrates, and periphyton Invasive/Exotic Fish - Canals
* ** ***
Partially dependent upon whether NOAA Coastal Monitoring and Assessment Program continue to fund monitoring in USVI SFCN may defer if co-sampling with seagrass monitoring does not yield sufficient power May be deferred if existing programs sufficiently cover the bays and if reef fish monitoring takes more staff time than initially anticipated
which is outlined in the Quality Assurance Systems Requirements (QASR) Manual for the Comprehensive Everglades Restoration Plan (CERP 2006).
Summary” (PDS) for each of the twelve protocols in Appendix Q.
5.2 Protocol Development Summaries
By September 2008, drafts of the following components of the Marine Benthic Communities protocol have been completed: Coral – Index sites Coral – Temperature monitoring Diadema
5.3 Protocol Work completed
Table 5-B provides the 12 protocols SFCN is developing, the vital signs to which each protocol relates, justifications, monitoring objectives, and parks in which each protocol will be implemented. SFCN has written a 1-6 page “Protocol Development
124
Marine Exploited Invertebrates
Marine Invertebrates: Rare, Threatened, Endangered
Marine Benthic Communities
Relevant Vital Signs:
Marine Benthic Communities
Protocol
125
4. Determine status and trends in adult and juvenile conch density and size structure within seagrass communities 20 m, determine status and trends in percent cover of major taxonomic groups (stony coral, algae, octocoral, sponge), coral species diversity and coral community structure, pending a pilot study to establish feasilibility, safety and cost-effectiveness. 6. Determine status and trends in stony coral recruitment, pending a pilot study to establish feasilibility, safety and cost-effectiveness.
1. At depths of 2-20 m with initial stony coral cover >5%, determine the status and trends in the percent cover of major taxonomic groups (stony coral, algae, octocoral, sponge), coral species richness, coral community structure, coral condition (proportion bleached; number, size and type of coral disease lesions), algal community structure (crustose coralline algae, macroalgae, turf algae), rugosity, and density of the herbivorous long-spined sea urchin (Diadema antillarum). 2. At reef depth (2-20 m), document with a temperature logger when ocean temperatures exceed thresholds known to cause bleaching or other stress to corals and how long the event occurred. 3. Determine status and trends in seagrass occurrence, percent cover, community composition, and epiphytic load in areas