The National Centre for Ornithology, The Nunnery, Thetford, Norfolk IP24 2PU ...... Ringed Plover, Grey Plover, Dunlin and Black-tailed Godwit have all shown ...
BTO Research Report No. 239
WeBS Alerts 1998/99: Changes in numbers of wintering waterbirds in the United Kingdom at national, country and Special Protection Area (SPA) scales
Authors
Philip W. Atkinson, Graham E. Austin, Niall H.K. Burton, Andrew J. Musgrove, Mark Pollitt & Mark M. Rehfisch
Report of work carried out by The British Trust for Ornithology under contract to the WeBS Partnership
March 2000 (recompiled February 2011)
British Trust for Ornithology
The National Centre for Ornithology, The Nunnery, Thetford, Norfolk IP24 2PU Registered Charity No. 216652
CONTENTS Page No. List of Tables ..................................................................................................................................3 List of Figures .................................................................................................................................5 Executive Summary .......................................................................................................................6 1. 1.1 1.2 1.3 1.4
1.5
INTRODUCTION..............................................................................................................8 Introduction ........................................................................................................................8 The Wetland Bird Survey (WeBS) ...................................................................................8 The Alert Process ...............................................................................................................9 Methods .............................................................................................................................10 1.4.1 Coverage of species and sites ..............................................................................10 1.4.2 Calculation of Underhill indices .........................................................................11 1.4.3 Smoothing indices using GAMs ..........................................................................11 1.4.4 Assessment of change and calculation of Alerts ................................................11 1.4.5 SPA Site Alerts – species and site coverage .......................................................12 Interpretation of Numbers and Alerts ...........................................................................13 1.5.1 Units of abundance ..............................................................................................13 1.5.2 Interpretation of Alerts .......................................................................................14
2.1 2.2 2.3
UNITED KINGDOM – WATERBIRD POPULATION CHANGES AND ALERTS............................................................................................................................22 Population Change and Alerts ........................................................................................22 Species Generating a 50% Alert Using GAMs ..............................................................22 Species Generating a 25% Alert Using GAMs ..............................................................22
3. 3.1 3.2 3.3 3.4 3.5
ENGLAND........................................................................................................................29 Population Change and Alerts ........................................................................................29 Coverage of SPAs in England by the Waterbird Alert System ...................................29 Species Generating a 50% Alert using GAMs ..............................................................30 Species Generating a 25% Alert using GAMs ..............................................................30 Site Alerts – Special Protection Areas (SPAs) in England ...........................................30
4. 4.1 4.2 4.3 4.4 4.5
NORTHERN IRELAND .................................................................................................73 Population Change and Alerts ........................................................................................73 Coverage of SPAs in Northern Ireland by the Waterbird Alert System ....................73 Species Generating a 50% Alert Using GAMs ..............................................................73 Species Triggering a 25% Alert Using GAMs ...............................................................74 Site Alerts – Special Protection Areas (SPAs) in Northern Ireland ............................75
5. 5.1 5.2 5.3 5.4 5.5
SCOTLAND .....................................................................................................................88 Population Change and Country Alerts ........................................................................88 Coverage of SPAs in Scotland by the Waterbird Alert System ...................................88 Species Generating a 50% Alert .....................................................................................88 Species Generating a 25% Alert .....................................................................................89 Site Alerts – Special Protection Areas (SPAs) in Scotland ...........................................90
2.
BTO Research Report No. 239 March 2000
1
6. 6.1 6.2 6.3 6.4 6.5
WALES ...........................................................................................................................107 Population Change and Alerts ......................................................................................107 Coverage of SPAs in Wales by the Waterbird Alert System .....................................107 Species Generating a 50% Alert Using GAMs ............................................................107 Species Triggering a 25% Alert Using GAMs .............................................................108 Site Alerts – Special Protection Areas (SPAs) in Wales .............................................109
7. 7.1 7.2 7.3
CONCLUSIONS ............................................................................................................118 National Alerts ...............................................................................................................118 Geographical Trends and Country Alerts ...................................................................118 Site-based Alerts.............................................................................................................119 7.3.1 Coverage .............................................................................................................119 7.3.2 Site Alerts ............................................................................................................119 Recommendations and Future Development of the Alerts System ...........................120 7.4.1 Implementation of the Alerts System ...............................................................120 7.4.2 Technical issues to be addressed .......................................................................120
7.4
Acknowledgements ....................................................................................................................125 References ...................................................................................................................................126
BTO Research Report No. 239 March 2000
2
LIST OF TABLES Page No. Table 1.1
Wader and wildfowl species or populations which are regularly indexed as part of the Wetland Bird Survey and to which an Alert system can be applied ....................................................................................................................16
Table 1.2
Species to which the WeBS Alert system has been applied to and the months used in calculating indices for wildfowl species in Great Britain and Northern Ireland ..............................................................................................18
Table 1.3
Table describing the first winter in which waterbird counts occurred for species, or groups of species in each country ........................................................19
Table 2.1
Percentage change and Alerts over 5, 10, 25 and all years of counts. Population size refers to the average number of birds per month recorded on the WeBS sites used ..........................................................................................24
Table 3.1
Percentage change and Alerts over 5, 10, 25 and all years of counts. Population size refers to the average number of birds per month recorded on the WeBS sites used ..........................................................................................45
Table 3.2
Species/site combinations which are cited/proposed for English SPAs and are currently covered by the waterbird Alert system ......................................46
Table 3.3
Species/site combinations which are cited/proposed for English SPAs and are not currently covered by the waterbird Alert system ................................47
Table 3.4
Waterbird species which are cited/proposed for individual English SPAs but which are not regularly indexed by WeBS and therefore not currently treated under the waterbird system ........................................................................48
Table 3.5
Population change and site Alerts for waterbirds on SPAs in England over 5, 10, 25 and all years ............................................................................................49
Table 4.1
Percentage change and Alerts over 5, 10, 25 and all years of counts. Population size refers to the average number of birds per month recorded on the WeBS sites used ...............................................................................................79
Table 4.2
Species which are cited/proposed for SPAs in Northern Ireland and are covered by the waterfowl Alert system .................................................................80
Table 4.3
Species which are cited for SPAs in Northern Ireland that are not currently covered by the waterfowl Alert system .................................................................80
Table 4.4
Population change and site Alerts for waterbirds on SPAs in Northern Ireland over 5, 10, 25 and all years ....................................................................................81
BTO Research Report No. 239 March 2000
3
Page No. Table 5.1
Percentage population change and Alerts over 5, 10, 25 and all years of counts. Population size refers to the average number of birds per month recorded on the WeBS sites used in this analysis during the winter of 1998/99 ..................................................................................................................95
Table 5.2
Species which are cited/proposed for SPAs in Scotland which are currently covered by the waterfowl Alert system .................................................................96
Table 5.3
Species which are cited for Scottish SPAs but which are not currently covered by the waterfowl Alert system .................................................................97
Table 5.4
Population change and site Alerts for waterbirds on SPAs in Scotland over 5, 10, 25 and all years ....................................................................................98
Table 6.1
Percentage change and Alerts over 5, 10 25 and all years of counts. Population size refers to the average number of birds per month recorded on the WeBS sites used ........................................................................................111
Table 6.2
Species which are cited/proposed for SPAs in Wales and are covered by the waterfowl Alert system ........................................................................................112
Table 6.3
Species which are cited for SPAs in Wales that are not currently covered by the waterfowl Alert system ..................................................................................112
Table 6.4
Population change and site Alerts for waterbirds on SPAs in Wales over 5, 10, 25 and all years ..............................................................................................113
Table 7.1
Summary of the Alerts issued in 2000, using the 1998/99 WeBS data .......................................................................................................................122
Table 7.2
Coverage of the Site Alert species/site combinations by country and nationally..............................................................................................................123
BTO Research Report No. 239 March 2000
4
LIST OF FIGURES Page No. Figure 2.1
United Kingdom waterfowl Underhill and smoothed GAM counts for regularly indexed wildfowl species. Units refer to the average number of birds counted per month ..............................................................................25
Figure 3.1
English waterbird Underhill and smoothed GAM indices for regularly indexed wildfowl species .................................................................................66
Figure 3.2
Changes in the numbers of waterbirds across English SPAs over 5, 10 and 25 years .....................................................................................................70
Figure 4.1
Changes in numbers of regularly indexed waterbirds in Northern Ireland ......84
Figure 4.2
Changes in the numbers of waterbirds across SPAs in Northern Ireland over 5,10 and 25 years .....................................................................................87
Figure 5.1
Changes in the average number of birds recorded per month on WeBS sites in Scotland .............................................................................................101
Figure 5.2 (a-c) Changes in the numbers of waterbirds across Scottish SPAs over 5, 10 and 25 years ...................................................................................................105 Figure 6.1
Changes in the average number of birds recorded per month on WeBS sites in Wales .................................................................................................114
Figure 7.1
General indicator of change of waterfowl on selected estuarine sites in England ..........................................................................................................124
BTO Research Report No. 239 March 2000
5
Executive Summary 1.
The Wetland Bird Survey (WeBS) is a nation-wide scheme that aims to monitor nonbreeding waterbirds. It is a joint scheme of the British Trust for Ornithology (BTO), The Wildfowl and Wetlands Trust (WWT), the Royal Society for the Protection of Birds (RSPB), and the Joint Nature Conservation Committee (JNCC - on behalf of the Countryside Council for Wales, English Nature, the Environment and Heritage Service in Northern Ireland and Scottish Natural Heritage). WeBS is an amalgamation of two previous long running monitoring schemes, the Birds of Estuaries Enquiry (BoEE) and the National Waterfowl Counts (NWC).
2.
The principal aims of WeBS are to identify important sites and to determine changes in the numbers and distribution of divers, grebes, Cormorant, herons, wildfowl, rails, waders, gulls, terns and Kingfisher in the United Kingdom. Core Counts are made at around 2,000 wetland sites of all habitats although estuaries and large still waters predominate. Volunteers carry out monthly co-ordinated counts, principally from September to March with fewer observations in the summer months. Approximately 250,000 records are collected annually.
3.
One of the aims of WeBS is to monitor population change and highlight large changes in populations. This requirement led to the development of an ‘Alert’ system for waterbirds (Atkinson & Rehfisch 2000; Underhill 2000) through which population change can be assessed across a range of spatial scales and for a variety of species. The aim of the system is to take data from the monthly waterbird counts and remove the year-to-year variation in the counts by smoothing the data to reveal the underlying trend in that species’ population. The smoothed index is then used to calculate population changes over 5, 10 and 25 year periods and also over the entire time period that the species was counted for. Species which have undergone major population changes are flagged by issuing an Alert if the population has changed (either increased or decreased) by more than 25% (Medium Alert) and a higher level of Alert (High Alert) if the population has changed by over 50%. This method allows interpretation of the annual indices in terms of short-, medium- and long-term change in the population. For this first implementation, two different methods were used and evaluated. The first is based around a running mean of Underhill indices and in the second, smoothing is performed using General Additive Models (GAMs).
4.
This report constitutes the first implementation of the Alert system to WeBS data. Population change was calculated for thirty-seven species of waterbird at UK and country (England, Northern Ireland, Scotland and Wales) scales. For those populations which reached national, or international, importance change was also calculated at 70 Special Protected Areas (SPAs) or proposed Special Protected Areas (pSPAs). Forty-eight of these sites were in England, 6 in Northern Ireland, 14 in Scotland and 2 in Wales. In total, data were available for 623 out of the 967 possible species/site combinations.
5.
At the UK scale, most species were stable or increasing over all time periods. Four species raised an Alert. Medium Alerts were raised for Mallard over 10 years, European White-fronted Goose over 10 and all years, Knot over all years and Turnstone over 10 years. A similar situation was found for England but more Alerts were raised in other countries. In Northern Ireland 9 Medium and 3 High Alerts were
BTO Research Report No. 239 March 2000
6
raised, in Scotland 5 Medium and 5 High Alerts and in Wales 10 Medium and 7 High Alerts were raised. 6.
Site Alerts were performed for 623 species/site combinations. Coverage varied between countries. Coverage in Wales was high at 95% but this was mostly due to the small number SPAs. Coverage in England and Northern Ireland was broadly similar at 70 and 68% but low in Scotland at 39%. The low coverage in Scotland was due to large numbers of WeBS species which are not currently covered by the WeBS Alert System.
7.
An index of change across all species was developed for each site to identify sites where there are general declines in waterbirds. Over 25 years, most SPAs have shown a general increase in nationally or internationally important waterbird populations. Lindisfarne was the notable in that it has shown consistent declines in waterbirds. Over 10 and five year periods the following SPAs were identified as showing shortterm declines in waterbirds: the Blackwater Estuary, Chichester and Langstone Harbours, Medway Estuary, Severn Estuary, the Wash, Belfast Lough, Loughs Neagh & Beg, the Inner Moray Firth and the Burry Inlet.
8.
Further development work is recommended. SPA boundaries should be matched as closely as possible to WeBS boundaries as currently some WeBS sites incorporate more than one SPA and vice versa.
9.
There is also a need to refine the analysis of population change of all species on each site to identify sites where general declines are occurring across all species. At present the change index is crude and each species has equal weighting in determining (a) the change index and (b) average inter-annual population change for all species. Weighting the inter-annual change by the total flyway population size for that species may be a more effective way of determining where large or widespread declines are taking place.
BTO Research Report No. 239 March 2000
7
1.
INTRODUCTION
1.1
Introduction
Wetland sites support the vast majority of the internationally important bird populations that occur in Britain and Ireland and, as such, are one of the most important habitats for birds in an international context. Since the winter of 1966/67 the majority of the nationally and internationally important sites in England, Scotland and Wales have been counted for wildfowl, extending to waders in 1969/70, Coot and Great Crested Grebe in 1983/83, Little Grebe in 1985/86 and Cormorant in 1986/87. Sites in Northern Ireland were counted for waders from 1970/71 and other waterbirds were added in the winter of 1986/87. These counts are routinely reported on under the Wetland Bird Survey (WeBS) monitoring scheme (e.g. Cranswick et al. 1999). The annual WeBS reports provide wader and wildfowl indices for Britain and Ireland combined (waders) or separately (wildfowl & other waterbirds) but do not specifically assess population change either at a national or country level. To effectively monitor population change of important bird populations, data need to be readily available at different scales to examine changes at an individual country, region or site level. This requirement led to the development of an ‘alert’ system for waterbirds (Atkinson & Rehfisch 2000; Underhill 2000) through which population change can be assessed across a range of spatial scales and for a variety of species. The aim of the system is to take data from the monthly waterbird counts and remove the year-to-year variation in the counts by smoothing the data to reveal the underlying trend in that species’ population. The smoothed index is used to calculate population changes over 5, 10 and 25 year periods and also over the entire time period that the species was counted for. Species which have undergone major population changes are flagged by issuing an Alert if the population has changed (either increased or decreased) by more than 25% and a higher level of Alert if the population has changed by over 50%. This method allows interpretation of the annual indices in terms of short-, medium- and long-term change in the population. This system was tested and applied to waterbird data in a previous report (Atkinson & Rehfisch 2000) and full details of the rationale behind alerts are contained there. Two methods were tested (the Underhill method and the General Additive Model method) and both are presented here. The use of General Additive Models (GAMs) is preferable for statistical reasons but they are extremely computer intensive. Both methods were run concurrently for this report but it is envisaged that one or other method will be used in future years. This report presents the first implementation of the WeBS Alert system and presents population change on a national level, a country level (England, Northern Ireland, Scotland and Wales) and also a site level. The sites were current or proposed Special Protection Areas (SPAs) and the change was calculated for all species that are currently cited or proposed as newly qualifying. 1.2
The Wetland Bird Survey (WeBS)
The Wetland Bird Survey (WeBS) aims to monitor non-breeding waterbirds in the UK and is a joint scheme of the British Trust for Ornithology (BTO), The Wildfowl and Wetlands Trust (WWT), the Royal Society for the Protection of Birds (RSPB), and the Joint Nature BTO Research Report No. 239 March 2000
8
Conservation Committee (JNCC - on behalf of the Countryside Council for Wales, English Nature, the Environment and Heritage Service in Northern Ireland and Scottish Natural Heritage). WeBS is an amalgamation of two previous long running monitoring schemes, the Birds of Estuaries Enquiry (BoEE) and the National Waterfowl Counts (NWC). The principal aims of WeBS are to identify important sites and to determine changes in the numbers and distribution of divers, grebes, Cormorant, herons, wildfowl, rails, waders, gulls, terns and Kingfisher in the United Kingdom. Core Counts are made at around 2,000 wetland sites of all habitats although estuaries and large still waters predominate. Volunteers carry out monthly co-ordinated counts, principally from September to March with fewer observations in the summer months. Approximately 250,000 records are collected annually. Only a small proportion of those species recorded as part of the Wetland Bird Survey are regularly indexed. Of the 125 species recorded in the 1996-97 WeBS report (Waters et al. 1998), only 12 waders and 29 wildfowl species or populations are either sufficiently common or have a sufficiently large proportion of their populations on WeBS sites to be indexed (Table 1.1). Currently the normal method of indexing these species is by the method described by Underhill & Prys-Jones (1994) which uses a log-linear Poisson generalised linear model as its base. The counts are modelled as a function of site, year and month factors and the year factor is used as a base for the index which is scaled to a value of 100 in either the first or last year. For each species certain months are used to index the population. These are chosen to be the months in which the population of that species is most stable. For waders this is December through to February but varies with different species of wildfowl (Table 1.2). 1.3
The Alert Process
The overall aim of the WeBS Alert system is to devise a method whereby it is possible to flag up large changes in waterbird abundance at national, regional and site level. The coverage of the WeBS survey is an important consideration when assessing population change. For these changes to be relied on, it is essential that the survey covers a representative sample of sites. For strictly estuarine species, this can be accepted as a valid assumption because over 95% of estuaries in Great Britain are counted annually. However, for some of the more widespread wildfowl such as Mallard, much of the population occurs inland. The counting of inland sites follows no formal sampling pattern and therefore it is unclear as to whether these are a representative sample. For these species, it is important that a stratified sample of estuaries, lakes and rivers of varying sizes is used for indexing. This is something that needs to be addressed in the future but, for the purposes of this report, all Core WeBS sites are used for waterbirds other than waders. For waders, the traditional set of estuaries that are used to produce annual indices are used. The UK holds internationally important populations of waterbirds and there is a statutory duty on government to monitor these populations. National and regional indexing using the Underhill method allows inter-annual variation in counts to be described but, due to sampling error and natural annual fluctuations, there can be a great deal of variation between counts. For statutory monitoring it is therefore essential to differentiate between these natural population fluctuations and medium to long-term population changes. For this, a new way of calculating indices which smoothes the annual fluctuations is useful. Population change over various time periods can then be calculated and trends identified.
BTO Research Report No. 239 March 2000
9
The Alert system provides a framework in which short-, medium- and long-term population changes in waterbird populations can be evaluated. If population change over a given time period exceeds a certain limit, then an alert is issued which acts as a warning as to the possibility of large changes in that population. These alerts would then be issued to WeBS partners and the wider conservation community. Alerts can be set both for populations that are increasing or declining. Predetermined limits need to be set initially but would have to come under review as the scheme progresses. For waterbirds, the suggested time periods over which change could be calculated are 5, 10 and 25 year periods. Alerts would be raised if population change exceeded 25% (a 25% Alert or ‘Low Alert’) or 50% (a 50% Alert or ‘High Alert’) over each given time period. For site-based Alerts, variation in the numbers of waterbirds is often more extreme that at a larger scale and so only changes of 50% trigger an Alert at the site level. In this analysis, we only report on the negative Alerts (i.e. declines) in any detail. Species that show large year to year fluctuations will be more likely to trigger alerts. A high degree of smoothing applied to the indices will remove much of these fluctuations but it is likely that highly variable species will trigger a series of five year Alerts, either positive or negative. Alerts should therefore be advisory and the particular species ecology and population dynamics are extremely important in interpreting the alerts once they have been triggered. This is likely to be more of a problem for passerine species such as Wren Troglodytes troglodytes, which show annual fluctuation orders of magnitude higher than most wader and wildfowl species. 1.4
Methods
1.4.1 Coverage of species and sites The WeBS Alert system is suitable for most species whose populations are regularly indexed by WeBS, given the caveat about coverage discussed previously. Thirty-six such common waterbird species were run through the process. Species such as Pink-footed Goose, Barnacle Goose, Icelandic Greylag Goose and Greenland White-fronted Goose are not fully covered by WeBS and numbers are regularly censused using co-ordinated goose counts, rather than regular WeBS counts. It may be possible to incorporate these data into an Alert system in future. Of the waders, Lapwing, Golden Plover and Purple Sandpiper are common species but not regularly indexed, as WeBS covers only a small part of their population. Most Lapwing and Golden Plover occur inland and are not censused well by WeBS although data from some sites of international importance are collected and could be included in the future. Purple Sandpiper tend to occur on rocky rather than estuarine shores and, again, the numbers sampled through WeBS are not representative of the whole population. Although these data were not available for this report, they could be included in any future waterbird alert system if the data could be made readily available. The coverage of counts also varies between countries (Table 1.3). The main difference is that although for waders UK indices can be calculated, wildfowl counts only started in 1986 in Northern Ireland. For the purposes of this report, therefore, when we refer to the UK for wildfowl this includes just England, Scotland and Wales. Northern Ireland is treated separately. Over 90% of estuaries are counted each month and for strictly estuarine species one can expect a near 100% coverage. For species which also occur on non-estuarine coasts, such as Turnstone, Ringed Plover, Sanderling and Curlew the coverage will be lower and the alerts BTO Research Report No. 239 March 2000
10
generated should be thought of as an alert for the proportion that use WeBS sites rather than for the population as a whole. 1.4.2 Calculation of Underhill indices For each species, there are a recommended series of months which are used to index that population (Cranswick et al. 1998). These are December, January and February for waders but different months are used for wildfowl, ranging between one to seven months for each species (Table 1.2). Indices are calculated by summing the number of ‘bird months’ and scaling the last year to 100. Missing counts are inevitable with this kind of data and these are estimated using the Underhill method (Underhill & Prys-Jones 1994). At the base of this method is a General Linear Model (GLM) with a Poisson error distribution and log link function, which fits a model with site, year and months factors. Where missing counts occur, they are estimated using the parameters calculated in the GLM. At the site level it may be more appropriate to use different periods of months but for this first analysis, standard Underhill months have been used. 1.4.3 Smoothing indices using GAMs The development of an alert system for waterbird species recommended smoothing the monthly counts using General Additive Models rather than other methods which use a running mean (Gregory et al. 2000). Data were extracted from the WeBS database and the Fortran program GAIM used to smooth the count data. The amount of smoothing is determined by the number of degrees of freedom associated with the year parameter. Minimum degrees of freedom constrains the fit to a linear line and maximum (number of years minus 1) fits an unconstrained model similar to a log-linear Poisson regression which is used in the Underhill method. For the purposes of WeBS data, a moderate degree of smoothing of 0.3 times the number of years was tested and found to provide an acceptable degree of smoothing (Atkinson & Rehfisch 2000). 1.4.4 Assessment of change and calculation of Alerts Alerts are generated by assessing the percentage change in the population over several different time periods. In this report we calculate change over 5, 10 & 25 year periods. We also calculate change over the entire time period for which data are available. Alerts are triggered if the change exceeds 25% (a positive or negative 25% Alert) or 50% (a positive or negative 50% Alert.). It is important to note both large increases (positive Alerts) as well as large decreases (negative Alerts) but in this report we only report in any detail on declining species. The percentage change is calculated in two different ways. In the Underhill method, a smoothed 3-year mean is used to assess change over the different time periods. This is illustrated with a worked example in Box 1.1. The GAM method is slightly more straightforward in that the percentage change in the population is simply the change in the smoothed index between years; see worked example in Box 1.2. For this report we present Alerts calculated using both methods. Whilst we only report on the GAMs, we note where differences occur. For the first year of implementation, it was agreed by the Alerts Technical Panel to run Alerts using both methods. It is envisaged that in future years only one method will be used.
BTO Research Report No. 239 March 2000
11
The term 5-year change can be misleading. In this report we define this as the change over five separate time periods, e.g. the change from the index for the winter of 1993/94 to the winter of 1998/99. This includes six winters worth of data but five separate time periods. For country and national alerts, bootstrapped confidence intervals can be calculated. To obtain 95% confidence intervals the program GAIM can bootstrap the count data many times to produce many different smoothed trajectories. Confidence intervals can then be placed around the smoothed trajectory. Five, ten and 25 year changes can be calculated from all of these, and 95% confidence intervals calculated. For an Alert to be significant, then the upper 95% CI would have to be below zero indicating a significant negative change over that time period. However, for WeBS data it is unclear as to exactly what the intervals relating to the smoothed trajectory relate to. If the sample of WeBS sites was a truly random sample then these intervals would indeed indicate the confidence limits around the changes in the population.. However, as in the case of strictly estuarine waders, the WeBS counts do not represent a random sample, rather an almost-complete census. In this case, the 95% intervals represent ‘Consistency Intervals’ (Underhill & Prys Jones 1994). These indicate how patchily distributed the population is. For example, if the same numbers of birds were recorded at each site at the start of the time period, and they varied from year to year in the same way, the consistency interval would be zero indicating that the population was evenly spread, and changed at the same rate across all sites. If, however the bulk of the population occurred on a small number of sites and the majority of sites held zero or low numbers of birds then the consistency interval would be high. These intervals would not tell you anything about the confidence in population trajectory itself as, with 100% coverage in your survey, you have sampled the entire population and any changes calculated would be absolute. To understand the confidence in the counts then some attempt to estimate error in counting (e.g. observer or site specific errors) would have to be made. Inevitably, WeBS counts fall somewhere in the middle. For estuarine species, a near 100% coverage is achieved but for rocky shore species this will be less. For inland species we have little idea as to how representative WeBS is, but most of the major sites of importance are covered. In this report, we have bootstrapped change measures using 199 bootstraps. For each of the country chapters we note where these confidence/consistency intervals indicate that the change is not significantly below zero; for others assume it is significant. However, for countries with relatively few WeBS sites, such as Northern Ireland and Wales, these 95% intervals may, especially for highly variable species, be large and not significantly below zero. This may not invalidate the Alerts, is as discussed above if the majority of important sites for that species are covered. Therefore intervals should be advisory and interpreted with knowledge of the species and sites concerned. They should not necessarily be taken to mean that the Alert is not significant. 1.4.5 SPA Site Alerts – species and site coverage In this report we assess population change and raise alerts for species which occur in nationally or internationally important numbers on SPAs in each country. The complete list of SPAs was supplied by JNCC (on behalf of country agencies) and includes many nonWeBS species as well as sites which are not covered by the WeBS scheme. Where possible, data for each site were extracted, smoothed using the GAM method and population and Alerts calculated in the usual manner. No bootstrapping is possible in this case. BTO Research Report No. 239 12 March 2000
The sites used in these analyses are those that are currently used to calculate the national waterbird indices. These ‘core’ sites are those which have been counted on more then 50% of available occasions. If a site was not counted on more than 50% of occasions we did not perform any analysis because of the amount of time needed to extract the data from the WeBS database. This will hopefully be remedied in the future with the new database and sites which have been counted on less than 50% of occasions can be included. A measure of coverage was calculated for each country using the number of species/site combinations which were successfully run through the Alert System. Several caveats need to be borne in mind when interpreting these analyses. WeBS sites tend to be made up from counts taken from a number of sectors which are amalgamated to form a total count for that site. For this analysis we did not have access to the site boundaries for the SPAs and so had to make a ‘best guess’ attempt to match up SPAs and WeBS sites. This worked reasonably well so far as we know for most sites but there are a few known problems:
There may be no WeBS data for a particular SPA
WeBS sites may not match up exactly with SPA boundaries.
Birds which use SPAs may roost outside the SPA boundaries where they are counted by WeBS. For example, on the Wash many waders roost in fields behind the sea-wall which are not part of the SPA. Most of the WeBS counts therefore technically include birds not in the SPA, but which obviously made use of it at low tide
Some WeBS sites may cover more than one SPA, e.g. the Wash WeBS area covers both the Wash and Gibraltar Point SPAs and with the current amalgamation of data can not be separated.
The full extent of the coverage of sites and species in each country are given in the relevant country chapters. For English and Scottish SPAs we have attempted to show how consistent population change is between species within a site. This will identify those sites where there is a general decrease or increase in waterbird populations and also allow a comparison to be made between sites. As an initial approach to this we scored a 50% negative Alert as –2, a 25% negative Alert as –1, a 25% positive Alert as +1, a 50% positive Alert as +2. Where no Alert scored zero. These were added together for each site to form an index of change for a site. A negative value indicates that there is a general decline across species on that site, a zero value that either species are stable or that an equal number are going up as well as down and a positive value indicates that there is a general increase in the waterbird population. 1.5
Interpretation of Numbers and Alerts
1.5.1 Units of abundance Two units of abundance are used in the WeBS scheme and it is important to distinguish between them. In the WeBS reports, indices are traditionally calculated by totalling up the number of ‘bird months’ and scaling the resulting data so that the first or last year is equal to 100. This is termed the index of abundance. BTO Research Report No. 239 March 2000
13
When considering whether a site is nationally or internationally important or not for a particular species, yearly maxima are traditionally presented in the WeBS report for all sites where the 5-yearly mean of the maxima exceeds the relevant national or international total. In this report we do not use changes in count maxima to evaluate site, country or national Alerts, rather we use the average number of birds recorded per month. This is calculated in a similar way to the Underhill index but instead of scaling the total number of bird months so that either the first or last year equals 100, this figure is divided through by the number of months over which the species is traditionally recorded. Example 1: Calculating the average number of birds per month Coot are traditionally indexed over 7 months in NI – September to March
Actual Imputed
Sep 1,800
Oct 4,950
Nov 3,450
Dec 1,250
Feb 550
Mar 343
April 103
TOTAL 8,996
The example above shows a series of counts of Coot at a site. The December count is missing and so the count is imputed using the standard Underhill method. The total number of bird months is the sum of all counts for that year. These are added together for all sites and this, when scaled so that the last year equals 100, is used as the basis of the national index. This value equals 8,996 so the average number of birds per month is this figure divided by 7 (the number of months). This equals 1,285 birds. It is this figure, rather than the maximum of 4,950 birds in October, that is used when considering changes in the population and raising alerts for the site. Clearly, this may lead to some apparent discrepancy between SPA citations which are based on maxima and the average number of birds present per month. If a species occurs in large numbers on a site for one month only, the average of the five yearly maxima, which are used to determine national or international site importance, may indicate a site is important whereas the average numbers of birds per month may be very small. This is especially true for species such as Bewick’s and Whooper Swan which can appear in large numbers on some sites (e.g. the Wash) for one or two months in a five-year period. This has resulted in them being cited for this SPA even though the site does not hold a regular wintering population of any importance. The Alert system is not suitable for this situation. 1.5.2 Interpretation of Alerts Alerts are raised when the percentage change in a population exceeds certain limits. Here we use 25 and 50% changes over 5, 10, 25 and all years for which counts are available. This allows change in the population to be classified according to the criteria in the table below. Thus a change of –34% over a 10 year period would be classed as a moderate decline over the medium term etc. These terms are used throughout this report.
BTO Research Report No. 239 March 2000
14
Type of Alert When used Direction Code used in this report Description of change
Time Period Description
50% Decline greater than 50% Negative
25% Decline between 25% and 50% Negative
25% 50% Increase of between Increase of greater than 25 and 50% 50% Positive Positive
--
-
+
++
large decline or HIGH ALERT
moderate decline or MEDIUM ALERT
moderate increase
large increase
5 year short-term
10 year medium-term
25 year long-term
All years all years
The Alerts are presented in a similar manner to the example for Little Grebe below. Data are presented from left to right starting with the codes for the 5,10, 25 and all year Alerts. The figures following are the actual percentage change in the population over similar time periods. The next two figures are presented for site alerts only and correspond to the first and last years that counts took place. For national and country alerts these are stated in Table 1.3. The species name and site then follow. 5-yr ++
10-yr ++
25-yr N/A
All ++
5-yr 155
10-yr 381
25-yr N/A
All 294
Start 85
End 97
Species Little Grebe
In some cases, the Alert over all years should also be treated with caution as count quality and coverage may have been poor in the early years of the precursors to WeBS. Two codes are used in the Alert tables: n/a
this refers to Alerts where data are not available for a particular year and so it is not possible to calculate that Alert. In the example above, Little Grebe were not counted until 1985/96 in Great Britain and so a 25 year Alert is not possible.
>1000
this refers to percentage changes that were calculated to be over 1,000%. This is a result of either an infinite change (i.e. a change from zero birds to at least 1 bird) or a very large change which is generated by the GAIM or Underhill programs allocating a very small value (e.g. 0.00001) to a zero value. If the number of birds were to increase from this value then the apparent change would be very large. In most cases this does not make sense and so all changes greater than this have been coded ‘>1000’.
BTO Research Report No. 239 March 2000
15
Table 1.1
Wader and wildfowl species or populations which are regularly indexed as part of the Wetland Bird Survey and to which an alert system can be applied. Countries refer to the countries for which data are available. E = England, S= Scotland, W= Wales, NI= Northern Ireland. Species which have no country code allocated are those which are regularly indexed, but using co-ordinated goose counts rather than regular WeBS counts. These currently fall outside the Alert system.
Species Little Grebe Great Crested Grebe Cormorant Mute Swan Bewick’s Swan Whooper Swan Pink-footed Goose European White-fronted Goose Greenland White-fronted Goose Greylag Goose - Icelandic Greylag Goose - naturalised Canada Goose Barnacle Goose - Svalbard Dark-bellied Brent Goose Light-bellied Brent Goose - Canadian Shelduck Wigeon Gadwall Teal Mallard Pintail Shoveler Pochard Tufted Duck Goldeneye Red-breasted Merganser Goosander Ruddy Duck Coot
BTO Research Report No. 239 March 2000
Countries Tachybaptus ruficollis Podiceps cristatus Phalacrocorax carbo Cygnus olor Cygnus columbianus Cygnus cygnus Anser brachyrhynchus Anser albifrons albifrons Anser albifrons flavirostris Anser anser Anser anser Branta canadensis Branta leucopsis Branta bernicla bernicla Branta bernicla hrota Tadorna tadorna Anas penelope Anas strepera Anas crecca Anas platyrhynchos Anas acuta Anas clypeata Aythya ferina Aythya fuligula Bucephala clangula Mergus serrator Mergus merganser Oxyura jamaicensis Fulica atra
16
E,S,W,NI E,S,W,NI E,S,W,NI E,S,W,NI E,S,W,NI E,S,W,NI E,S,W
E,S,W E,S,W NI E,S,W,NI NI E,S,W,NI E,S,W,NI E,S,W,NI E,S,W,NI E,S,W,NI E,S,W,NI E,S,W,NI E,S,W,NI E,S,W,NI E,S,W,NI E,S,W,NI E,S,W E,S,W E,S,W,NI
Species Oystercatcher Avocet Ringed Plover Grey Plover Knot Sanderling Dunlin Black-tailed Godwit Bar-tailed Godwit Curlew Redshank Turnstone
Table 1.1
Countries Haematopus ostralegus Recurvirostra avosetta Charadrius hiaticula Pluvialis squatarola Calidris canutus Calidris alba Calidris alpina Limosa limosa Limosa lapponica Numenius arquata Tringa totanus Arenaria interpres
Continued.
BTO Research Report No. 239 March 2000
17
E,S,W,NI E,S,W,NI E,S,W,NI E,S,W,NI E,S,W,NI E,S,W,NI E,S,W,NI E,S,W,NI E,S,W,NI E,S,W,NI E,S,W,NI E,S,W,NI
Table 1.2
Species to which the WeBS Alert system has been applied to and the months used in calculating indices for wildfowl species in Great Britain and Northern Ireland (indicated using the first letters of the months September to March).
Species
GB
Little Grebe Great Crested Grebe Cormorant Mute Swan Bewick`s Swan Whooper Swan European White-fronted Goose Feral Greylag Goose Canada Goose Dark-bellied Brent Goose Light-bellied Brent Goose Shelduck Wigeon Gadwall Teal Mallard Pintail Shoveler Pochard Tufted Duck Goldeneye Red-breasted Merganser Goosander Ruddy Duck Coot Oystercatcher Avocet Ringed Plover Grey Plover Knot Sanderling Dunlin Black-tailed Godwit Bar-tailed Godwit Curlew Redshank Turnstone
BTO Research Report No. 239 March 2000
NI SO SON SONDJFM SONDJFM JF ND JF S S DJF JF J SONDJFM DJF DJF ONDJ SO NDJ NDJF F ONDJFM DJF SONDJFM SONDJ DJF DJF DJF DJF DJF DJF DJF DJF DJF DJF DJF DJF
18
SON SONDJFM SOND SONDJ NDJF ONDJFM
SONDJFM DJFM SONDJFM SONDJ DJ SO ONDJFM SONDJFM NDJF ONDJFM DJFM SONDJFM
SONDJFM DJF DJF DJF DJF DJF DJF DJF DJF DJF DJF DJF DJF
Table 1.3
Table describing the first winter in which waterbird counts occurred for species, or groups of species in each country.
Area
Waders Wildfowl Cormorant Little Grebe
England, Scotland & Wales Northern Ireland
1969/70 1966/67 1970/71 1986/87
BTO Research Report No. 239 March 2000
19
1986/87 1986/87
1985/86 1986/87
Great Crested Grebe 1982/83 1986/87
Coot 1982/83 1986/87
Box 1.1
Worked example of raising alerts using the Underhill Alert process
Process: 1. Run Underhill program and extract yearly indices 2. Work out 3-year averages for the index from current year as in 97/98 example below for current time period, 5, 10 and 25 years ago. 3. Work out percentage change over each time period and use this as your ‘alert’ figure. Alert type
25 year
10 year
5 year
Current year
Year
Index
1970 1971 1972 1973 1974 1975 1976 1977 1978 1979 1980 1981 1982 1983 1984 1985 1986 1987 1988 1989 1990 1991 1992 1993 1994 1995 1996 1997
100 86.5 72.4 129.6 82.4 79.6 185.4 193.2 499.6 350 246.3 238.2 213.3 168 232.7 288.9 350.4 305.1 223.2 293.3 427.7 300.3 332.2 210.5 288.3 418.5 520.8 472.5
3-year average
86.3
314.8
353.4
470.6
Therefore a 5-year alert will be: (470.6 – 353.4) / 353.4 = 33.2%
BTO Research Report No. 239 March 2000
25% POSITIVE ALERT TRIGGERED
20
Box 1.2
Worked example of raising alerts using the General Additive Model (GAM) process
Process: 1. Smooth WeBS data using the program GAIM 2. Take value for current year and also those for 5, 10 and 25 years ago and calculate change. This is the ‘population change’ which is used to raise 25% or 50% alerts. Alert type
25 year
10 year
5 year
Year
Index
1970 1971 1972 1973 1974 1975 1976 1977 1978 1979 1980 1981 1982 1983 1984 1985 1986 1987 1988 1989 1990 1991 1992 1993 1994 1995 1996 1997
100 101 105 113 127 153 199 262 322 342 327 302 283 282 300 326 348 351 348 359 370 357 333 322 354 423 511 590
5- YEAR ALERT: (590 – 333) / 333 = 77%
BTO Research Report No. 239 March 2000
Index value
105
351
333
590
50% ALERT TRIGGERED
21
2. 2.1
UNITED KINGDOM – WATERBIRD POPULATION CHANGES AND ALERTS Population Change and Alerts
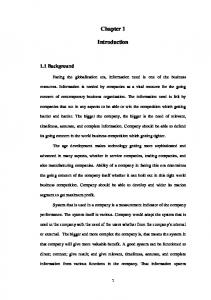
Figure 2.1 shows the change in numbers of all regularly indexed wader species in the United Kingdom and wildfowl in England, Scotland and Wales combined. Table 2.1 shows the percentage population change over 5, 10, 25 and all year periods and the Alerts generated using both GAM and Underhill methods.
No species have generated a negative 50% Alert using the GAM method.
European White-fronted Goose, Mallard, Knot and Turnstone have generated a negative 25% Alert using the GAM method.
Using the Underhill technique, no other species triggered Alerts.
All other species are stable or increasing (mostly increasing).
2.2
Species Generating a 50% Alert Using GAMs
At a national level, no waterbird species that are regularly indexed using the WeBS scheme have generated a negative 50% Alert. 2.3
Species Generating a 25% Alert Using GAMs
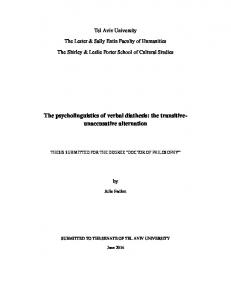
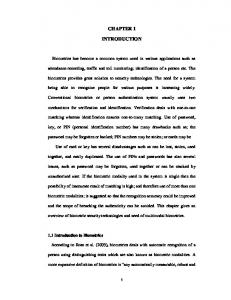
European White-fronted Goose This species generated a 25% Alert over all years and a 25% Alert over the last 10 year period, indicating a moderate decline over the medium and long-term. These birds are restricted to England and Wales and numbers have shown an increase followed by a decrease. In 1966/67, approximately 4,000 birds were recorded in the UK, 800 of which were in Wales. The number of birds in Wales almost doubled in size to 1,500 and this together with an even larger increase in England increased the total number of birds in the UK to over 10,000 in 1969/70. After this winter a large decline took place and by the mid-1970s numbers had returned to their former levels. The English population has been approximately 5,000 birds ever since and is now stable or declining slightly. The Welsh population, concentrated around the Dryslwyn area of the River Tywi continued to decline and by the late 1980s this population went to extinction. Mallard Mallard raised a 25% Alert over the past 10 years indicating a moderate, medium-term decline. Mallard are one of the most widespread ducks in the United Kingdom and it is not known how representative WeBS sites are for this species. Many are also released every year by wildfowling interests. Nevertheless, Mallard are one of the few ducks that are declining. Numbers on WeBS sites increased slightly from 110,000 birds at the start of counts in 1966/67 to 150,000 birds in the mid-1980s but then declined. Since 1987/88, there has been a highly significant decline at the rate of c4,800 birds per year although the graph suggests that the rate of decline is slowing. Knot Knot raised a 25% Alert when considering change over all years indicating a moderate decline (41%) since the start of the WeBS counts. The graph for Knot, shows a decline in numbers from c350,000 birds at the start of counts to c200,000 birds in the mid-1970s followed by a period of stability which has continued to the present day. The reasons for the large decline are probably due, in part, to increased spring mortality of adult Knot returning to their Greenland breeding areas in the early 1970s (Boyd 1992). The springs and summers of 1972, 1974 and 1979 were particularly cold and caused many adult deaths. This coupled with poor breeding success, in 1972 and 1974 are believed to have caused a large population decline. The wintering population does not seem to have recovered since, but is now apparently stable. Turnstone Turnstone triggered a 25% Alert over the past 10 years indicating a moderate, medium-term decline. Numbers increased in the UK from 1960/70 to a peak of 20,000 in the mid-1980s. Since then, there has been a steady BTO Research Report No. 239 March 2000
22
decline in numbers to slightly under 15,000 birds. The rate of decline has been lower in the last four winters of counts.
BTO Research Report No. 239 March 2000
23
BTO Research Report No. 239
March 2000
Table 2.1
Percentage change and Alerts over 5,10, 25 and all years of counts. For interpretation of symbols see section 1.6. Population size refers to the average number of birds per month recorded on the WeBS sites used. ALERTS CALCULATED USING GAMS
5-yr
n/a
10-yr ++ + n/a
+ ++
++
+
+ ++
25-yr n/a n/a n/a n/a ++ ++ ++ ++ ++ + ++ ++ ++
All ++ ++ ++ n/a ++ ++ ++ ++ ++ ++ ++ ++ ++
+
++ ++
-
24 ++
++
++
++
++ ++ ++ n/a + ++ ++
+ +
++
++
++ ++ ++ ++ ++ + ++ ++ + + ++ ++ ++
BTO Research Report No. 239 March 2000
5-yr 11 -2 -8 n/a 4 34 -5 52 14 -24 -15 5 46 10 -12 10 -1 -3 7 2 -8 15 53 5 0 69 -13 -6 -6 28 -4 37 14 1 5 -17
10-yr 98 20 35 n/a -3 7 -36 120 16 -17 -13 31 81 19 -29 -10 1 -2 7 22 7 -7 70 10 -12 322 -23 14 -13 16 6 91 0 9 -2 -32
25-yr n/a n/a n/a n/a 221 105 7 >1000 300 149 28 94 788 150 -15 21 34 -19 2 24 134 56 >1000 n/a 26 >1000 -20 259 -21 0 -23 221 7 22 2 -7
ALERTS CALCULATED USING UNDERHILL METHOD
UNITED KINGDOM
All 411 55 141 n/a 300 147 -30 >1000 683 393 85 91 >1000 371 -23 321 99 -8 57 105 318 172 >1000 18 33 >1000 20 596 -41 47 31 832 -11 104 71 11
Species Little Grebe Great Crested Grebe Cormorant Mute Swan Bewick`s Swan Whooper Swan European White-fronted Goose Feral Greylag Goose Canada Goose Dark-bellied Brent Goose Shelduck Wigeon Gadwall Teal Mallard Pintail Shoveler Pochard Tufted Duck Goldeneye Red-breasted Merganser Goosander Ruddy Duck Coot Oystercatcher Avocet Ringed Plover Grey Plover Knot Sanderling Dunlin Black-tailed Godwit Bar-tailed Godwit Curlew Redshank Turnstone
24
5yr 33 -1 4 20 -6 32 -5 61 13 -23 -9 14 54 9 -16 3 9 -2 6 10 8 46 46 9 2 68 -13 11 -5 26 4 45 28 -1 4 -21
10yr 144 32 78 48 2 15 -34 120 13 -8 -5 29 83 36 -33 -5 15 -8 2 32 2 0 65 11 -7 397 -19 34 -6 15 27 119 6 8 -1 -31
25yr n/a n/a n/a 90 249 98 5 >1000 302 203 44 98 783 163 -14 39 38 -15 5 35 174 98 >1000 n/a 39 >1000 -8 361 -27 9 -11 263 15 30 5 -6
All 314 40 78 92 306 163 -43 >1000 585 488 100 98 >1000 339 -20 225 83 0 52 106 238 198 >1000 13 39 >1000 8 470 -33 29 17 551 7 57 34 1
5yr +
10yr ++ + ++ +
+ ++
++
++
+ ++ + -
+ + +
++
++
++ +
25yr n/a n/a n/a ++ ++ ++ ++ ++ ++ + ++ ++ ++
All ++ + ++ ++ ++ ++ ++ ++ ++ ++ ++ ++ ++
+ +
++ ++
+ ++ ++ ++ n/a + ++
++ ++ ++ ++ ++ + ++
++ -
++ -
++
++
+
++ +
+ + +
+ ++
-
Average Pop size 1998 2,500 8,500 12,000 13,000 5,500 3,500 3,000 74,500 30,000 71,500 56,500 310,500 8,000 110,000 101,500 21,500 6,000 33,000 43,000 6,500 2,500 2,500 3,000 92,000 233,500 3,500 8,500 40,500 211,500 7,000 449,000 11,500 47,000 74,000 79,500 14,000
3,500
Little Grebe
Number of birds
2,500 2,000 1,500 1,000 500
1965
10,000 9,000 8,000 7,000 6,000 5,000 4,000 3,000 2,000 1,000
1970
1975
1980 1985 Years
1990
1995
2000
1965
1995
2000
Number of birds
Number of birds
6,000 4,000 2,000
1970
1975
1980 1985 Years
1990
1995
1965
2000
1970
1975
1980
1985
1990
1995
2000
Years
80,000
Cormorant
Feral Greylag Goose
70,000 60,000
Number of birds
50,000 40,000
8,000
30,000
6,000
20,000
4,000
10,000
2,000
1965
1970
1975
1980 1985 Years
1990
1995
1965
2000
1970
Mute Swan
35,000
Number of birds
1975
1980 1985 Years
1990
1995
2000
Canada Goose
30,000 25,000
10,000
Number of birds
1990
8,000
10,000
12,000
1980 1985 Years
European White-fronted Goose
12,000
14,000
1975
10,000
16,000 14,000
1970
12,000
Great Crested Grebe
1965
Number of birds
Whooper Swan
4500 4000 3500 3000 2500 2000 1500 1000 500 0
Number of birds
3,000
20,000
8,000
15,000 10,000
6,000
5,000
4,000 1965 1970 1975 1980 1985 1990 1995 2000 Years
2,000
1965
1970
1975
1980 1985 Years
1990
1995
2000
8,000 7,000
140,000
Bewick's Swan
120,000 Number of birds
Number of birds
6,000
Dark-bellied Brent Goose
100,000
5,000 4,000 3,000 2,000
80,000 60,000 40,000 20,000
1,000 0 1965
Figure 2.1
1970
1975
1980 1985 Years
1990
1995
2000
1965
1970
1975
1980 1985 Years
1990
1995
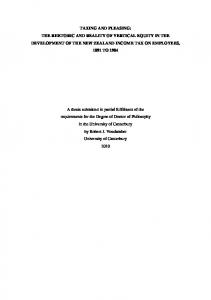
United Kingdom waterbird Underhill and smoothed GAM counts for regularly indexed wildfowl species. Units refer to the average number of birds counted per standard index month (see Table 1.2 for standard months).
BTO Research Report No. 239 March 2000
25
2000
30,000
Shelduck
Number of birds
Number of birds
90,000 80,000 70,000 60,000 50,000 40,000 30,000 20,000 10,000
Pintail
25,000 20,000 15,000 10,000 5,000
1965
1970
1975
1980
1985
1990
1995
2000
1965
1970
1975
Years
400,000
Number of birds
Number of birds
300,000 250,000 200,000 150,000 100,000 50,000 1965 1970 1975 1980 1985 1990 1995 2000
9,000 8,000 7,000 6,000 5,000 4,000 3,000 2,000 1,000
1965
Number of birds
Number of birds 1970
1975
1980
1985
1970
1975
1990
1995
45,000 40,000 35,000 30,000 25,000 20,000 15,000 10,000 5,000
1965
2000
Teal
Number of birds
Number of birds
100,000 80,000 60,000 40,000 20,000
50,000 45,000 40,000 35,000 30,000 25,000 20,000 15,000 10,000 5,000
1965 1970 1975 1980 1985 1990 1995 2000
1970 1975
1965
Number of birds
Number of birds
1990
1995
2000
1980
1985
1990 1995
2000
1970
1975
1980
1985
1990
1995
2000
1990
1995
2000
Years
Mallard
1965 1970 1975 1980 1985 1990 1995 2000
9,000 8,000 7,000 6,000 5,000 4,000 3,000 2,000 1,000
Goldeneye
1965
Years
1970
1975
1980
1985
Years
Continued.
BTO Research Report No. 239 March 2000
1985
Tufted Duck
Years
Figure 2.1
1980
Years
120,000
180,000 160,000 140,000 120,000 100,000 80,000 60,000 40,000 20,000
2000
Pochard
Years
140,000
1995
Years
Gadwall
1965
1990
Shoveler
Years
9,000 8,000 7,000 6,000 5,000 4,000 3,000 2,000 1,000
1985
Years
Wigeon
350,000
1980
26
Number of birds
3,500
3,500
Red-breasted Merganser
Ruddy Duck
3,000
Number of birds
4,000 3,000 2,500 2,000 1,500 1,000
2,500 2,000 1,500 1,000 500
500 1965
1970
1975
1980
1985
1990
1995
2000
1965
1970
4,500 4,000 3,500 3,000 2,500 2,000 1,500 1,000 500
Goosander
1965
1970
1975
1980
1985
1990
1995
1985
100,000 90,000 80,000 70,000 60,000 50,000 40,000 30,000 20,000 10,000
1990
1995
2000
Coot
Years
Continued.
BTO Research Report No. 239 March 2000
1980
1965 1970 1975 1980 1985 1990 1995 2000
2000
Years
Figure 2.1
1975
Years
Number of birds
Number of birds
Years
27
700,000
Oystercatcher
Dunlin
600,000
250,000
Number of birds
Number of birds
300,000
200,000 150,000 100,000 50,000
500,000 400,000 300,000 200,000 100,000
0 1965 1970 1975 1980 1985 1990 1995 2000
0 1965 1970 1975 1980 1985 1990 1995 2000
Years 4,000 3,500
Black-tailed Godwit
12,000
Number of birds
Number of birds
Years 14,000
Avocet
3,000 2,500 2,000 1,500 1,000
10,000 8,000 6,000 4,000 2,000
500 0 1965
1970
1975
1980
1985
1990
1995
0 1965
2000
1970
1975
Years 14,000
80,000
Ringed Plover
70,000
Number of birds
Number of birds
10,000 8,000 6,000 4,000 2,000 1970
1975
1980
1985
1990
1995
2000
1990
1995
2000
60,000 50,000 40,000 30,000 20,000 0 1965
2000
1970
1975
1980
1985
Years
2000
100,000 Curlew 90,000 80,000 70,000 60,000 50,000 40,000 30,000 20,000 10,000 0 1965 1970 1975 1980 1985 1990 1995 2000
0 1965 1970 1975 1980 1985 1990 1995 2000
100,000 Redshank 90,000 80,000 70,000 60,000 50,000 40,000 30,000 20,000 10,000 0 1965 1970 1975 1980 1985 1990 1995 2000
Grey Plover
50,000
Number of birds
Number of birds
1995
Bar-tailed Godwit
Years
40,000 30,000 20,000 10,000 0 1965
1970
1975
1980
1985
1990
1995
Years 350,000
Years
Knot
Number of birds
400,000
Number of birds
1990
10,000
0 1965
300,000 250,000 200,000 150,000 100,000 50,000
Years
9,000 Sanderling 8,000 7,000 6,000 5,000 4,000 3,000 2,000 1,000 0 1965 1970 1975
Years
25,000
Number of birds
Number of birds
1985
Years
12,000
60,000
1980
1980
1985
1990
1995
10,000 5,000
1970
1975
1980
1985
Years
Continued.
BTO Research Report No. 239 March 2000
15,000
0 1965
2000
Years
Figure 2.1
Turnstone
20,000
28
1990
1995
2000
3.
ENGLAND
3.1
Population Change and Alerts
Figure 3.1 shows the change in numbers of all regularly indexed waterbird species in England. Table 3.1 shows Alerts and population change calculated using both Underhill and GAM methods for all of these species over 5, 10, 25 and all years. Figures 3.2 (a-c) shows the cumulative change in individual sites over 5, 10 and 25 year periods.
No species have generated a negative 50% Alert using the GAM method.
European White-fronted Goose, Mallard, Knot and Turnstone generated a negative 25% Alert using the GAM method. Using 199 bootstraps, the change was significantly below zero for all Alerts.
Using the Underhill technique the following differences occurred: the Alert for European White-fronted Goose was elevated to a 50% Alert and Shelduck and Dark-bellied Brent Goose generated a 25% Alert.
All other species are stable or increasing (mostly increasing).
3.2
Coverage of SPAs in England by the Waterbird Alert System
In England, coverage of SPAs is reasonably high. For the species for which data were potentially available (i.e. regularly indexed species), 461 of the 530 relevant species/site citations (85%) are covered by the Waterbird Alert System (Tables 3.2 & 3.3). For the remaining 15%, it may be possible to run Alerts in future as, currently, sites such as Old Hall Marshes and Gibraltar Point are included in the Blackwater and Wash WeBS sites respectively. Further development work would be required to determine which of the sectors of the WeBS sites correspond to each SPA. Some SPAs such as Broadland and the Lower Derwent Valley are covered by more than one WeBS site and further development work would be required to decide which sites are representative of the SPA and therefore should be included in the Alert system. Other sites which are currently included in WeBS may not be included in the set of counts used to produce the national index and it may be possible to include them in the site alert system, but on a shorter term basis (i.e. 5 or 10 year periods). A further 128 species/site combinations of SPA citations were requested but data were not available (Table 3.3) as these were species which are not regularly indexed by WeBS. However, many of the sites involved are regularly counted and so the count data would be contained in the overall WeBS database. If they were to be included in the Waterbird Alert System in future a mechanism would have to be devised to readily extract these data in an accessible form. Overall, coverage was 70% of all species/site combinations.
BTO Research Report No. 239 March 2000
29
3.3
Species Generating a 50% Alert using GAMs
In England, no waterbird species that are regularly indexed using the WeBS scheme have generated a 50% Alert. 3.4
Species Generating a 25% Alert using GAMs
European White-fronted Goose GB Situation: Stable The White-fronted Goose triggered a 25% Alert over a 10 year period indicating a moderate, medium-term decline. Numbers decreased from the late 1960s to the early 1970s, followed by an increase to the late 1980s and then decreased to the current count in 1998/99. The recent decline, which has been ongoing since 1987/88 triggered a 10 year 25% Alert.
Mallard
GB Situation: Slight recent decrease
Mallard triggered a 25% Alert over a 10 year period indicating a moderate medium-term decline. The smoothed Mallard trajectory increased slightly from 86,000 at the start of counts to 110,000 birds in 1987/88. Thereafter, numbers have declined consistently to the current level of 76,000 birds which represents the lowest smooth count. The decline over the last 10 years has been sufficient to trigger a 25% 10 year Alert. A similar pattern of change has occurred in Scotland.
Knot
UK Situation: Decrease followed by Stability
Knot triggered a 25% Alert over all years considered indicating a moderate dlong-term decline. Numbers underwent a sharp decline in the early 1970s which has been attributed to increased mortality in the breeding areas. Numbers have not recovered since (although now stable), thus triggering an Alert over all years. See UK account for further details.
Turnstone
National Situation: Increase followed by decrease
Turnstone have undergone a recent decline in England, after a slight increase, thus triggering a 25% Alert over 10 years indicating a moderate medium-term decline. The changes, which are closely mirrored by the Scottish population, increased from 8,000 birds at the start of counts to a peak of 12,000 birds in the mid 1980s. Since then there was a decline to 8,500 in 1995/96 and numbers have remained at this level over the following three winters. 3.5
Site Alerts – SPAs in England
For Site Alerts, only 50% negative Alerts using the GAM method are discussed. Cited species refer only to those species which are currently treated under the current Waterbird Alert System. The Alerts for all years should be treated with caution as, at the start of waterbird counts, coverage at some sites may have been poor. Abberton Reservoir Cited species: Great Crested Grebe, Cormorant, Mute Swan, Wigeon, Gadwall, Teal, Pintail, Shoveler, Pochard, Tufted Duck, Goldeneye and Coot 50% Alerts: Wigeon and Coot
Wigeon numbers at Abberton Reservoir peaked in 1978/79 at 11,500 birds and were around 10,000 birds in the winters of 1985/86 and 1986/87. Ten and 25 year Alerts have been triggered due to the decline in numbers since 1980, although in the final five years, numbers have stabilised. It should be noted that recent numbers are not appreciably lower than those in the twelve winters prior to 1978/79. Numbers are currently in the order of 1,500-2,000 birds. Coot numbers have fluctuated greatly between years at Abberton. Five and 10 year Alerts occurred due to recent declines since very large peaks in 1988/89 and 1993/94, when over 10,000 and 9,500 birds were recorded respectively. Current counts are in the order of 2,000-4,000 birds and not appreciably different from the counts at the start of counts. All other species cited have increased or were stable over the years considered. Alde-Ore Estuary Cited species: European White-fronted Goose, Shelduck, Wigeon, Teal, Shoveler, Avocet, Dunlin, Black-tailed Godwit and Redshank BTO Research Report No. 239 March 2000
30
50% Alert: Shoveler Shoveler were in long-term decline on the Alde-Ore estuary from an average of 60 birds in the early 1970s to less than 5 in 1994/95. There has been a recovery to 30-40 birds in the last 3 winters. Numbers have fluctuated over the count period with a peak of 131 birds in 1987/88 but these inter-annual variations di not mask this overall long term trend. Numbers of all other species cited have increased in the years considered. Alt Estuary Cited species: Knot, Sanderling, Bar-tailed Godwit 50% Alert: Knot The Knot recorded by WeBS counts on the Alt Estuary are part of a large population that also uses the Dee Estuary. Thus, many of those recorded at high tide on the Alt feed at low tide on the North Wirral Shore. Numbers recorded on the Alt peaked at over 40,000 in the winters of 1985/86 and 1988/89 and a 10 year alert was triggered by the decline in the period since then. Numbers are still higher than those in the 1970s, however, and overall the species has shown a significant increase. This is in contrast to the situation on the Dee where the species has been in long-term decline. Both Bar-tailed Godwit and Sanderling have also shown high increases since the 1960s, the former despite a large drop in numbers in the early 1990s. The increase in Bar-tailed Godwit numbers coincides with a long-term decrease on the neighbouring Dee Estuary. Benfleet and Southend Marshes Cited species: Oystercatcher, Ringed Plover, Grey Plover, Knot and Dunlin
No Alert species Numbers of all species cited on the Benfleet and Southend Marshes have increased by over 50% since counts began in 1973/74. Dunlin and Oystercatcher have shown particularly high increases in the last 10 years. Blackwater Estuary (Mid-Essex Coast Phase 4) Cited species: Little Grebe, Great Crested Grebe, Cormorant, Dark-bellied Brent Goose, Shelduck, Wigeon, Teal, Pintail, Shoveler, Goldeneye, Red-breasted Merganser, Avocet, Ringed Plover, Grey Plover, Dunlin, Black-tailed Godwit, Curlew and Redshank 50% Alerts: Pintail, Shoveler, Goldeneye, Avocet and Curlew Taking into consideration all cited species, there the has been a long term increase in most species (Figure 3.2c). Only two species, Curlew and Wigeon have shown a decrease over all years. However in the last five years there has been at least a 25% decrease in most species (10 out of 16 species over 5 years) and scores the lowest change index of any of the English SPAs under consideration (Figure 3.2a), indicating a general decrease across all waterbird populations. Pintail numbers on the Blackwater peaked at over 200 birds in 1993/94 after a steady increase over the preceding 17 years. Although there has been a decline since then (triggering a five year Alert) to numbers similar to those in the 1970s and 1980s, the trend for the entire period is still an increasing one. However, given the decline of other species, this might be indicative of a more general problem on the Blackwater. Shoveler have fluctuated greatly in number since 1966/67, with peaks of over 75 birds in 1983/84, 1987/88 and 1992/93. As with Pintail there has been an overall increase since counts began, despite a decrease of over 50% in the last five years. Goldeneye numbers on the Blackwater Estuary rose from the start of counts in 1966/67, peaked at over 600 birds in 1984/85 and over 500 in 1989/90, but have declined since, thus triggering alerts for the species. Present numbers are similar to those in the late 1960s and early 1970s. Avocet have been recorded on the Blackwater Estuary in only two winters, with a mean of just one in 1993/94 and 11 in 1994/95. An alert was triggered due to the absence of birds in the subsequent four winters. From BTO Research Report No. 239 March 2000
31
investigation of the WeBS data, Avocet appear on this site in late summer rather than winter. By November most birds have moved on to other wintering areas. This Alert should be ignored as the current set of indexing months are not relevant. Curlew numbers were stable at 500-1,500 birds during the 1970s and first half of the 1980s. From the mid1980s they underwent a large increase to a peak of over 2,200 birds in 1993/94. This was followed by a large recent decrease to 1,000 birds currently. There has also been a slight overall decline in numbers since the first wader counts in 1970/71. Sudden declines are not unprecedented as numbers have fluctuated widely from year to year and were below 500 in the winters of 1980/81 and 1985/86. However, this decline must be assessed together along with other declines in other species. Numbers of Little Grebe, Great Crested Grebe, Cormorant, Dark-bellied Brent Goose, Red-breasted Merganser, Ringed Plover, Grey Plover, Dunlin and Black-tailed Godwit have all shown high long-term increases over the years considered, although most have suffered recent declines. Breydon Water Cited species: Cormorant, Bewick’s Swan, European White-fronted Goose, Wigeon, Shoveler, Avocet, Dunlin and Black-tailed Godwit
No Alert species All species cited have shown significant increases at Breydon Water in the last 10 years and all but European White-fronted Goose and Dunlin have increased by over 50% since counts began. Chew Valley Lake Cited species: Shoveler
No Alert species Shoveler have increased in number at Chew Valley Lake since the 1960s and, in spite of a slight recent decline, counts remain greater than those recorded prior to 1980. Chichester and Langstone Harbours
Cited species: Little Grebe, Cormorant, Dark-bellied Brent Goose, Shelduck, Wigeon, Teal, Pintail, Shoveler, Red-breasted Merganser, Oystercatcher, Ringed Plover, Grey Plover, Knot, Sanderling, Dunlin, Black-tailed Godwit, Bar-tailed Godwit, Curlew, Redshank and Turnstone 50% Alerts: Shelduck, Shoveler, Knot, Sanderling and Black-tailed Godwit Chichester and Langstone Harbours have shown a large declines across most waterbird species in the past 5 and 10 years (Figures 3.2 a,b). This is particularly marked amongst the waders. Most species have shown an increase over 25 years. Shelduck numbers at Chichester and Langstone have been in consistent long-term decline. They peaked at over 9,000 birds in 1969/70 and, except for a short-term recovery in numbers in the early 1980s, have been in longterm decline since and are currently the order of 1,000 birds. Drops of over 50% have been noted in the last 10 and 25 year periods and over the entire set of years considered. Shoveler initially underwent a large increase at Chichester and Langstone followed by a recent decrease. Numbers rose from c10 birds during the late 1960s and early 1970s to between 50-90 during the 1980s. The decline started in the late 1980s and currently fewer than 20 birds winter on the site. Counts remained higher than those in the 1960s and early 1970s, however, when the species was uncommon at the site. There has thus been an overall upward trend over the years considered. Knot numbers initially increased from less than 500 birds in the early 1970s to over 3,000 in the early 1990s but have declined to c1,000 birds in the last five years since peak counts of over 3,000 in the winters of 1987/88, 1990/91 and 1992/93. In spite of this, there has been an upward trend since the first low counts in the early 1970s.
BTO Research Report No. 239 March 2000
32
Sanderling numbers have fluctuated between 50 and 200 birds over the entire time period and there has been no significant upward or downward trend. Black-tailed Godwit have undergone a consistent decline over the past 30 years. Counts peaked at over 1,300 in 1971/72 after lows in 1969/70 and 1970/71 (count quality may be suspect in the first few years). Since then there has been a decline from 1,300 to the current level of 400-600 birds. This is atypical compared to the national picture and is one of only two estuaries where Black-tailed Godwit have shown a long-term decline (see Appendix 1). Numbers of all other cited species, but Dunlin, have risen over the years considered. Colne Estuary (Mid-Essex Coast Phase 2) Cited species: Great Crested Grebe, Cormorant, Dark-bellied Brent Goose, Shelduck, Avocet, Ringed Plover, Grey Plover, Dunlin, Black-tailed Godwit and Redshank 50% Alerts: Great Crested Grebe, Cormorant, Black-tailed Godwit and Redshank The Colne Estuary is situated immediately north of the Blackwater Estuary and Dengie and is thus important for many of the same species. Trends for three of four species for which alerts are reported - Great Crested Grebe, Cormorant and Black-tailed Godwit - are similar to those at Dengie. Great Crested Grebe were not recorded on the Colne before 1987/88, but peaked at over 30 in that year and in 1991/92 and 1995/96. Numbers have fallen in the last three years triggering a short-term alert. Counts of Cormorant display a similar pattern to the species above. None were recorded in 1986/87, but numbers rose to a peak in 1992/93. A significant decline has occurred in the five years since then. Numbers of Black-tailed Godwit on the Colne Estuary, in common with those on many other estuaries in southeast England, have increased since WeBS counts began. None were recorded prior to 1983/84, but counts rose to just over 1,000 in 1988/89. An alert has been triggered due to a decline to less than 100 birds in the 10 years since then. This is atypical compared to the national picture. Redshank numbers initially underwent a dramatic decrease from 3,000 birds in the early 1970s to less than 500 in the winter of 1981/82. Numbers have recovered since and the trend is continuing upwards and is currently at just over 1,000, but still nowhere near former levels. In 1994/95, numbers temporarily rose to over 2,750. Numbers of all other cited species but Dunlin have risen over the years considered. Crouch and Roach Estuaries (Mid-Essex Coast Phase 3) Cited species: Dark-bellied Brent Goose, Shelduck and Black-tailed Godwit 50% Alert: Shelduck The Crouch and Roach Estuaries lie just south of Dengie on the Essex coast, but are important for fewer species. Shelduck numbers on the Crouch and Roach Estuaries have shown a fluctuating pattern since WeBS counts began. Counts initially rose to over 1,500 in the early 1970s before dropping to less than 200 by the end of the decade. There was then a steady increase up until 1995/96, after which numbers dropped again, triggering a short-term alert. Both Dark-bellied Brent Goose and Black-tailed Godwit have increased over the years considered. Deben Estuary Cited species: Dark-bellied Brent Goose and Avocet
No Alert species Neither Dark-bellied Brent Goose nor Avocet were recorded on the Deben Estuary prior to the early 1980s, but since then their numbers have increased dramatically. The former reached over 2,300 in 1993/94 and Avocet have numbered over 100 in two of the last five years.
BTO Research Report No. 239 March 2000
33
Dengie (Mid-Essex Coast Phase 1) Cited species: Great Crested Grebe, Cormorant, Dark-bellied Brent Goose, Oystercatcher, Grey Plover, Knot, Dunlin, Black-tailed Godwit and Bar-tailed Godwit 50% Alerts: Great Crested Grebe, Cormorant and Black-tailed Godwit
Numbers of Great Crested Grebes at Dengie have followed a similar pattern to those on the neighbouring Colne Estuary. None were recorded until the late 1980s and, after peaks of over 30 in 1988/89 and 1989/90, there has been a decline which triggered a short-term alert. Cormorant numbers likewise rose from zero in 1986/87 to a peak of 85 in 1992/93. A decline to between 10 and 50 birds since then has resulted in a short-term alert. Black-tailed Godwit are usually an uncommon species at Dengie, but peaked at a mean of 130 birds in 1992/93. Only occasional birds have been recorded on the estuary since, thus triggering a short term Alert. Numbers of all other species cited have increased at Dengie, as they also have on those neighbouring estuaries (the Blackwater, Colne, Crouch and Roach) where they were considered important.
Derwent Ings Cited species: Bewick’s Swan, Wigeon and Teal 50% Alert: Bewick’s Swan Numbers of Bewick’s Swans on the Derwent Ings have fluctuated greatly over the years considered (0-160 birds), but when modelled indicate a short- and long-term decline of over 50%. Numbers peaked at 160 in 1979/80, but have been below 90 since the winter of 1986/87. Wigeon and Teal have both increased greatly since counts began. Duddon Estuary Cited species: Shelduck, Pintail, Red-breasted Merganser, Oystercatcher, Knot, Sanderling, Dunlin, Curlew and Redshank 50% Alerts: Shelduck, Pintail and Knot Numbers of cited waterbirds on the Duddon have shown a slight decrease over the last five and ten years (Figure 3.2a,b). Shelduck have regularly fluctuated widely in numbers on the Duddon Estuary from 300 to 1,100 birds. The counts indicate a decrease from 500-800 birds in the early 1970s to c300 birds in the early 1980s. Numbers then rose to a peak of over 1,100 in 1993/94 but have steadily fallen to half that level in the five years since, thus triggering a short-term Alert. Numbers are also currently lower than at the start of counts. Shelduck numbers have increased nationally. In contrast, Pintail numbers have shown a long-term increase on the Duddon. Numbers rose to nearly 2,000 in 1988/89 but had declined to approximately 500 by the last two winters. Knot numbers on the Duddon Estuary have shown a fluctuating pattern since WeBS counts began. None were recorded in four out of five winters between 1976/77 and 1980/81, but reached around 4,000 in four winters between 1986/87 and 1994/95. There has been a decline to numbers of less than 1,000 since then, resulting in a short-term alert. BTO Research Report No. 239 March 2000
34
Numbers of Red-breasted Merganser, Dunlin and Curlew on the Duddon have increased by over 50% over the years considered, whilst those of Oystercatcher, Sanderling and Redshank have shown less significant changes. Exe Estuary
Cited species: Cormorant, Dark-bellied Brent Goose, Wigeon, Red-breasted Merganser, Oystercatcher, Avocet, Grey Plover, Dunlin and Black-tailed Godwit 50% Alert: Wigeon Wigeon numbers fluctuated between 3,000 and 5,000 birds during the late 1960s and the first half of the 1970s. After this numbers dropped sharply to less than 1,000 birds by 1982/83. Numbers have been at a lower level since this, resulting in a 25-year alert, although they have risen slowly in the last 10 years to over 1,600 birds. Numbers of Cormorant, Dark-bellied Brent Goose, Red-breasted Merganser, Oystercatcher, Avocet and Blacktailed Godwit have increased by over 50% on the Exe over the years considered, whilst those of Grey Plover and Dunlin have shown less significant changes. Foulness (Mid-Essex Coast Phase 5) Cited species: Little Grebe, Dark-bellied Brent Goose, Shelduck, Wigeon, Oystercatcher, Avocet, Grey Plover, Knot, Dunlin, Black-tailed Godwit, Bar-tailed Godwit, Curlew and Redshank
No Alert species Numbers of all but one species cited have increased by over 50% at Foulness over the last 25 years. The exception, Curlew, has shown no appreciable trend in its numbers. Hamford Water Cited species: Little Grebe, Dark-bellied Brent Goose, Shelduck, Wigeon, Teal, Avocet, Ringed Plover, Grey Plover, Dunlin, Black-tailed Godwit and Redshank 50% Alert: Black-tailed Godwit Numbers of Black-tailed Godwit at Hamford Water have fluctuated markedly since counts began in 1972/73. Overall there has been an upward trend, numbers having increased by over 50% over the 27 years. Since peaks of over 800 birds in the winters of 1990/91 and 1994/95, however, numbers have fallen to just over 100, thus triggering a five-year alert. Numbers of all other species but Wigeon and Teal have also shown increases of over 50% over the years considered. Hornsea Mere Cited species: Gadwall
No Alert species Numbers of Gadwall have increased markedly at Hornsea Mere since counts began and in the last 12 years have reached over 150 birds in three winters. Humber Flats, Marshes and Coast (Phase 1) Cited species: Dark-bellied Brent Goose, Shelduck, Wigeon, Teal, Mallard, Pochard, Goldeneye, Oystercatcher, Ringed Plover, Grey Plover, Knot, Sanderling, Dunlin, Bar-tailed Godwit, Curlew, Redshank and Turnstone 50% Alerts: Mallard, Pochard, Sanderling Numbers of Mallard on this large estuary have fluctuated greatly between years, with only 700 in 1972/73, but peaks of nearly 8,000 in 1974/75 and 10,000 in 1987/88. Overall, since that second peak in the early 1970s there has been a consistent long-tern decline to less than 2,000 in the last three winters. This has resulted in a downward trend over the entire period of counts and thus triggered both short-term and long-term alerts.
BTO Research Report No. 239 March 2000
35
Few Pochard were recorded on the Humber prior to 1975/76. Since this date, numbers have increased greatly, peaking at over 1,000 birds in 1993/94. A decline to less than 200 birds in the last two winters has triggered a five-year alert, although overall the trend is still an upward one. Sanderling triggered a 50% Alert over five years. Numbers increased from 100 birds in the early 1980s to over 500 birds by 1994. Numbers have since dropped to 200 birds currently thus triggering an Alert. All other cited species on the Humber have shown upward trends over the years concerned, except for Teal, which have shown long-term fluctuations around a population level of around 1,000 birds. Lindisfarne Cited species: Whooper Swan, Shelduck, Wigeon, Red-breasted Merganser, Ringed Plover, Grey Plover, Knot, Sanderling, Dunlin, Bar-tailed Godwit and Redshank 50% Alerts: Whooper Swan, Wigeon, Red-breasted Merganser, Ringed Plover, Knot, Dunlin and Redshank Lindisfarne, along with the Solway Estuary, has shown a long term decrease in waterbird numbers (Figure 3.2c). Numbers have also declined in the medium and short term (Figure 3.2a,b) Whooper Swans have shown a long-term decline at Lindisfarne, falling from a population level of 400 birds in 1969/70 to around 20 throughout the 1990s. Wigeon have shown a similar pattern. Numbers have dropped from 10,000-12,000 in the late 1960s to a fluctuating population of between 200 and 3,000 birds since 1983/84. No Red-breasted Merganser were recorded at Lindisfarne in the first two winters of counts, but numbers rose to nearly 60 in 1974/75. Since then the population has declined to less than 20, triggering both short and long-term alerts. Ringed Plover numbers at Lindisfarne increased to nearly 450 birds by 1985/86, but since have declined to less than 100. This has resulted in a downward trend over the entire period of counts and both short-term and longterm alerts. Knot numbers have shown a long-term decline from around 10,000 birds in the early 1970s to a low of around 1,000 in the 1980s. Numbers have recovered slightly since to 2,000-3,000 birds. Dunlin underwent a large increase in the early 1970s followed by a large decrease in the early 1980s. Since 1985 numbers have been stable. Initially numbers increased from 5,000 birds in 1970/71 to 30,000-32,000 in the winters of 1979/80 and 1980/81. Since then the population has fallen to a more stable level of around 6,000 birds and this has resulted in a 25-year alert. The decline of this species has been linked to the spread of Spartina sp. on the Lindisfarne mudflats. Redshank increased at Lindisfarne from less than 1,000 birds to over 3,000 by the late 1980s. Numbers fell sharply after this to less than 500 in 1993/94. Numbers have recovered slightly to 1,000 birds in the past five winters resulting in a 10-year alert. Numbers of Shelduck and Grey Plover have increased by over 50% at Lindisfarne over the years considered, whilst those of Bar-tailed Godwit have been stable. Martin Mere Cited species: Bewick’s Swan, Whooper Swan, Wigeon, Teal, Mallard, Pintail and Pochard 50% Alerts: Bewick’s Swan, Wigeon, Teal and Pintail No Bewick’s Swans were recorded at Martin Mere until the mid-1970s, after which the population rose sharply to almost 800 in 1990/91. There has been a steep decline since then, however, and none were recorded in 1998/99. Wigeon numbers at Martin Mere were stable at 1,000 to 2,000 birds through the 1970s but rose to a peak of 15,500 birds in 1988/89. Since then, numbers have returned to their previous levels. Counts of between 300 and 2,400 have been recorded in the last four years. This decline has resulted in both five-year and 10-year Alerts.
BTO Research Report No. 239 March 2000
36
Teal numbers have shown a fluctuating but long-term decline at Martin Mere from 5,000 birds in 1977/78 to less than 1,000 in two of the last three winters. It should be noted, however, that only 200 were recorded in 1974/75 but, as this was the first count for this site, count quality may have been poor. Pintail numbers at Martin Mere follow a similar pattern. Although none were recorded in 1966/67, there were over 4,000 in 1973/74 due mostly to an exceptional count of 4,500 in November 1972. By January 1973 only one bird was counted! The more usual count in the 1970s was in the region of 500-1,500 birds and there has been a long-term decline since to a population of between 100 and 200 in the last six winters. Numbers of the other three species cited have all shown long-term increase of over 50% at the site. Medway Estuary and Marshes Cited species: Little Grebe, Great Crested Grebe, Cormorant, Bewick’s Swan, Dark-bellied Brent Goose, Shelduck, Wigeon, Teal, Mallard, Pintail, Shoveler, Pochard, Oystercatcher, Avocet, Ringed Plover, Grey Plover, Knot, Dunlin, Black-tailed Godwit, Curlew, Redshank and Turnstone 50% Alerts: Little Grebe, Great Crested Grebe, Wigeon, Pintail, Shoveler, Pochard, Ringed Plover, Dunlin and Turnstone Although the trend has been for a general long-term increase in waterbird numbers on the Medway, over the last five and 10 years there has been a general decline in waterbird numbers (Figure 3.2 a-c). No Little Grebes were recorded on the Medway prior to 1988/89, after which the population rose to peaks of over 30 in 1990/91 and 1995/96. Since then numbers have declined to less than 10 in the last two winters, triggering a short-term alert. Great Crested Grebe numbers have shown a similar pattern, increasing to over 100 by 1989/90, but falling after 1995/96 to numbers of less than 50, this also resulting in a short-term alert. Numbers of Wigeon on the Medway fell from 8,000-9,000 in the early 1970s to less than 1,000 in the early 1980s. Although numbers subsequently recovered to over 5,000, there has been an underlying downward trend and a drop of over 50% over the years considered. Pintail numbers were low during the first years of WeBS counts but rose to over 800 by the winter of 1975/76. Subsequently numbers of the species have shown a similar pattern to those of Wigeon, with a sharp decline in the early 1990s, followed by a period of partial recovery. Over the last 25 years, however, there has been an overall decline of over 50%. Shoveler numbers rose in the initial years of counts, reaching a population level of over 130 by 1971/72. Since then there has been a long-term decline with only a brief recovery in the late 1980s. Pochard numbers have fluctuated more, with peaks of 170 in 1974/75, 110 in 1976/77, over 40 in 1986/87 and over 120 in 1996/97 being separated by years when the species was rare or absent. The underlying trend over the last 25 years is downward, however, with a drop of over 50%. Ringed Plover numbers on the Medway increased from less than 100 in the early 1970s to 1,000 in 1994/95. A decline to numbers of around 200 in the four years since has triggered a short-term alert, but has not masked the overall upward trend. Dunlin numbers have followed a very similar pattern to the above species. They rose from an initial level of around 2,000 to over 30,000 in the winter of 1994/95, before also declining in the four years since. As with Ringed Plover, this recent decline has not hidden the underlying long-term upward trend. Turnstone numbers have also followed this pattern. From an initial population of less than 50, numbers rose to 550 by 1993/94, before declining in the five years since. This decline has resulted in a short-term alert, but again has not hidden the overall upward trend. Numbers of all other species cited have shown long-term (25 and all year) increases on the Medway. Mersey Estuary Cited species: Great Crested Grebe, Shelduck, Wigeon, Teal, Pintail, Grey Plover, Dunlin, Black-tailed Godwit, Curlew and Redshank BTO Research Report No. 239 March 2000
37
50% Alerts: Great Crested Grebe and Pintail Great Crested Grebe numbers on the Mersey rose from less than 20 in the early 1980s to 120 in the winter of 1992/93. Numbers had dropped back to less than 10 by 1998/99, triggering a short-term alert. Pintail numbers on the Mersey initially rose from around 500 in the late 1960s to between 5,000 and 12,000 in the late 1970s and early 1980s. Numbers have since shown a steady decline, and had fallen back to 500 by 1998/99. This has resulted in both five-year and 10-year alerts. Numbers of all other cited species have risen by over 50% over the years considered. Minsmere - Walberswick Cited species: European White-fronted Goose, Gadwall and Shoveler
No Alert species Numbers of all three species cited have increased at the site over the years considered. Morecambe Bay
Cited species: Oystercatcher, Grey Plover, Knot, Sanderling, Dunlin, Black-tailed Godwit, Bar-tailed Godwit, Curlew, Redshank and Turnstone 50% Alerts: Bar-tailed Godwit In spite of a large rise in 1998/99, there has also been an overall downward trend in the numbers of Bar-tailed Godwit at Morecambe Bay. Counts fell from over 9,000 in 1971/72 to a level of around 2,000 at the start of the 1990s. Numbers of Grey Plover, Black-tailed Godwit, Sanderling and Curlew have shown long-term increases of over 50% at Morecambe Bay, whilst those of Oystercatcher, Knot, Dunlin, Redshank and Turnstone have been more stable. North Norfolk Coast
Cited species: Little Grebe, Cormorant, European White-fronted Goose, Dark-bellied Brent Goose, Shelduck, Wigeon, Gadwall, Teal, Pintail, Shoveler, Oystercatcher, Avocet, Ringed Plover, Grey Plover, Knot, Sanderling, Dunlin, Bar-tailed Godwit and Redshank No Alert species Numbers of all cited species on the North Norfolk Coast, except for Oystercatcher, Knot and Dunlin, have increased by over 50% over the years concerned. Orfordness – Havergate (part of Alde-Ore Estuary) Cited Species: Avocet, Redshank No Alert species. Both Avocet and Redshank have undergone large increases. Ouse Washes Cite Species: Bewick’s Swan, Black-tailed Godwit, Coot, Cormorant, Gadwall, Mallard, Pintail, Pochard, Shoveler, Teal, Tufted Duck, Whooper Swan, Wigeon 50% Alert: Cormorant, Wigeon, Shoveler No data were available for Black-tailed Godwit, as the wader data for this analysis only covered estuarine sites.
Cormorant numbers initially increased from 100 birds to a peak of 200-250 birds in 1993/94 before dropping back to levels recorded at the start of counts, triggering a 5 year Alert. There is no obvious long-term trend in numbers and there is too much variation in the counts to BTO Research Report No. 239 March 2000
38
draw any firm conclusions as to the current trend. The Ouse Washes is a key site for Wigeon in the UK. After 3 initial low counts, numbers reached a peak of 30,000-35,000 birds in the early 1970s before dropping to 20,000 birds during the 1980s. Numbers then increased again in the late 1980s / early 1990s to 30,000 birds but the last two years of counts have been abnormally small at c15,000 birds. The recent drop in numbers triggered a 5 and 10 year 50% Alert indicating a recent decline in numbers. The past two winters have been a ‘blip’ and more data would be required to determine whether this is indicative of a long term decline in Wigeon numbers. Shoveler have triggered a 50% Alert over all years. Inspection of the numbers of birds recorded indicates that in October 1968, 1,200 birds were counted causing a large increase in the smoothed index at the beginning of the time series. Since that date approximately 100 birds per month have been recorded and numbers have been stable since. This Alert is not indicative of any long term decline. Pagham Harbour Cited Species: Dark-bellied Brent Goose, Pintail 50% Alert: Dark-bellied Brent Goose As with most other south and east coast estuaries, Brent Geese have undergone a large increase since the start of counts. However, in Pagham Harbour, this increase ceased in 1980 and the population became stable at 1,5002,500 birds. However, in the last two winters numbers dropped to c1,000 birds and triggered the five and 10 year Alerts. These last two winters are atypical and it remains to be seen whether this is the start of a longer term trend.
Poole Harbour Cited Species: Cormorant, Dark-bellied Brent Goose, Shelduck, Shoveler, Pochard, Goldeneye, Red-breasted Merganser, Avocet, Dunlin, Black-tailed Godwit, Curlew, Redshank 50% Alert: Pochard Most species have undergone large increases in Poole Harbour. Pochard, however, raised a 10 year Alert. The number of Pochard rose steadily from zero at the start of counts in 1966/67 to approximately 300 birds in 1980/81. Numbers then fluctuated from 300 to 700 birds throughout the mid 1980s and first half of the 1990s, peaking at over 800 in 1996/97. The number of birds in the following two winters crashed to less than 200, thus triggering a 10 year Alert. However, the large fluctuations that have been characteristic of this species at this site, do not indicate any declining trend. Portsmouth Harbour Cited Species: Dark-bellied Brent Goose No Alert species. As at many other sites in southern and eastern England, numbers of Dark-bellied Brent Geese have risen over the last 25 years at Portsmouth Harbour. A slight recent decline matches that at neighbouring Chichester and Langstone Harbours. Ribble and Alt Estuaries (Phase 2) Bar-tailed Godwit, Bewick’s Swan, Black-tailed Godwit, Cormorant, Curlew, Dunlin, Grey Plover, Knot, Oystercatcher, Pintail, Redshank, Sanderling, Shelduck, Teal, Whooper Swan, Wigeon 50% Alert: Whooper Swan, Knot As with many sites, the number of Whooper Swans on the Ribble and Alt vary enormously with between 0 and 400 birds per year. The last 3 winters have seen relatively few birds wintering on this SPA, thus triggering the 10 year Alert, but this is not indicative of any long-term trend in numbers. There is also likely to be much interchange with Martin Mere. BTO Research Report No. 239 March 2000
39
Knot numbers vary greatly between years on this SPA. The general long-term pattern is of an increase from 10,000-30,000 the start of counts in 1969/70 to a peak of 70,000 birds per month in the late 1980s. From that date there has been a consistent decline in numbers to under 20,000 birds currently. The counts in 1997/98 and 1998/99 were low, thus triggering Alerts over all time periods. There is no obvious overall long-term trend. Ribble Estuary Cited Species: Bar-tailed Godwit, Bewick’s Swan, Black-tailed Godwit, Dunlin, Knot, Oystercatcher, Sanderling, Shelduck, Wigeon 50% Alert: Knot, Dunlin, Bar-tailed Godwit, Sanderling Knot numbers have undergone a decline on the Ribble, triggering 50% Alerts over 5, 10, 25 and all years. See above (Ribble & Alt) for details. Dunlin did not trigger an Alert when considering the Ribble and Alt together. However when the Ribble is treated separately, they trigger a 25 year 50% Alert. This is due to very large counts of 50,000+ Dunlin in the early 1970s which were followed by a large decline to under 10,000 birds in the late 1980s. Since then there has been a consistent increase in numbers which was sufficient to trigger a 50% Positive Alert over 10 years. Bar-tailed Godwit increased from c3,000 birds in the early 1970s to over 10,000 birds in the early 1990s. However, since 1994/95 there has been a large decline which triggered the 5 and 10 year Alerts. Over this period, numbers fell to between 2,000 and 8,000 birds. Sanderling have undergone a long-term decline from 1,500 to 2,500 in the early 1970s to 500-1,000 birds currently. They did not however trigger an Alert when considering the Ribble and Alt together. Rutland Water
Cited Species: Coot, Cormorant, Gadwall, Goldeneye, Great Crested Grebe, Little Grebe, Pochard, Shoveler, Teal, Tufted Duck, Wigeon 50% Alert: Cormorant Cormorants at Rutland Water underwent an increase from the start of counts to a peak over 500 birds in 1994/95 but have declined in numbers to less than 200 currently. This is similar to the national picture.
Severn Estuary Cited Species: Bewick’s Swan, Curlew, Dunlin, Gadwall, Grey Plover, Mallard, Pintail, Pochard, Redshank, Shelduck, Shoveler, Teal, Tufted Duck, White-fronted Goose, Wigeon 50% Alerts: Grey Plover, Dunlin and Curlew The Severn Estuary is divided into five sub-sites in WeBS analyses, one on the Welsh shore and four on the English. Trends are investigated for the site as a whole, which includes the Upper Severn SPA in Gloucestershire. However, English sections have shown a general increase in waterbirds over the last 25 years (Figure 3.2c). Grey Plover numbers on the Severn Estuary peaked in 1979/80 at 2,300 birds, but subsequently returned to previous levels of less than 500. A rise in numbers at the end of the 1980s as been followed by a shallow decline in numbers resulting in both five- and 10-year alerts. This is atypical to the national which has shown a dramatic increase. Numbers of Curlew on the Severn Estuary rose to levels of over 1,500 birds in the five winters between 1985/86 and 1994/95. A sharp decline since then to numbers similar to those in the 1970s has resulted in a five-year alert. Dunlin have fluctuated widely in number on the Severn Estuary over the years considered. Numbers reached over 20,000 in three winters between 1981/82 and 1990/91, but in the last three years have averaged 5,000. Overall, there has been an underlying downward trend and a drop of over 50% over the years considered.
BTO Research Report No. 239 March 2000
40
Solent and Southampton Water Cited species: Little Grebe, Great Crested Grebe, Cormorant, Dark-bellied Brent Goose, Shelduck, Wigeon, Gadwall, Teal, Pintail, Shoveler, Red-breasted Merganser, Ringed Plover, Grey Plover, Dunlin, Black-tailed Godwit, Curlew, Redshank 50% Alert Species: Shoveler, Ringed Plover, Black-tailed Godwit Several species in the Solent and Southampton Water have recently undergone declines during the past 5 years (Figure 3.2a). Shoveler, Ringed Plover, Black-tailed Godwit, Grey Plover have all undergone dramatic declines in the Solent in 1996/97. These are all species which had been increasing in the past. Redshank are in a consistent long-term decline but have not reached the 50% decline threshold, although if they continue to decline at a similar rate an alert will be issued in the near-future. Shoveler have shown a long term increase on the Solent since the start of counts but have shown a recent decline which has triggered a 50% Alert over the last 5 years. There were initially no birds wintering on the Solent and Southampton Water WeBS sites in 1970/71 but steadily increased to an average count of 90 birds per month in 1995/96. The following winter the number of Shoveler dropped to an average of less than 40 birds per month and remained low to the last year of counts. Since the start of counts numbers of Ringed Plover on the Solent and Southampton rose from between 100-200 birds to between 300 and 400 birds. The average number of birds counted per month peaked in 1995/96 at an average of over 600 birds and then dropped by two-thirds to 200 birds per month the following year, thus triggering the 50% Alert over 5 years. Black-tailed Godwits are a species that have increased across much of southern Britain since 1969 but, as with several other estuaries in the south and south-east, numbers have decreased in the Solent and Southampton Water over the last five years and a 50% Alert was issued indicating a short-term decline in numbers. Stodmarsh Cited species: European White-fronted Goose, Wigeon, Gadwall, Mallard, Shoveler, Pochard, Tufted Duck 50% Alert: Mallard Mallard have triggered a 50% Alert over 5, 25, and all years. There is no apparent long term trend and the Alerts have been caused by widely fluctuating numbers between years. In most years between 100 and 200 were counted in January which is the month in which Mallard are indexed nationally. However in some years over 1,000 birds are counted and in 1981/82 3,500 birds were counted. These large counts increased the average number of birds wintering on the site in the 1970s and 1980s and a recent run of low counts over the last six winters have triggered the alerts. Stour and Orwell Estuaries Cited Species: Great Crested Grebe, Cormorant, Mute Swan, Dark-bellied Brent Goose, Shelduck, Wigeon, Pintail, Goldeneye, Oystercatcher, Ringed Plover, Grey Plover, Knot, Dunlin, Black-tailed Godwit, Curlew, Redshank, Turnstone 50% Alert: Mute Swan, Wigeon, Ringed Plover Mute Swan triggers a 50% Alert when considering change over all years. They were at their peak of c800 birds on the Stour and Orwell estuaries at the start of counts in 1969/70 but fell in number to an average of between 150-300 birds in the winter months. Numbers have remained stable at this level since 1975/76. Wigeon numbers dropped from an average of over 9,000 birds in 1966/67 to 2,000 two winters later. Since then there has been an upward trend and numbers now average around 4,000. Even though the current trend is upward, the trend for all years combined remains downward and represents a drop of over 50%. Ringed Plover increased in number from 100 birds in 1971/72 to a peak of 700-800 birds in 1988/89 but have fallen since. Numbers have fluctuated widely from year to year but the last two counts on 1997/98 and 1998/99 have been exceptionally low, thus triggering the Alerts over 5 and 10 years. These counts were equivalent to those in the early 1970s.
BTO Research Report No. 239 March 2000
41
Tamar Estuaries Complex Cited Species: Avocet No Alerts raised. Despite fluctuating numbers, Avocet have increased on the Tamar since the start of counts in 1969/70 to the current level of 100-300 birds per month.
Teesmouth and Cleveland Coast Cited Species: Shelduck, Shoveler, Knot, Redshank 50% Alert: Shelduck, Knot Shelduck have declined from 1,500-2,500 birds to the current level of 1,000 birds. However the number of birds recorded in 1988/99 was only five. The reasons for this are unknown but count quality may be an issue here. Knot numbers have shown a consistent decline in numbers since the start of counts in 1969/70. Numbers initially underwent rapid decline from 10,000 birds at the start to less than 2,000 in 1974/75 before increasing and fluctuating between 4,000-6,000 birds in the late 1970s and early 1980s. Numbers then declined and by 1987/88 numbers reached their current level of 1,000 to 2,000 birds. Thames Estuary and Marshes Cited Species: Little Grebe, European White-fronted Goose, Shelduck, Gadwall, Pintail, Shoveler, Avocet, Grey Plover, Knot, Dunlin, Black-tailed Godwit, Redshank 50% Alerts: European White-fronted Goose, Pintail European White-fronted Goose triggered 10, 25 and all years Alerts indicating a long-term decline, followed by recent stability as the local population has gone almost to extinction. Although numbers varied widely on the Thames (0-1,300 birds per month) there has been a long-term declining trend in numbers and the population reached zero in 1994/954 and 1995/96. Since 1996/97 and the following 2 years small numbers (averaging c50 birds per month) have wintered on the Thames. Pintail numbers tend to fluctuate widely on estuaries in the UK. On the Thames, numbers remained stable at less than 50 birds until the late 1970s when they increased to over 200 birds counted per month in 1987/88 and 1988/89. Numbers have declined consistently since, thus triggering the 5 and 10 year 50% Alerts. The number of birds is currently less than 50. Thanet Coast and Sandwich Bay Cited Species: Turnstone 50% Alert: Turnstone Turnstone numbers on the Thanet Coast and at Sandwich Bay have shown great fluctuations from year to year, but prior to 1995/96, when numbers peaked at 130, had shown an upward trend. Numbers have dropped sharply since and this has resulted in both five-year and 10-year alerts. The WeBS site that covers this SPA is Pegwell Bay and this only includes the estuarine part. It is likely that most Turnstone will be on the rocky shore parts of the SPA land. It is not know if this site is representative of the Turnstone population as a whole. The Dee Estuary Cited Species: Cormorant, Shelduck, Wigeon, Teal, Pintail, Oystercatcher, Grey Plover, Knot, Dunlin, Blacktailed Godwit, Bar-tailed Godwit, Curlew, Redshank, Turnstone 50% Alert: Knot, Bar-tailed Godwit This included both Welsh and English parts of The Dee. Both species have shown very large declines in number since large counts in the early 1970s. This is due, in part, to the fact that more now roost on the Alt, due to disturbance of roosts on the Dee. Many still feed on the North Wirral shore. Numbers of Knot on the Dee have undergone a large decrease since the start of counting in 1970/71 and have raised 50% Alerts over all four time periods. Apart from Bar-tailed Godwit, this is in direct contrast to other BTO Research Report No. 239 March 2000
42
waders on the Dee which are stable or increasing in number. Knot numbers have fallen by over 30,000 over the whole time period. Numbers declined from 20,000-40,000 birds in the early 1970s to the latest count of an average of c2,500 birds per month currently. Bar-tailed Godwit numbers fell from 4,000-7,000 birds in the early 1970s to 100-200 birds in the early 1980s. Numbers remained stable until the early 1990s and have recovered slightly since, fluctuating from less than 100 to just over 1,000 birds. Both declines have coincided with increases on the neighbouring Alt estuary. The Swale Cited Species: Little Grebe, Cormorant, European White-fronted Goose, Dark-bellied Brent Goose, Shelduck, Wigeon, Gadwall, Teal, Pintail, Shoveler, Oystercatcher, Avocet, Ringed Plover, Grey Plover, Knot, Dunlin, Black-tailed Godwit, Bar-tailed Godwit, Curlew, Redshank 50% Alert: European White-fronted Goose, Pintail Numbers of White-fronted Geese fluctuate widely from year to year in the Swale and it is difficult to detect any consistent long term trend. Numbers increased from 200-600 birds per month to 800-1,600 birds from the 1970s to the late 1980s but have been erratic since. The last four winter’s counts have been low (600-1,000), thus triggering the Alert. Few Pintail were counted on the Swale prior to 1980/81 after which the population rose rapidly to a peak of over 600 in the mid-1990s. A drop to less than 300 in the winters since then has resulted in a five-year alert. The Wash Little Grebe, Cormorant, Bewick’s Swan, Whooper Swan, European White-fronted Goose, Dark-bellied Brent Goose, Shelduck, Wigeon, Gadwall, Mallard, Pintail, Goldeneye, Oystercatcher, Avocet, Ringed Plover, Grey Plover, Knot, Sanderling, Dunlin, Black-tailed Godwit, Bar-tailed Godwit, Curlew, Redshank, Turnstone 50% Alert: Little Grebe, Bewick’s Swan, Whooper Swan, European White-fronted Goose, Wigeon, Pintail, Goldeneye, Oystercatcher Despite an overall increase in waterbirds, there has been a worrying fall in a number of species of wildfowl on the Wash over the past five to 10 years (Figure 3.2 a,b). This has coincided with crashes in shellfish stocks (Atkinson et al. 2000). Little Grebe numbers have fallen to around 20 since previously rising to a peak of over 80 in 1995/96. Present numbers are similar to those in the late 1980s and early 1990s. Numbers of Bewick’s Swans have fluctuated greatly on the Wash, reaching over 80 in four winters between the 1980s and early 1990s. Numbers have fallen to less than 20 in the last five years, however, triggering both fiveand 10-year alerts. Present numbers are similar to those prior to 1976/77. Both this species and Whooper Swans have never used the Wash regularly and non-zero counts tend to occur in only a few months. Numbers of Whooper Swans were initially somewhat less erratic, rising to a peak of over 25 in the early 1980s, before declining to previous levels. Two subsequent peaks of over 50 in 1991/92 and 1994/95 have been followed by a drop to numbers of less than 15, resulting in a five-year alert. European White-fronted Geese numbered less than 10 on the Wash during the first years of WeBS counts but rose to over 30 by the winter of 1973/74. Since then there has been a long-term decline, and many years with zero counts, with only a brief recovery in 1996/97. Wigeon numbers have shown great fluctuations from year to year. Peaks of between 5,000 and 7,600 were reached in four winters between 1978/79 and 1985/86, but there has been a subsequent downward trend to current numbers of less than 2,000. Pintail were rare on the Wash prior to the 1980s, but rose in number to 3,600 by the winter of 1988/89. There has been a sharp decline since to numbers of less than 150 in the last five winters. This has triggered both fiveand 10-year Alerts. A peak of 500 Goldeneye was recorded on the Wash in the winter of 1973/74. Although numbers have been erratic since, there has been a clear downward trend over the past five-, 10- and 25-year periods. BTO Research Report No. 239 March 2000
43
Numbers of Oystercatcher on the Wash rose steadily from the start of counts to 20,000 birds by the late 1970s before rising again to 40,000 by 1988/89. A decline since to around 10,000 birds has triggered a 10-year alert. This is due, in part, to declines in shellfish stocks on the Wash. Numbers of all other cited species on the Wash have shown long-term increases of over 50% over the years concerned, except for those of Knot, Dunlin, Curlew, Redshank and Turnstone which have been more stable. Upper Solway Flats and Marshes Great Crested Grebe, Cormorant, Whooper Swan, Shelduck, Teal, Mallard, Pintail, Shoveler, Goldeneye, Oystercatcher, Ringed Plover, Grey Plover, Knot, Sanderling, Dunlin, Black-tailed Godwit, Bar-tailed Godwit, Curlew, Redshank, Turnstone 50% Alert: Whooper Swan, Shoveler, Goldeneye, Ringed Plover, Knot, Sanderling, Black-tailed Godwit, Bartailed Godwit, Turnstone This SPA includes areas of the Solway Firth in both England and Scotland. Numbers of Whooper Swan on the Solway increased from less than 20 in the 1960s to a maximum of 250 in 1988/89. Declines of over 50% have since occurred over both the past five and ten years, but have not masked an overall upward trend. Shoveler numbers rose to almost 1,000 in the winter of 1971/72, but afterwards returned to levels of less than 100. An increase to 120 in 1987/88 has been followed by a steady decline to numbers of less than 20 in all but one of the past seven years and this has triggered a 10-year alert. Numbers of Goldeneye on the Solway have shown a similar pattern to those of Whooper Swan, rising from levels of less than 10 during most of the 1970s to a peak of 500 in 1990/91. Declines of over 50% have occurred over both the past five and ten years, but have not hidden the general upward trend. Ringed Plover numbers peaked at over 3,000 in 1973/74 but dropped sharply afterwards to their current level of between 100 and 500. An alert has been triggered for the drop over the past 25 years. Numbers of Knot have shown a similar pattern. After a peak of over 40,000 in 1973/74, numbers fell to less than 10,000 during the 1980s. Although a brief recovery occurred during the early 1990s, there has still been a general downward trend and a drop of over 50% over the last 25 years. Sanderling numbers have fluctuated more widely from year to year with peaks of over 300 in 1973/74 and 1985/86 and 220 in 1988/89 being separated by years when the species was rare or absent. The 25 year Alert was triggered by an exceptionally large count in 1974/75 and is not indicative of any long-term trend.
Prior to an unprecedented count of 200 birds in 1996/97, numbers of Black-tailed Godwit in winter on the Solway typically averaged less than 35. In spite of this peak, there has been a downward trend over the past 25 years and a drop of over 50%. Numbers of Bar-tailed Godwit on the Solway have shown a fluctuating but long-term decline from a peak of 11,000 birds in 1973/74 to less than 2,000 during most of the 1990s. An Alert has thus been triggered for a drop of over 50% over the past 25 years. Turnstone numbers have fluctuated on the Solway, peaking at over 600 in 1972/73, 1985/86 and 1987/88. There has been an overall downward trend over the last 25 years, however, and a drop of over 50%. Walmore Common Cited Species: Bewick’s Swan No Alert Species. Numbers of Bewick’s Swans have fluctuated greatly at Walmore Common, but have shown an upward trend and a rise of over 50% over all the years considered.
BTO Research Report No. 239 March 2000
44
BTO Research Report No. 239 March 2000
Table 3.1
Percentage change and Alerts over 5,10, 25 and all years of counts. For interpretation of symbols see section 1.6. Population size refers to the average number of birds per month recorded on the WeBS sites used.
ALERTS CALCULATED USING GAMS 5-yr
10-yr ++
25-yr
++
++ ++ ++
All ++ ++ ++ ++ ++ ++
++ ++ ++ + ++ ++ ++
++ ++ ++ ++ ++ ++ ++
+
++ ++
+ ++
+ ++ ++
++ ++ ++ ++
++ ++ ++ ++ ++
++
++
++
++ ++
+
++ ++
+ ++ -
45
++ + +
++
++ +
+ ++ + ++ + + ++ ++ ++
-
5-yr 9 -1 13 22 4 73 -9 53 13 -24 -17 6 47 7 -13 4 1 6 13 4 15 35 51 7 0 69 -13 -6 -6 26 -8 42 21 -6 4 -18
10-yr 94 22 13 54 -3 123 -39 132 13 -17 -15 40 82 18 -31 -17 3 8 13 20 31 75 64 12 -14 322 -23 17 -16 14 3 91 3 6 4 -28
25-yr
122 227 253 18 2,957 293 147 26 112 828 139 -16 7 41 19 12 95 157 206 2,975 N/A 19 2,915 -17 276 -2 -3 -21 266 47 19 9 -4
ALERTS CALCULATED USING UNDERHILLMETHOD
ENGLAND All 453 54 175 137 302 534 -25 5,456 671 388 76 123 2,655 352 -14 395 136 18 85 160 748 255 33,233 19 38 2,591 31 563 -34 46 28 864 10 77 55 2
Species Little Grebe Great Crested Grebe Cormorant Mute Swan Bewick`s Swan Whooper Swan European White-fronted Goose Feral Greylag Goose Canada Goose Dark-bellied Brent Goose Shelduck Wigeon Gadwall Teal Mallard Pintail Shoveler Pochard Tufted Duck Goldeneye Red-breasted Merganser Goosander Ruddy Duck Coot Oystercatcher Avocet Ringed Plover Grey Plover Knot Sanderling Dunlin Black-tailed Godwit Bar-tailed Godwit Curlew Redshank Turnstone
5yr 29 2 8 29 4 73 -25 73 13 -35 -23 16 59 4 -14 1 -7 19 13 8 11 32 45 16 -1 68 -9 12 -6 26 2 47 37 -3 7 -22
10yr 58 25 47 38 -3 123 -91 59 10 -30 -25 28 47 26 -47 -4 0 11 7 20 21 34 38 14 -7 396 -17 38 -12 15 27 107 9 7 8 -27
25yr
124 227 253 -1 2,020 303 153 21 115 872 153 -11 34 27 36 19 107 182 161 4,155 39 2,134 1 384 -12 12 -5 324 58 34 10 -2
All 332 41 90 123 302 534 -50 3,822 577 391 65 122 2,169 329 -9 291 80 43 81 156 606 203 19,900 18 39 2,107 28 510 -26 29 24 718 32 57 38 -2
5yr +
+
10yr ++ + + +
++ ++
++ -++
-
+ + + -
++
25yr
++ ++ ++ ++ ++ ++ ++ ++ ++ + + +
+ +
+ +
++ ++ ++ ++
++
++
+ ++
+
++
+ + +
+ ++
-
++ ++ +
All ++ + ++ ++ ++ ++ -++ ++ ++ ++ ++ ++ ++ ++ ++ + ++ ++ ++ ++ ++ + ++ + ++ + + ++ + ++ ++
Pop size 1998 2,000 8,000 10,000 10,500 5,000 2,500 3,000 74,000 28,500 70,500 47,000 257,000 8,000 90,000 76,000 17,000 6,000 31,000 36,000 3,000 1,500 2,000 3,000 84,500 128,000 3,500 5,500 37,000 179,500 6,000 345,500 10,000 37,000 43,000 48,500 9,000
Species/site combinations which are cited/proposed for English SPAs and are currently covered by the Waterbird Alert System.
46
SITE NAME Abberton Reservoir Alde-Ore Estuary Alt Estuary Benfleet and Southend Marshes Blackwater Estuary (Mid-Essex Coast Phase 4) Breydon Water Chew Valley Lake Chichester and Langstone Harbours Colne Estuary (Mid-Essex Coast Phase 2) Crouch and Roach Estuaries (Mid-Essex Coast Phase 3) Deben Estuary Dengie (Mid-Essex Coast Phase 1) Derwent Ings (part of Lower Derwent Valley) Duddon Estuary Exe Estuary Foulness (Mid-Essex Coast Phase 5) Hamford Water Holburn Lake and Moss Hornsea Mere Humber Flats, Marshes and Coast (Phase 1) Lindisfarne Martin Mere Medway Estuary and Marshes Mersey Estuary Minsmere - Walberswick Morecambe Bay North Norfolk Coast Orfordness-Havergate (part of Alde-Ore Estuary) Ouse Washes Pagham Harbour Poole Harbour Portsmouth Harbour Ribble and Alt Estuaries (Phase 2) Ribble Estuary Rutland Water Severn Estuary-ENGLAND Solent and Southampton Water Stodmarsh Stour and Orwell Estuaries Tamar Estuaries Complex Teesmouth and Cleveland Coast Thames Estuary and Marshes Thanet Coast and Sandwich Bay The Dee Estuary The Swale The Wash Upper Solway Flats and Marshes Walmore Common
Avocet Bar-tailed Godwit Bewick`s Swan Black-tailed Godwit Coot Cormorant Curlew Dark-bellied Brent Goose Dunlin Gadwall Goldeneye Goosander Great Crested Grebe Grey Plover Greylag Goose Knot Little Grebe Mallard Mute Swan Oystercatcher Pintail Pochard Red-breasted Merganser Redshank Ringed Plover Sanderling Shelduck Shoveler Teal Tufted Duck Turnstone White-fronted Goose Whooper Swan Wigeon
BTO Research Report No. 239 March 2000
Table 3.2
47
Shoveler
Teal
Whooper Swan
Wigeon
Bar-tailed Godwit
Black-tailed Godwit
E
E
E
E
E
E
E
E
E
E
Turnstone
Shelduck
E
Sanderling
Pochard
E
Ringed Plover
Pintail
E
Redshank
Mallard
E
Oystercatcher
Little Grebe
E
Knot
Light-bellied Brent Goose
E
Grey Plover
Great Crested Grebe
E
Dunlin
Goldeneye
E
Curlew
Gadwall
Country Abberton Reservoir Chesil Beach and The Fleet Isles of Scilly Lindisfarne Ouse Washes Avon Valley Lea Valley South-West London Water Bodies Upper Severn Estuary (part of Severn Estuary) Mersey Narrows Morecambe Bay Arun Valley Broadland Gibraltar Point Lower Derwent Valley Somerset Levels and Moors Nene Washes Old Hall Marshes (part of Blackwater Estuary) Dungeness to Pett Level
Dark-bellied Brent Goose
Site
Cormorant
Species/site combinations which are cited/proposed for English SPAs and are not currently covered by the Waterbird Alert System.
Bewick`s Swan
BTO Research Report No. 239 March 2000
Table 3.3
E
E
E
E
E
E
E
E
E
Abberton Reservoir Alde-Ore Estuary Alt Estuary Benacre to Easton Bavents Blackwater Estuary (Mid-Essex Coast Phase 4) Breydon Water Broadland Chichester and Langstone Harbours Colne Estuary (Mid-Essex Coast Phase 2) Dengie (Mid-Essex Coast Phase 1) Dungeness to Pett Level Exe Estuary Foulness (Mid-Essex Coast Phase 5) Hamford Water Humber Flats, Marshes and Coast (Phase 1) Lea Valley Leighton Moss Lindisfarne Lower Derwent Valley Marazion Marsh Martin Mere Medway Estuary and Marshes Mersey Estuary Minsmere - Walberswick Morecambe Bay Nene Washes North Norfolk Coast Northumbria Coast Orfordness-Havergate (part of Alde-Ore Estuary) Ouse Washes Pagham Harbour Poole Harbour Ribble and Alt Estuaries (Phase 2) Ribble Estuary Rockcliffe Marsh (part of Upper Solway Flats and Marshes) Rutland Water Severn Estuary Solent and Southampton Water Somerset Levels and Moors Stodmarsh Stour and Orwell Estuaries Tamar Estuaries Complex Teesmouth and Cleveland Coast Thames Estuary and Marshes Thanet Coast and Sandwich Bay The Dee Estuary The Swale The Wash Upper Severn Estuary (part of Severn Estuary) Upper Research Solway FlatsReport and Marshes BTO No. 239
March 2000
E E E E E E E E E E E E E E E E E E E E E E E E E E E E E E E E E E E E EW E E E E E E E E ES E E E ES
White-fronted Goose
Water Rail
Velvet Scoter
Spotted Redshank
Snipe
Slavonian Grebe
Scaup
Ruff
Red-throated Diver
Pink-footed Goose
Little Egret
Long-tailed duck
Lapwing
Greylag Goose
Greenshank
Eider
Golden Plover
Common Scoter
Bittern
Bean Goose
Barnacle Goose
Waterbird species which are cited/proposed for individual English SPAs but which are not regularly indexed by WeBS and therefore not currently treated under the Waterbird Alert System.
Country
Table 3.4
48
BTO Research Report No. 239 March 2000
Table 3.5 5-year Alert
Site Alerts and population change (%) for waterbirds on SPAs in England over 5, 10, 25 and all years. (++ / -- = 50% Alert, + / - = 25% Alert). 10-year Alert
n/a n/a ++
-++ +
49
+ n/a --
++ -
++ + ++
+ + ++
++ ++
++ ++ ++ ++
++ ++
--
25-year Alert
5-year change
10-year change
25 year change
All years change
First count
Last count
++ ++ n/a
++ ++ ++ ++ ++ ++ ++ -
29 -2 -2 n/a -7 94 8 -11 35 -30 n/a -52
11 n/a 5 -75 -46 75 29 5 174 -49 19 -57
n/a n/a 316 -50 247 705 -19 2 72 -48 56 n/a
8 156 >1000 17 >1000 333 >1000 68 94 145 56 -26
82 86 66 66 66 66 66 66 66 66 66 82
++ ++ ++ ++ ++ ++ ++ ++
++ ++ ++ ++ -++ ++ ++ ++
>1000 50 124 -8 217 60 21 58 169
38 47 72 16 -35 123 113 >1000 430
>1000 486 448 428 -30 >1000 85 >1000 449
>1000 >1000 333 152 -69 >1000 96 >1000 782
n/a n/a ++ -++ ++
All years Alert
++ ++
Species
Site
98 98 98 98 98 98 98 98 98 98 98 98
Great Crested Grebe Cormorant Mute Swan Wigeon Gadwall Teal Pintail Shoveler Pochard Tufted Duck Goldeneye Coot
Abberton Reservoir Abberton Reservoir Abberton Reservoir Abberton Reservoir Abberton Reservoir Abberton Reservoir Abberton Reservoir Abberton Reservoir Abberton Reservoir Abberton Reservoir Abberton Reservoir Abberton Reservoir
66 66 66 66 66 69 69 69 69
97 97 97 97 97 97 97 97 97
European White-fronted Goose Shelduck Wigeon Teal Shoveler Avocet Dunlin Black-tailed Godwit Redshank
Alde-Ore Estuary Alde-Ore Estuary Alde-Ore Estuary Alde-Ore Estuary Alde-Ore Estuary Alde-Ore Estuary Alde-Ore Estuary Alde-Ore Estuary Alde-Ore Estuary
++ ++ ++
-++
++ ++ ++
++ ++ ++
71 271 304
-74 234 5
177 196 >1000
82 302 >1000
69 69 69
98 98 98
Knot Sanderling Bar-tailed Godwit
Alt Estuary Alt Estuary Alt Estuary
n/a n/a n/a n/a n/a
++
++ ++ ++ ++ ++
n/a n/a n/a n/a n/a
n/a n/a n/a n/a n/a
201 -12 -35 19 124
>1000 81 495 444 74
n/a n/a n/a n/a n/a
73 73 73 73 73
98 98 98 98 98
Oystercatcher Ringed Plover Grey Plover Knot Dunlin
Benfleet and Southend Marshes Benfleet and Southend Marshes Benfleet and Southend Marshes Benfleet and Southend Marshes Benfleet and Southend Marshes
++
BTO Research Report No. 239 March 2000
5-year Alert
10-year Alert
25-year Alert
All years Alert
5-year change
10-year change
25 year change
All years change
First count
Last count
+
++
n/a
++
31
188
n/a
>1000
85
-
n/a
++
-40
-8
n/a
>1000
-
n/a
++
-31
-1
n/a
+
++
-43
-25
-42
-
-
++
50
Species
Site
98
Little Grebe
82
98
Great Crested Grebe
154
86
98
Cormorant
36
124
66
98
Dark-bellied Brent Goose
-11
3
-25
66
98
Shelduck
Blackwater Estuary (Mid-Essex Coast Phase 4) Blackwater Estuary (Mid-Essex Coast Phase 4) Blackwater Estuary (Mid-Essex Coast Phase 4) Blackwater Estuary (Mid-Essex Coast Phase 4) Blackwater Estuary (Mid-Essex Coast Phase 4) Blackwater Estuary (Mid-Essex Coast Phase 4) Blackwater Estuary (Mid-Essex Coast Phase 4) Blackwater Estuary (Mid-Essex Coast Phase 4) Blackwater Estuary (Mid-Essex Coast Phase 4) Blackwater Estuary (Mid-Essex Coast Phase 4) Blackwater Estuary (Mid-Essex Coast Phase 4) Blackwater Estuary (Mid-Essex Coast Phase 4) Blackwater Estuary (Mid-Essex Coast Phase 4) Blackwater Estuary (Mid-Essex Coast Phase 4) Blackwater Estuary (Mid-Essex Coast Phase 4) Blackwater Estuary (Mid-Essex Coast Phase 4) Blackwater Estuary (Mid-Essex Coast Phase 4) Blackwater Estuary (Mid-Essex Coast Phase 4)
++
-
-21
217
78
-26
66
98
Wigeon
++
++
-14
-10
568
996
66
98
Teal
++
-66
-29
-15
132
66
98
Pintail
--
-
--
-
++
++
-75
-45
98
>1000
66
98
Shoveler
--
--
-
+
-62
-70
-36
26
66
98
Goldeneye
++
18
14
-11
64
66
98
Red-breasted Merganser
++
-92
>1000
>1000
>1000
70
98
Avocet
++
46
-42
9
52
70
98
Ringed Plover
++
++
-40
167
571
448
70
98
Grey Plover
+
++
-38
-7
37
74
70
98
Dunlin
++
++
-9
165
>1000
>1000
70
98
Black-tailed Godwit
-
-58
-17
-18
-45
70
98
Curlew
-6
103
44
9
70
98
Redshank
-6 81 77 167 223 >1000 193 >1000
n/a 298 636 36 777 >1000 286 >1000
n/a >1000 -43 396 327 n/a n/a n/a
54 >1000 -29 481 >1000 >1000 41 >1000
86 66 66 66 66 72 72 72
95 95 95 95 95 95 95 95
Cormorant Bewick's Swan European White-fronted Goose Wigeon Shoveler Avocet Dunlin Black-tailed Godwit
--
++
+
-
-
++
++
++
--
++ ++ ++ ++ ++ ++ ++
++
+
n/a ++ ++ + ++ ++ ++ ++
n/a ++ ++ ++ n/a n/a n/a
++ ++ ++ ++ ++ + ++
Breydon Water Breydon Water Breydon Water Breydon Water Breydon Water Breydon Water Breydon Water Breydon Water
BTO Research Report No. 239 March 2000
5-year Alert
10-year Alert
25-year Alert
All years Alert
5-year change
10-year change
25 year change
All years change
First count
Last count
Species
Site
-
++
++
-8
-40
163
>1000
66
98
Shoveler
Chew Valley Lake
++
++
n/a
++
75
318
n/a
555
85
98
Little Grebe
-
-
n/a
+
-38
-48
n/a
46
86
98
Cormorant
++
-25
-20
18
353
66
98
Dark-bellied Brent Goose
--
--
-35
-60
-63
-63
66
98
Shelduck
+
++
-4
-14
29
70
66
98
Wigeon
+
++
++
35
49
89
543
66
98
Teal
-
++
++
-2
-30
112
595
66
98
Pintail
--
++
++
-29
-69
200
308
66
98
Shoveler
++
++
21
7
376
642
66
98
Red-breasted Merganser
++
++
15
-2
67
186
69
98
Oystercatcher
++
++
-37
-48
60
131
69
98
Ringed Plover
++
++
-28
-6
74
524
69
98
Grey Plover
-
++
-64
-49
-9
220
69
98
Knot
-
--
-11
-37
12
-66
69
98
Sanderling
-36
-42
-49
22
69
98
Dunlin
++
-12
-32
-57
73
69
98
Black-tailed Godwit
++
-36
-24
-22
131
69
98
Bar-tailed Godwit
++
11
27
11
184
69
98
Curlew
+
14
16
14
25
69
98
Redshank
Chichester and Langstone Harbours Chichester and Langstone Harbours Chichester and Langstone Harbours Chichester and Langstone Harbours Chichester and Langstone Harbours Chichester and Langstone Harbours Chichester and Langstone Harbours Chichester and Langstone Harbours Chichester and Langstone Harbours Chichester and Langstone Harbours Chichester and Langstone Harbours Chichester and Langstone Harbours Chichester and Langstone Harbours Chichester and Langstone Harbours Chichester and Langstone Harbours Chichester and Langstone Harbours Chichester and Langstone Harbours Chichester and Langstone Harbours Chichester and Langstone Harbours Chichester and Langstone Harbours
-
+
-
--
51 -
-
--
-
-
-
-
--
+
-
-
++
++
-30
-35
81
80
69
98
Turnstone
--
--
n/a
++
-75
-82
n/a
>1000
82
98
Great Crested Grebe
Colne Estuary (Mid-Essex Coast Phase 2)
239 239 239 No. No. No. Report Report Report Research Research Research BTO BTO BTO Report No. 239 BTO Research Research BTO 2000 2000 2000Report No. 239 March March March 2000 March 2000 March
5-year Alert
10-year Alert
25-year Alert
All years Alert
5-year change
10-year change
25 year change
All years change
First count
Last count
--
--
n/a
+
-76
-56
n/a
38
86
-
-
++
++
-38
-45
102
447
-
+
-46
-20
-39
-
Species
Site
98
Cormorant
66
98
Dark-bellied Brent Goose
44
66
98
Shelduck
Colne Estuary (Mid-Essex Coast Phase 2) Colne Estuary (Mid-Essex Coast Phase 2) Colne Estuary (Mid-Essex Coast Phase 2) Colne Estuary (Mid-Essex Coast Phase 2) Colne Estuary (Mid-Essex Coast Phase 2) Colne Estuary (Mid-Essex Coast Phase 2) Colne Estuary (Mid-Essex Coast Phase 2) Colne Estuary (Mid-Essex Coast Phase 2) Colne Estuary (Mid-Essex Coast Phase 2)
n/a
++
++
++
n/a
>1000
>1000
>1000
71
98
Avocet
++
++
++
++
111
98
324
392
71
97
Ringed Plover
++
++
n/a
15
565
485
71
98
Grey Plover
n/a
-28
14
-1
71
98
Dunlin
n/a
5263 7069 65 68 60 67 61l 58 59 62 64 66
n/a
-
n/a
--
++
++
n/a
-86
>1000
>1000
71
98
Black-tailed Godwit
n/a
+
-
--
n/a
26
-33
-61
71
98
Redshank
++
++
-19
-25
818
>1000
68
98
Dark-bellied Brent Goose
++
-51
-7
11
89
68
98
Shelduck
--
Crouch and Roach Estuaries (Mid-Essex Coast Phase 3) Crouch and Roach Estuaries (Mid-Essex Coast Phase 3) Crouch and Roach Estuaries (Mid-Essex Coast Phase 3)
++
++
++
++
131
>1000
>1000
>1000
71
98
Black-tailed Godwit
++
++
++ ++
++ ++
-36 54
22 >1000
>1000 >1000
>1000 >1000
70 69
98 98
Dark-bellied Brent Goose Avocet
Deben Estuary Deben Estuary
-
--
n/a
++
-29
-87
n/a
>1000
82
98
Great Crested Grebe
n/a
++
-74
-15
n/a
124
86
98
Cormorant
+
++
++
28
39
55
199
66
98
Dark-bellied Brent Goose
+
++
++
23
25
84
54
71
98
Oystercatcher
+
++
++
++
27
154
277
308
71
97
Grey Plover
++
+
++
++
78
46
95
100
71
98
Knot
+
++
++
20
31
113
181
71
97
Dunlin
++
++
++
-53
>1000
436
645
71
98
Black-tailed Godwit
Dengie (Mid-Essex Coast Phase 1) Dengie (Mid-Essex Coast Phase 1) Dengie (Mid-Essex Coast Phase 1) Dengie (Mid-Essex Coast Phase 1) Dengie (Mid-Essex Coast Phase 1) Dengie (Mid-Essex Coast Phase 1) Dengie (Mid-Essex Coast Phase 1) Dengie (Mid-Essex Coast Phase 1)
-+
Draft Draft Draft Draft
--
BTO Research Report No. 239 March 2000
5-year Alert
10-year Alert
25-year Alert
All years Alert
5-year change
10-year change
25 year change
All years change
First count
Last count
Species
Site
++
++
++
++
89
271
411
735
71
98
Bar-tailed Godwit
Dengie (Mid-Essex Coast Phase 1)
-
--
-28
-12
-29
-51
66
98
Bewick's Swan
>1000
66
97
Wigeon
>1000
>1000
66
98
Teal
Derwent Ings (part of Lower Derwent Valley) Derwent Ings (part of Lower Derwent Valley) Derwent Ings (part of Lower Derwent Valley)
++
++
++
1
64
427
n/a
++
++
++
.
169
--++ + --
n/a --
-++ ++
--
-++ + ++
-++ ++ -++ ++ ++
-73 -63 51 49 -88 -42 -16 7 5
. -54 12 13 -82 -26 16 19 19
-62 127 817 7 -71 194 35 173 19
-60 66 >1000 -37 -75 395 101 139 -6
67 67 67 71 71 71 71 71 71
98 98 98 98 98 98 98 98 98
Shelduck Pintail Red-breasted Merganser Oystercatcher Knot Sanderling Dunlin Curlew Redshank
Duddon Estuary Duddon Estuary Duddon Estuary Duddon Estuary Duddon Estuary Duddon Estuary Duddon Estuary Duddon Estuary Duddon Estuary
++ ++
n/a ++ --
++
+ ++ +
++ ++ ++ ++ ++
++
14 -40 94 -10 -27 -32 5 -5 51
51 -30 152 23 -30 10 69 -2 45
. 96 -63 25 36 >1000 26 -22 63
278 816 -30 100 52 >1000 19 -11 75
86 66 66 66 72 72 72 72 72
98 98 98 98 98 98 98 98 98
Cormorant Dark-bellied Brent Goose Wigeon Red-breasted Merganser Oystercatcher Avocet Grey Plover Dunlin Black-tailed Godwit
Exe Estuary Exe Estuary Exe Estuary Exe Estuary Exe Estuary Exe Estuary Exe Estuary Exe Estuary Exe Estuary
++
+
++
++
++
n/a
++
155
381
.
294
85
97
Little Grebe
++
++
-10
20
95
109
66
97
Dark-bellied Brent Goose
++
++
++
14
73
186
475
66
97
Shelduck
++
++
6
54
126
-12
66
97
Wigeon
Foulness (Mid-Essex Coast Phase 5) Foulness (Mid-Essex Coast Phase 5) Foulness (Mid-Essex Coast Phase 5) Foulness (Mid-Essex Coast Phase 5) Foulness (Mid-Essex Coast Phase 5) Foulness (Mid-Essex Coast Phase 5)
-
53 ++ -
++
++
++
++
-9
9
84
117
72
98
Oystercatcher
++
++
83
>1000
>1000
>1000
72
98
Avocet
5-year Alert
10-year Alert
25-year Alert
All years Alert
5-year change
10-year change
25 year change
All years change
First count
Last count
Species
Site
-
++
++
-25
1
510
633
72
98
Grey Plover
72
98
Knot
Foulness (Mid-Essex Coast Phase 5) Foulness (Mid-Essex Coast Phase 5) Foulness (Mid-Essex Coast Phase 5) Foulness (Mid-Essex Coast Phase 5) Foulness (Mid-Essex Coast Phase 5) Foulness (Mid-Essex Coast Phase 5) Foulness (Mid-Essex Coast Phase 5)
-
++
++
-30
18
197
177
+
+
++
++
43
28
51
80
72
98
Dunlin
++
++
++
++
264
>1000
>1000
>1000
72
98
Black-tailed Godwit
+
++
++
4
35
86
90
72
98
Bar-tailed Godwit
-9
-27
-16
-19
72
98
Curlew
+
++
++
50
20
82
86
72
98
Redshank
n/a
-++
++ ++ ++ ++ -++
++ ++ ++ ++ ++ ++ + ++
++ ++ ++ ++ ++ ++ ++ ++ ++
96 -40 25 32 9 20 44 43 19 -68 87
497 -26 190 310 16 768 63 260 100 -73 261
. 14 58 494 860 >1000 72 310 -41 41 101
749 401 109 -48 >1000 >1000 179 486 -29 122 205
85 66 66 66 66 72 72 72 72 72 72
98 98 98 98 98 98 98 98 98 98 98
Little Grebe Dark-bellied Brent Goose Shelduck Wigeon Teal Avocet Ringed Plover Grey Plover Dunlin Black-tailed Godwit Redshank
Hamford Water Hamford Water Hamford Water Hamford Water Hamford Water Hamford Water Hamford Water Hamford Water Hamford Water Hamford Water Hamford Water
n/a
++
n/a
++
.
88
.
1,801
66
98
Gadwall
Hornsea Mere
++
++
++
24
92
>1000
>1000
66
98
Dark-bellied Brent Goose
++
++
72
12
741
>1000
66
98
Shelduck
Humber Flats, Marshes and Coast (Phase 1) Humber Flats, Marshes and Coast (Phase 1) Humber Flats, Marshes and Coast (Phase 1) Humber Flats, Marshes and Coast (Phase 1) Humber Flats, Marshes and Coast (Phase 1) Humber Flats, Marshes and Coast (Phase 1) Humber Flats, Marshes and Coast (Phase 1)
++ + +
+ +
++ ++ ++
++ +
++
++
++
28
85
181
200
66
98
Wigeon
-
-
++
-
-39
-47
184
-31
66
98
Teal
--
--
--
--
-61
-80
-64
-67
66
98
Mallard
--
-
++
++
-86
-38
>1000
>1000
66
98
Pochard
++
++
++
-25
360
868
>1000
66
98
Goldeneye
5-year Alert
10-year Alert
25-year Alert
All years Alert
5-year change
10-year change
25 year change
All years change
First count
Last count
-
-
++
++
-44
-33
51
475
69
++
++
17
0
264
737
++
++
15
55
697
++
-20
-27
-53 ++
++ -
Species
Site
98
Oystercatcher
69
98
Ringed Plover
>1000
69
98
Grey Plover
3
53
69
98
Knot
-45
-18
16
69
98
Sanderling
48
49
22
51
69
98
Dunlin
Humber Flats, Marshes and Coast (Phase 1) Humber Flats, Marshes and Coast (Phase 1) Humber Flats, Marshes and Coast (Phase 1) Humber Flats, Marshes and Coast (Phase 1) Humber Flats, Marshes and Coast (Phase 1) Humber Flats, Marshes and Coast (Phase 1) Humber Flats, Marshes and Coast (Phase 1) Humber Flats, Marshes and Coast (Phase 1) Humber Flats, Marshes and Coast (Phase 1) Humber Flats, Marshes and Coast (Phase 1)
--
-
+
+
++
+
++
++
53
43
480
>1000
69
98
Bar-tailed Godwit
++
+
++
++
74
34
81
228
69
98
Curlew
++
++
19
21
62
397
69
98
Redshank
+
++
++
29
45
149
230
69
98
Turnstone
--
-+ ---++ --
-++ -++
+
-22 3 0 -31 -53 18 -19 -18 9 -1 30
-80 2 -13 -50 -87 -3 54 -21 29 -46 -64
-95 46 -63 -74 -65 694 -73 -15 -58 -32 -2
-92 163 -81 >1000 -9 >1000 -77 99 29 2 32
66 66 66 66 70 70 70 70 70 70 70
98 98 98 98 98 98 98 98 98 98 98
Whooper Swan Shelduck Wigeon Red-breasted Merganser Ringed Plover Grey Plover Knot Sanderling Dunlin Bar-tailed Godwit Redshank
Lindisfarne Lindisfarne Lindisfarne Lindisfarne Lindisfarne Lindisfarne Lindisfarne Lindisfarne Lindisfarne Lindisfarne Lindisfarne
+
--
--++
+ -++ ---++ --
++ -++ +
+ --
--
-++ --++
++ ++ ++ n/a n/a -++
++ n/a ++ + ++ ++
-92 80 -86 -62 -21 -55 50
-95 75 -92 -48 -33 -75 >1000
>1000 >1000 138 n/a n/a -94 >1000
>1000 n/a >1000 35 >1000 -46 >1000
66 73 66 74 74 66 66
98 98 98 98 98 98 98
Bewick's Swan Whooper Swan Wigeon Teal Mallard Pintail Pochard
Martin Mere Martin Mere Martin Mere Martin Mere Martin Mere Martin Mere Martin Mere
n/a
++
-72
-18
n/a
>1000
85
98
Little Grebe
Medway Estuary and Marshes
5-year Alert
10-year Alert
25-year Alert
All years Alert
5-year change
10-year change
25 year change
All years change
First count
Last count
-
-++ -+ n/a n/a n/a n/a n/a n/a n/a n/a n/a n/a
n/a n/a ++ ++
++ ++ ++ ++ ++
++
++ ++ ++
-43 -20 >1000 -37 -40 20 -5 -21 -14 -57 208 22 247 -69 -9 320 -61 -43 -28 -41 -57
-66 -45 >1000 -32 -35 -33 -44 -38 -47 -90 37 n/a n/a n/a n/a n/a n/a n/a n/a n/a n/a
n/a n/a >1000 235 16 -58 n/a n/a -54 . -88 346 >1000 40 194 -31 20 262 42 7 161
71 83 >1000 >1000 156 -25 55 92 176 -52 239 >1000 >1000 323 >1000 787 251 11 171 187 949
82 86 66 66 66 66 66 66 66 66 66 70 70 70 70 70 70 70 70 70 70
n/a ++ ++ + -++ + ++ + ++
++ ++ ++ ++ ++ ++ ++ ++ ++
-62 7 2 -11 -65 -17 15 >1000 4 7
-23 48 114 -3 -88 179 96 >1000 -10 22
n/a 73 260 29 -94 >1000 47 >1000 38 291
233 >1000 >1000 856 -37 >1000 269 >1000 85 596
++ ++ +
++ ++ +
112 28 28
-14 54 72
5,219 58 26
4
-16
7
++ -
-++ ++ -++ ----
+ ++ --
++
-++ ++ ++
++ + +
++ ++
-n/a n/a -n/a -++ ++ + ++ ++ +
++ ++ ++ -++ ++ ++ ++ ++ ++ ++
Species
Site
98 98 98 98 98 98 98 98 98 98 98 98 98 98 98 98 98 98 98 98 98
Great Crested Grebe Cormorant Bewick's Swan Dark-bellied Brent Goose Shelduck Wigeon Teal Mallard Pintail Shoveler Pochard Oystercatcher Avocet Ringed Plover Grey Plover Knot Dunlin Black-tailed Godwit Curlew Redshank Turnstone
Medway Estuary and Marshes Medway Estuary and Marshes Medway Estuary and Marshes Medway Estuary and Marshes Medway Estuary and Marshes Medway Estuary and Marshes Medway Estuary and Marshes Medway Estuary and Marshes Medway Estuary and Marshes Medway Estuary and Marshes Medway Estuary and Marshes Medway Estuary and Marshes Medway Estuary and Marshes Medway Estuary and Marshes Medway Estuary and Marshes Medway Estuary and Marshes Medway Estuary and Marshes Medway Estuary and Marshes Medway Estuary and Marshes Medway Estuary and Marshes Medway Estuary and Marshes
82 66 66 66 66 70 70 70 70 70
98 98 98 98 98 98 98 98 98 98
Great Crested Grebe Shelduck Wigeon Teal Pintail Grey Plover Dunlin Black-tailed Godwit Curlew Redshank
Mersey Estuary Mersey Estuary Mersey Estuary Mersey Estuary Mersey Estuary Mersey Estuary Mersey Estuary Mersey Estuary Mersey Estuary Mersey Estuary
992 126 39
66 66 66
98 98 98
European White-fronted Goose Minsmere - Walberswick Gadwall Minsmere - Walberswick Shoveler Minsmere - Walberswick
20
69
98
Oystercatcher
Morecambe Bay
5-year Alert
10-year Alert
25-year Alert
All years Alert
5-year change
10-year change
25 year change
All years change
First count
Last count
Species
Site
++
++ ++
-32 159 59 -13 713 110 -13 -2 -25
-15 231 47 -5 627 185 11 -4 -37
671 4 268 -26 >1000 -52 25 -24 -37
894 0 166 -17 >1000 -53 76 15 -24
69 69 69 69 69 69 69 69 69
98 98 98 98 98 98 98 98 98
Grey Plover Knot Sanderling Dunlin Black-tailed Godwit Bar-tailed Godwit Curlew Redshank Turnstone
Morecambe Bay Morecambe Bay Morecambe Bay Morecambe Bay Morecambe Bay Morecambe Bay Morecambe Bay Morecambe Bay Morecambe Bay
6,272 179 -27 -14 -4 183 239 32 99 165 -21 >1000 138 176 9 585 52 143 208
n/a n/a >1000 640 55 408 995 899 >1000 118 n/a n/a n/a n/a n/a . n/a n/a n/a
>1000 317 >1000 >1000 127 >1000 >1000 >1000 >1000 >1000 15 >1000 101 329 -29 1,260 44 204 219
85 86 67 67 67 68 66 67 66 67 84 84 84 84 84 84 84 84 84
98 98 98 98 98 98 98 98 98 98 98 98 98 98 98 98 98 98 98
Little Grebe Cormorant European White-fronted Goose Dark-bellied Brent Goose Shelduck Wigeon Gadwall Teal Pintail Shoveler Oystercatcher Avocet Ringed Plover Grey Plover Knot Sanderling Dunlin Bar-tailed Godwit Redshank
North Norfolk Coast North Norfolk Coast North Norfolk Coast North Norfolk Coast North Norfolk Coast North Norfolk Coast North Norfolk Coast North Norfolk Coast North Norfolk Coast North Norfolk Coast North Norfolk Coast North Norfolk Coast North Norfolk Coast North Norfolk Coast North Norfolk Coast North Norfolk Coast North Norfolk Coast North Norfolk Coast North Norfolk Coast Orfordness-Havergate (part of Alde-Ore Estuary) Orfordness-Havergate (part of Alde-Ore Estuary)
++ ++
++ +
++ ++
++ ++
++ ++ --
-
-
++ ++ -
++ ++ ++ ++ ++ ++ ++ ++ ++ ++
++ ++
++ ++ ++ ++
n/a n/a ++ ++ ++ ++ ++ ++ ++ ++ n/a n/a n/a n/a n/a n/a n/a n/a n/a
++ ++ ++ ++ + ++ ++
169 -37 0 -25 -8 -7 46 24 25 -19 33 >1000 80 39 21 128 24 107 150
++
++
++
++
275
121
>1000
>1000
69
97
Avocet
++
++
++
++
>1000
>1000
>1000
>1000
69
97
Redshank
--
-
n/a ++ ++
+ ++
-60 -18 24
-43 4 18
. 94 367
-26 31 490
86 66 66
98 98 98
Cormorant Mute Swan Bewick's Swan
++ -
+
+ ++ ++ + ++
++ ++ + ++ ++ ++ ++ ++
++ -++
Ouse Washes Ouse Washes Ouse Washes
5-year Alert
10-year Alert
25-year Alert
All years Alert
5-year change
10-year change
25 year change
All years change
First count
Last count
Species
Site
+ + ++ +
++ -++
++ -++ + -
29 -47 27 54 -45 28 0 133 16 -28
125 -56 77 -16 -41 30 29 315 129 48
>1000 -55 620 31 -32 4 -1 >1000 384 .
>1000 36 492 336 -41 40 -50 193 116 -35
66 66 66 66 66 66 66 66 66 82
98 98 98 98 98 98 98 98 98 98
Whooper Swan Wigeon Gadwall Teal Mallard Pintail Shoveler Pochard Tufted Duck Coot
Ouse Washes Ouse Washes Ouse Washes Ouse Washes Ouse Washes Ouse Washes Ouse Washes Ouse Washes Ouse Washes Ouse Washes
-54 60
-52 277
219 >1000
>1000 >1000
66 66
98 98
Dark-bellied Brent Goose Pintail
Pagham Harbour Pagham Harbour
++ ++ ++ ++ ++ ++ ++ +
-4 -9 -24 -6 -43 44 -1 39 22 23 -9 -13
-16 156 7 25 -55 54 23 838 87 85 30 -6
n/a >1000 2 -27 284 144 182 >1000 158 235 121 1
-15 >1000 73 2 553 482 >1000 >1000 199 904 105 41
86 66 66 66 66 66 66 69 69 69 69 69
98 98 98 98 98 98 98 98 98 98 98 98
Cormorant Dark-bellied Brent Goose Shelduck Shoveler Pochard Goldeneye Red-breasted Merganser Avocet Dunlin Black-tailed Godwit Curlew Redshank
Poole Harbour Poole Harbour Poole Harbour Poole Harbour Poole Harbour Poole Harbour Poole Harbour Poole Harbour Poole Harbour Poole Harbour Poole Harbour Poole Harbour
++
++
-28
-6
676
12,621
68
98
Dark-bellied Brent Goose
Portsmouth Harbour
++
n/a
++
33
108
.
433
86
98
Cormorant
16
29
800
>1000
66
98
Bewick's Swan
++
-82
-59
>1000
>1000
66
98
Whooper Swan
++
++
-7
-23
63
451
66
98
Shelduck
++
++
30
83
>1000
>1000
66
98
Wigeon
Ribble and Alt Estuaries (Phase 2) Ribble and Alt Estuaries (Phase 2) Ribble and Alt Estuaries (Phase 2) Ribble and Alt Estuaries (Phase 2) Ribble and Alt Estuaries (Phase 2)
+
++
++
--
++
-
+ + ++ ++ +
++ ++ n/a
++ + ++ ++ + -++ ++ -
-++
-++
++ ++
++ ++
++
n/a ++
++
+ +
+ -++ ++ ++ ++ +
+
--
+
++
++ ++ ++ ++ ++ ++ ++
++ ++
5-year Alert
10-year Alert
25-year Alert
All years Alert
5-year change
10-year change
25 year change
All years change
First count
Last count
++
++
-11
0
620
>1000
66
++
23
306
-17
>1000
++
++
15
17
334
++
Species
Site
98
Teal
66
98
Pintail
>1000
69
98
Oystercatcher
Ribble and Alt Estuaries (Phase 2) Ribble and Alt Estuaries (Phase 2) Ribble and Alt Estuaries (Phase 2) Ribble and Alt Estuaries (Phase 2) Ribble and Alt Estuaries (Phase 2) Ribble and Alt Estuaries (Phase 2) Ribble and Alt Estuaries (Phase 2) Ribble and Alt Estuaries (Phase 2) Ribble and Alt Estuaries (Phase 2) Ribble and Alt Estuaries (Phase 2) Ribble and Alt Estuaries (Phase 2)
++
++
++
++
91
60
936
908
69
98
Grey Plover
-
--
-
-
-40
-71
-38
-28
69
98
Knot
++
30
-5
-19
83
69
98
Sanderling
+ ++
-
++
0
117
-47
53
69
98
Dunlin
-
++
++
1
-37
>1000
>1000
69
98
Black-tailed Godwit
-
++
++
-15
-38
137
170
69
98
Bar-tailed Godwit
++
++
++
11
91
115
141
69
98
Curlew
++
-35
-9
18
121
69
98
Redshank
++ ++ ++ ++ ---++
++ ++ ++ ++ --
16 -7 30 12 -67 -26 -8 2 -63
29 -22 84 3 -65 -47 155 -38 -61
800 62 >1000 268 -67 -55 -50 >1000 0
>1000 468 >1000 867 -67 -10 1 in -3
66 66 66 70 70 70 70 70 70
98 98 98 98 98 98 98 98 98
Bewick's Swan Shelduck Wigeon Oystercatcher Knot Sanderling Dunlin Black-tailed Godwit Bar-tailed Godwit
Ribble Estuary Ribble Estuary Ribble Estuary Ribble Estuary Ribble Estuary Ribble Estuary Ribble Estuary Ribble Estuary Ribble Estuary
n/a n/a n/a n/a n/a n/a n/a n/a n/a
++ ++ ++ ++ ++ ++ ++ ++
46 -2 -67 26 1 0 36 -2 13
35 25 47 29 -10 -30 65 -6 48
n/a n/a n/a n/a n/a n/a n/a n/a n/a
849 105 664 >1000 133 >1000 139 134 -7
85 82 86 75 75 75 75 75 75
98 98 98 98 98 98 98 98 98
Little Grebe Great Crested Grebe Cormorant Mute Swan Wigeon Gadwall Teal Shoveler Pochard
Rutland Water Rutland Water Rutland Water Rutland Water Rutland Water Rutland Water Rutland Water Rutland Water Rutland Water
-
+ +
++
--
-++ --
-+ -+
+ + + +
+
++ +
++
5-year Alert
10-year Alert
25-year Alert
All years Alert
5-year change
10-year change
25 year change
All years change
First count
Last count
+
n/a n/a n/a n/a
++ ++ ++
30 -7 17 10
-9 22 19 1
n/a n/a n/a n/a
337 >1000 >1000 -5
75 75 75 82
-
++
-25
-14
52
0
-
-8
-41
-3
++
-15
26
24
+
++ ++
Species
Site
98 98 98 98
Tufted Duck Goldeneye Goosander Coot
Rutland Water Rutland Water Rutland Water Rutland Water
66
98
Bewick's Swan
-41
66
98
132
252
66
98
-3
59
-10
66
98
-
++
++
-22
-34
263
211
66
98
+
++
++
++
36
107
219
217
66
98
-
-
-
-
-32
-43
-31
-47
66
98
++
++
-15
15
108
51
66
98
36
99
305
-1
66
98
+
++
++
-
++
++
-18
-34
>1000
>1000
66
98
++
++
-30
-23
963
>1000
66
98
++
-56
-52
-27
131
69
98
-31
-35
-52
-25
69
98
8
-17
-5
25
69
98
-25 -8 -12 31 -22 102 -32 -1 43 -4
-14 -41 96 5 -34 220 -41 51 113 -21
52 -3 65 60 263 246 -40 28 594 >1000
0 -41 258 -10 211 326 -49 3 9 >1000
66 66 66 66 66 66 66 66 66 66
98 98 98 98 98 98 98 98 98 98
--
--
-
-
-
--
-
++ ++
+ ++ +
++ ++ ++
++ ++ ++ ++ + ++ ++
++ ++ ++ -
++
Severn Estuary - England & Wales European White-fronted Goose Severn Estuary - England & Wales Shelduck Severn Estuary - England & Wales Wigeon Severn Estuary - England & Wales Gadwall Severn Estuary - England & Wales Teal Severn Estuary - England & Wales Mallard Severn Estuary - England & Wales Pintail Severn Estuary - England & Wales Shoveler Severn Estuary - England & Wales Pochard Severn Estuary - England & Wales Tufted Duck Severn Estuary - England & Wales Grey Plover Severn Estuary - England & Wales Dunlin Severn Estuary - England & Wales Redshank Severn Estuary - England & Wales Bewick's Swan European White-fronted Goose Shelduck Wigeon Gadwall Teal Mallard Pintail Shoveler Pochard
Severn Estuary - England only Severn Estuary - England only Severn Estuary - England only Severn Estuary - England only Severn Estuary - England only Severn Estuary - England only Severn Estuary - England only Severn Estuary - England only Severn Estuary - England only Severn Estuary - England only
5-year Alert
10-year Alert
25-year Alert
All years Alert
5-year change
10-year change
25 year change
All years change
First count
Last count
+ +
++ ++ -
++ ++
-1 -58 12 85
26 -35 -27 45
562 133 -49 -4
>1000 242 -3 75
66 69 69 69
++
n/a n/a n/a ++
++ +
++ ++
--
+ -
--
--
-
++ ++ ++ ++ +
-
-
++ ++ ++ ++ ++
1 -35 -13 -27 -4 95 -5 2 -8 -64 -19 -52 -23 -16 -68 4 -14
130 14 22 -4 -10 118 46 -7 40 -50 13 -55 22 7 -30 11 -29
n/a n/a n/a >1000 -24 469 >1000 8 404 427 107 -35 120 -37 36 16 -49
>1000 85 279 >1000 >1000 293 >1000 560 >1000 >1000 >1000 6 405 112 207 157 60
n/a n/a n/a n/a n/a n/a n/a
++ ++ ++ -++
++ ++ ++ -++ ++ ++
97 158 274 -64 124 -11 15
n/a n/a n/a n/a n/a n/a n/a
>1000 >1000 >1000 -59 366 2 152
+ -
n/a n/a ++ ++ -
++
-14 -18 29 -8 -38 -21 -30
36 -36 10 12 -3 35 3
n/a n/a -39 406 -29 74 -27
-++
++
--
++ ++ ++ -++
+ + -
++
++
++ ++ ++ ++ ++ ++ ++ ++ ++ ++ ++
-++ --
Species
Site
98 98 98 98
Tufted Duck Grey Plover Dunlin Redshank
Severn Estuary - England only Severn Estuary - England only Severn Estuary - England only Severn Estuary - England only
85 82 86 66 66 66 66 66 66 66 66 69 69 69 69 69 69
98 98 98 98 98 98 98 98 98 98 98 98 98 98 98 98 98
Little Grebe Great Crested Grebe Cormorant Dark-bellied Brent Goose Shelduck Wigeon Gadwall Teal Pintail Shoveler Red-breasted Merganser Ringed Plover Grey Plover Dunlin Black-tailed Godwit Curlew Redshank
Solent and Southampton Water Solent and Southampton Water Solent and Southampton Water Solent and Southampton Water Solent and Southampton Water Solent and Southampton Water Solent and Southampton Water Solent and Southampton Water Solent and Southampton Water Solent and Southampton Water Solent and Southampton Water Solent and Southampton Water Solent and Southampton Water Solent and Southampton Water Solent and Southampton Water Solent and Southampton Water Solent and Southampton Water
>1000 >1000 >1000] -80 >1000 594 >1000
66 66 66 66 66 66 66
98 98 98 98 98 98 98
European White-fronted Goose Wigeon Gadwall Mallard Shoveler Pochard Tufted Duck
Stodmarsh Stodmarsh Stodmarsh Stodmarsh Stodmarsh Stodmarsh Stodmarsh
195 -17 -65 449 -17 -60 11
82 86 66 66 66 66 66
98 98 98 98 98 98 98
Great Crested Grebe Cormorant Mute Swan Dark-bellied Brent Goose Shelduck Wigeon Pintail
Stour and Orwell Estuaries Stour and Orwell Estuaries Stour and Orwell Estuaries Stour and Orwell Estuaries Stour and Orwell Estuaries Stour and Orwell Estuaries Stour and Orwell Estuaries
5-year Alert
10-year Alert
+ -+ -
++ -++ ++ +
25-year Alert
All years Alert
5-year change
10-year change
25 year change
All years change
First count
Last count
Species
Site
++ ++ ++ ++
++ ++ ++ ++
++ ++ ++
++ ++ + ++
28 20 -66 -34 25 -28 11 -2 -6 23
24 53 -68 19 115 -17 82 23 48 10
128 572 7 433 513 -6 271 93 -28 142
96 >1000 -29 >1000 >1000 14 >1000 107 45 529
66 70 70 70 70 70 70 70 70 70
98 98 98 98 98 98 98 98 98 98
Goldeneye Oystercatcher Ringed Plover Grey Plover Knot Dunlin Black-tailed Godwit Curlew Redshank Turnstone
Stour and Orwell Estuaries Stour and Orwell Estuaries Stour and Orwell Estuaries Stour and Orwell Estuaries Stour and Orwell Estuaries Stour and Orwell Estuaries Stour and Orwell Estuaries Stour and Orwell Estuaries Stour and Orwell Estuaries Stour and Orwell Estuaries
++
++
++
++
105
98
107
132
69
98
Avocet
Tamar Estuaries Complex
--
--
+
+
-++ -++
-++ -+
-70 -4 -12 48
-70 -4 -4 26
-69 >1000 -54 136
-84 >1000 -77 27
66 66 69 69
98 98 98 98
Shelduck Shoveler Knot Redshank
Teesmouth and Cleveland Coast Teesmouth and Cleveland Coast Teesmouth and Cleveland Coast Teesmouth and Cleveland Coast
n/a -+ ++ + ++ ++ ++ ++
++ --
++ -
++ -
-22 -20 -24 68 -76 46 102 -36 -28 38 -35 -23
93 -81 -20 196 -85 -30 >1000 -19 19 64 257 -44
. -82 46 >1000 34 268 >1000 451 226 15 >1000 -39
722 -93 -24 >1000 -9 235 >1000 508 220 5 >1000 -39
85 66 66 66 66 66 72 72 72 72 72 72
98 98 98 98 98 98 98 98 98 98 98 98
Little Grebe European White-fronted Goose Shelduck Gadwall Pintail Shoveler Avocet Grey Plover Knot Dunlin Black-tailed Godwit Redshank
Thames Estuary and Marshes Thames Estuary and Marshes Thames Estuary and Marshes Thames Estuary and Marshes Thames Estuary and Marshes Thames Estuary and Marshes Thames Estuary and Marshes Thames Estuary and Marshes Thames Estuary and Marshes Thames Estuary and Marshes Thames Estuary and Marshes Thames Estuary and Marshes
+
-90
-72
-13
37
69
98
Turnstone
Thanet Coast and Sandwich Bay
++ ++ ++ ++
42 53 146 -27
57 4 166 -43
. 87 840 436
331 90 >1000 >1000
86 66 66 66
98 98 98 98
Cormorant Shelduck Wigeon Teal
The Dee Estuary The Dee Estuary The Dee Estuary The Dee Estuary
++ -++ -+ ++ + -
++ -++
--
--
+ ++ ++ -
++
++ ++ -
++ -
n/a ++ ++ ++
++ ++ ++ ++ ++
5-year Alert
-++
+
10-year Alert
25-year Alert
All years Alert
5-year change
10-year change
25 year change
All years change
First count
Last count
-++ ++ ++ ++ -
++ ++ ++ --
++ ++ ++ --
++ -++ ++ ++
++ -++ ++ ++
6 -22 -34 -55 52 -11 16 30 -22 64
-34 -41 -35 -56 96 68 161 56 -39 -23
178 74 177 -83 -23 54 -92 137 96 297
713 228 344 -81 -16 91 -90 236 221 329
66 70 70 70 70 70 70 70 70 70
++ --
n/a n/a ++ ++ ++ ++ ++ ++ ++ ++
++ ++ ++ ++ ++ ++ ++ ++ ++
++ ++ ++
++ ++ ++ ++ ++
61 -13 -29 63 3 28 82 -28 -54 23 1 83 58 71 -45 1 0 2 -19 22
>1000 -46 -50 5 83 129 101 50 2 -31 n/a n/a n/a n/a n/a n/a n/a n/a n/a n/a
n/a n/a 79 268 91 497 >1000 733 >1000 662 22 >1000 208 379 -9 42 >1000 -14 42 36
>1000 -27 75 >1000 >1000 425 >1000 >1000 >1000 >1000 -4 >1000 -4 185 -42 94 >1000 -43 -36 70
++ ++
-69 0 -92 -88 -44 -24
-12 18 -89 -50 92 -24
n/a n/a -32 9 -95 440
21 77 -34 -41 -36 >1000
++ ++ ++ + ++ --
++ ++ ++ -
++ ++ ++ + n/a n/a n/a n/a n/a n/a n/a n/a n/a n/a
----
-++
+ ++ + + n/a n/a -++
Species
Site
98 98 98 98 98 98 98 98 98 98
Pintail Oystercatcher Grey Plover Knot Dunlin Black-tailed Godwit Bar-tailed Godwit Curlew Redshank Turnstone
The Dee Estuary The Dee Estuary The Dee Estuary The Dee Estuary The Dee Estuary The Dee Estuary The Dee Estuary The Dee Estuary The Dee Estuary The Dee Estuary
85 86 66 66 66 66 66 66 66 66 69 69 69 69 69 69 69 69 69 69
98 98 98 98 98 98 98 98 98 98 98 98 98 98 98 98 98 98 98 98
Little Grebe Cormorant European White-fronted Goose Dark-bellied Brent Goose Shelduck Wigeon Gadwall Teal Pintail Shoveler Oystercatcher Avocet Ringed Plover Grey Plover Knot Dunlin Black-tailed Godwit Bar-tailed Godwit Curlew Redshank
The Swale The Swale The Swale The Swale The Swale The Swale The Swale The Swale The Swale The Swale The Swale The Swale The Swale The Swale The Swale The Swale The Swale The Swale The Swale The Swale
85 86 66 66 66 66
98 98 98 98 98 98
Little Grebe Cormorant Bewick's Swan Whooper Swan European White-fronted Goose Dark-bellied Brent Goose
The Wash The Wash The Wash The Wash The Wash The Wash
5-year Alert
10-year Alert
25-year Alert
All years Alert
5-year change
10-year change
25 year change
All years change
First count
Last count
-
-
+ -++
++
-30 -46 9 -14 -59 -32 -36 -3 173 -17 -34 4 4 168 29 13 14 -1
-46 -26 13 -43 -98 -54 -66 >1000 417 -21 -49 -40 -36 >1000 24 15 -36 -46
36 -58 >1000 0 297 -73 -21 >1000 599 136 -11 -17 -26 >1000 280 19 17 -18
414 -12 >1000 84 317 706 -6 >1000 573 284 -46 -28 -11 >1000 338 0 7 -3
66 66 66 68 66 68 70 70 70 70 70 70 70 70 70 70 70 70
212 18 -76 9 120 10 241 -78 -67 33
n/a n/a 89 101 737 98 353 -65 293 13
>1000 25 >1000 204 >1000 186 305 -21 -36 98
63 31 31 -28 19 354 -36 13 46
-81 638 -70 -57 -27 -57 -69 -24 -33
-36 >1000 -47 254 143 -46 -45 129 29
-++ -
++ +
---++ ++ ++
++ -++ ++ ++
++ ++
++ ++ ++ ++ ++ ++ ++ ++ ++
++
n/a n/a ++ ++ ++ ++ ++ -++
++ + ++ ++ ++ ++ ++ ++
10 32 -57 29 301 4 106 47 -63 27
++ -
-++ -----
+
-
++ ++ ++ ++ +
53 -29 -45 -26 -9 40 11 -1 19
+ -+ ++
++
++ + -+
++ --+
++ -
++ + + -
+
--
Species
Site
98 98 98 98 98 98 98 98 98 98 98 98 98 98 98 98 98 98
Shelduck Wigeon Gadwall Mallard Pintail Goldeneye Oystercatcher Avocet Ringed Plover Grey Plover Knot Sanderling Dunlin Black-tailed Godwit Bar-tailed Godwit Curlew Redshank Turnstone
The Wash The Wash The Wash The Wash The Wash The Wash The Wash The Wash The Wash The Wash The Wash The Wash The Wash The Wash The Wash The Wash The Wash The Wash
82 86 66 66 66 66 66 66 66 69
98 98 98 98 98 98 98 98 98 98
Great Crested Grebe Cormorant Whooper Swan Shelduck Teal Mallard Pintail Shoveler Goldeneye Oystercatcher
Upper Solway Flats and Marshes Upper Solway Flats and Marshes Upper Solway Flats and Marshes Upper Solway Flats and Marshes Upper Solway Flats and Marshes Upper Solway Flats and Marshes Upper Solway Flats and Marshes Upper Solway Flats and Marshes Upper Solway Flats and Marshes Upper Solway Flats and Marshes
69 69 69 69 69 69 69 69 69
98 98 98 98 98 98 98 98 98
Ringed Plover Grey Plover Knot Sanderling Dunlin Black-tailed Godwit Bar-tailed Godwit Curlew Redshank
Upper Solway Flats and Marshes Upper Solway Flats and Marshes Upper Solway Flats and Marshes Upper Solway Flats and Marshes Upper Solway Flats and Marshes Upper Solway Flats and Marshes Upper Solway Flats and Marshes Upper Solway Flats and Marshes Upper Solway Flats and Marshes
5-year Alert
10-year Alert
25-year Alert
-
-
--
-
n/a
All years Alert
++
5-year change
10-year change
25 year change
All years change
First count
Last count
Species
Site
-27
-46
-61
-7
69
98
Turnstone
Upper Solway Flats and Marshes
-28
-23
.
79
67
98
Bewick's Swan
Walmore Common
3,000
Little Grebe
2,500
Number of birds
Number of birds
3,000
2,000 1,500 1,000 500
Whooper Swan
2,500 2,000 1,500 1,000 500
1965
1970
1975
1980
1985
1990
1995
2000
1965
1970
1975
1980
9,000 8,000 7,000 6,000 5,000 4,000 3,000 2,000 1,000
Great Crested Grebe
1965
1970
1975
1980
1985
1990
1995
2000
10,000 9,000 8,000 7,000 6,000 5,000 4,000 3,000 2,000 1,000 1965
8,000 6,000 4,000
1970
1975
1980
1985
1990
1995
2000
1990
1995
2000
1990
1995
2000
60,000 50,000 40,000 30,000 20,000 10,000
1965
1970
1975
1980
1985
1990
1995
1965
2000
1970
1975
12,000
1980
1985
Years
Years 35,000
Mute Swan
Canada Goose
30,000
10,000
Number of birds
Number of birds
2000
Feral Greylag Goose
70,000
Number of birds
Number of birds
80,000
Cormorant
2,000
8,000 6,000 4,000 2,000
25,000 20,000 15,000 10,000 5,000
1965
1970
1975
1980
1985
1990
1995
2000
1965
Years 140,000
Bewick's Swan
Number of birds
5,000 4,000 3,000 2,000
1980
1985
Dark-bellied Brent Goose
100,000 80,000 60,000 40,000 20,000
1,000 1970
1975
1980
1985
1990
1995
2000
1965 1970 1975 1980 1985 1990 1995 2000
Years
Figure 3.1
1975
120,000
6,000
1965
1970
Years
7,000
Number of birds
1995
Years
10,000
8,000
1990
European White-fronted Goose
Years 12,000
1985
Years
Number of birds
Number of birds
Years
Years
English waterbird Underhill and smoothed GAM indices for regularly indexed wildfowl species.
BTO Research Report No. 239 March 2000
66
70,000
30,000
Shelduck Number of birds
Number of birds
60,000 50,000 40,000 30,000 20,000
Pintail
25,000 20,000 15,000 10,000 5,000
10,000 1965
1970
1975
1980
1985
1990
1995
2000
1965
1970
1975
Years 350,000
Wigeon
Number of birds
Number of birds
250,000 200,000 150,000 100,000 50,000
9,000 8,000 7,000 6,000 5,000 4,000 3,000 2,000 1,000
1970
1975
35,000
Gadwall
2000
1980
1985
1990
1995
2000
1990
1995
2000
1990
1995
2000
1990
1995
2000
Pochard
30,000
Number of birds
Number of birds
1995
Years
Years
25,000 20,000 15,000 10,000 5,000
1965
1970
1975
1980
1985
1990
1995
1965
2000
1970
1975
120,000
40,000
Teal
35,000 Number of birds
100,000 80,000 60,000 40,000 20,000
Tufted Duck
25,000 20,000 15,000 10,000 5,000 1965
1970
1975
Years
1980
1985
Years 4,000
Mallard
3,500
Number of birds
120,000 100,000 80,000 60,000 40,000 20,000
Goldeneye
3,000 2,500 2,000 1,500 1,000 500
1965 1970 1975 1980 1985 1990 1995 2000
1965
Years
Figure 3.1
1985
30,000
1965 1970 1975 1980 1985 1990 1995 2000
140,000
1980
Years
Years
Number of birds
1990
Shoveler
1965
1965 1970 1975 1980 1985 1990 1995 2000
Number of birds
1985
Years
300,000
9,000 8,000 7,000 6,000 5,000 4,000 3,000 2,000 1,000
1980
1975
1980
1985
Years
Continued.
BTO Research Report No. 239 March 2000
1970
67
3,500
Red-breasted Merganser
Ruddy Duck
3,000
Number of birds
Number of birds
2,000 1,800 1,600 1,400 1,200 1,000 800 600 400 200
2,500 2,000 1,500 1,000 500
1965
1970
1975
1980
1985
1990
1995
2000
1965
1970
1975
Years
3,500
Number of birds
Number of birds
3,000 2,500 2,000 1,500 1,000 500 1970
1975
1980
1985
1990
1995
2000
1990
1995
2000
1990
1995
2000
Coot
1970
1975
1980
1985
Years
Continued.
BTO Research Report No. 239 March 2000
90,000 80,000 70,000 60,000 50,000 40,000 30,000 20,000 10,000
1965
Years
Figure 3.1
1985
Years
Goosander
1965
1980
68
600,000
Number of birds
Number of birds
180,000 Oystercatcher 160,000 140,000 120,000 100,000 80,000 60,000 40,000 20,000 0 1965 1970 1975 1980 1985 1990 1995 2000
Dunlin
500,000 400,000 300,000 200,000 100,000 0 1965 1970 1975 1980 1985 1990 1995 2000
Years 12,000
4,000
Avocet
Number of birds
3,500
Number of birds
Years
3,000 2,500 2,000 1,500 1,000
Black-tailed Godwit
10,000 8,000 6,000 4,000 2,000
500 0 1965
1970
1975
1980
1985
1990
1995
0 1965
2000
1970
1975
70,000
1980
1985
1990
1995
2000
1990
1995
2000
1990
1995
2000
1990
1995
2000
20,000
1970
1975
1980
1985
Curlew
60,000
Number of birds
Number of birds
1995
30,000
70,000
Grey Plover
30,000 20,000
50,000 40,000 30,000 20,000 10,000
0 1965
1970
1975
1980
1985
1990
1995
0 1965
2000
1970
1975
Years 350,000
1980
1985
Years 70,000
Knot
Redshank
60,000
Number of birds
300,000
Number of birds
1990
40,000
Years
10,000
250,000 200,000 150,000 100,000 50,000
50,000 40,000 30,000 20,000 10,000
0 1965 1970 1975 1980 1985 1990 1995 2000
0 1965
1970
1975
Years 16,000
Sanderling
14,000
6,000 5,000 4,000 3,000 2,000 1,000 0 1965
1985
Turnstone
12,000 10,000 8,000 6,000 4,000 2,000
1970
1975
1980
1985
1990
1995
0 1965
2000
Years
Figure 3.1
1980
Years
Number of birds
Number of birds
2000
50,000
0 1965
2000
40,000
7,000
1995
10,000
50,000
8,000
1990
Bar-tailed Godwit
Years 60,000
1985
60,000
Number of birds
Number of birds
10,000 9,000 Ringed Plover 8,000 7,000 6,000 5,000 4,000 3,000 2,000 1,000 0 1965 1970 1975
1980
Years
Years
1975
1980
1985
Years
Continued.
BTO Research Report No. 239 March 2000
1970
69
70
-10
-20 Alt Estuary
General decrease in waterbirds
Walmore Common
Upper Solway Flats and Marshes
The Wash
The Swale
The Dee Estuary
Thanet Coast and Sandwich Bay
5 year changes
Thames Estuary and Marshes
Teesmouth and Cleveland Coast
Tamar Estuaries Complex
Stour and Orwell Estuaries
Stodmarsh
Solent and Southampton Water
Severn Estuary-WALES
Severn Estuary-ENGLAND&WALES
Severn Estuary-ENGLAND
Rutland Water
Ribble Estuary
Ribble and Alt Estuaries (Phase 2)
Portsmouth Harbour
Poole Harbour
Pagham Harbour
Ouse Washes
Orfordness-Havergate (part of Alde-Ore Estuary)
North Norfolk Coast
Morecambe Bay
Minsmere - Walberswick
Mersey Estuary
Medway Estuary and Marshes
Martin Mere
Lindisfarne
Humber Flats, Marshes and Coast (Phase 1)
Hornsea Mere
Hamford Water
Foulness (Mid-Essex Coast Phase 5)
Exe Estuary
Duddon Estuary
Derwent Ings (part of Lower Derwent Valley)
Dengie (Mid-Essex Coast Phase 1)
Deben Estuary
Crouch and Roach Estuaries (Mid-Essex Coast Phase 3)
Colne Estuary (Mid-Essex Coast Phase 2)
Chichester and Langstone Harbours
Chew Valley Lake
Breydon Water
Blackwater Estuary (Mid-Essex Coast Phase 4)
-15 Benfleet and Southend Marshes
15
Alde-Ore Estuary
BTO Research Report No. 239 March 2000
-5 Abberton Reservoir
Figure 3.2 (a-c) Changes in the numbers of waterbirds across English SPAs over 5,10 and 25 years. The change index is calculated by summing the Alerts for all species in an SPA, where a 50% negative Alert is given a value of –2, a 25% negative Alert –1, a 25% positive Alert +1 and a 50% Alert +2. The index indicates direction of trends and so, if an SPA has 10 species, all of which are increasing, the index would have a large positive value and vice versa. If some were going up and some going down an index value of close to zero would be expected. The size of the index also indicates to some extent important SPAs (those with larger numbers of cited species). A large negative value indicates that the SPA supports large numbers of internationally important birds and that there is a general decline across species
20
ENGLISH SPAs General increase in waterbirds
10
5
0
-10
BTO Research Report No. 23 Research Report N BTO 2000 March March 2000
(b) (c) Benfleet and Southend Marshes
Figure Figure3.2 3.2(a-c) (a-c)
-30 Continued. Continued.
General decrease in waterbirds
Walmore Common
Upper Solway Flats and Marshes
The Wash
The Swale
The Dee Estuary
20
Thanet Coast and Sandwich Bay
10 year changes
Thames Estuary and Marshes
Teesmouth and Cleveland Coast
Tamar Estuaries Complex
Stour and Orwell Estuaries
Stodmarsh
Solent and Southampton Water
Severn Estuary-WALES
Severn Estuary-ENGLAND&WALES
Severn Estuary-ENGLAND
Rutland Water
Ribble Estuary
Ribble and Alt Estuaries (Phase 2)
Portsmouth Harbour
Poole Harbour
Pagham Harbour
Ouse Washes
Orfordness-Havergate (part of Alde-Ore Estuary)
North Norfolk Coast
Morecambe Bay
Minsmere - Walberswick
Mersey Estuary
Medway Estuary and Marshes
Martin Mere
Lindisfarne
Humber Flats, Marshes and Coast (Phase 1)
Hornsea Mere
Hamford Water
Foulness (Mid-Essex Coast Phase 5)
Exe Estuary
Duddon Estuary
Derwent Ings (part of Lower Derwent Valley)
Dengie (Mid-Essex Coast Phase 1)
Deben Estuary
Crouch and Roach Estuaries (Mid-Essex Coast Phase 3)
Colne Estuary (Mid-Essex Coast Phase 2)
Chichester and Langstone Harbours
Chew Valley Lake
Breydon Water
Blackwater Estuary (Mid-Essex Coast Phase 4)
-20 Alt Estuary
Alde-Ore Estuary
Abberton Reservoir
30
ENGLISH SPAs General increase in waterbirds
10
0
-10
-30 Benfleet and Southend Marshes
Alt Estuary
Alde-Ore Estuary
General decrease in waterbirds
Walmore Common
Upper Solway Flats and Marshes
The Wash
The Swale
The Dee Estuary
Thanet Coast and Sandwich Bay
Thames Estuary and Marshes
Teesmouth and Cleveland Coast
Tamar Estuaries Complex
20
Stour and Orwell Estuaries
25 year changes
Stodmarsh
Solent and Southampton Water
Severn Estuary-WALES
Severn Estuary-ENGLAND&WALES
Severn Estuary-ENGLAND
Rutland Water
Ribble Estuary
Ribble and Alt Estuaries (Phase 2)
Portsmouth Harbour
Poole Harbour
Pagham Harbour
Ouse Washes
Orfordness-Havergate (part of Alde-Ore Estuary)
North Norfolk Coast
Morecambe Bay
Minsmere - Walberswick
Mersey Estuary
Medway Estuary and Marshes
Martin Mere
Lindisfarne
Humber Flats, Marshes and Coast (Phase 1)
Hornsea Mere
Hamford Water
Foulness (Mid-Essex Coast Phase 5)
Exe Estuary
Duddon Estuary
Derwent Ings (part of Lower Derwent Valley)
Dengie (Mid-Essex Coast Phase 1)
Deben Estuary
Crouch and Roach Estuaries (Mid-Essex Coast Phase 3)
Colne Estuary (Mid-Essex Coast Phase 2)
Chichester and Langstone Harbours
Chew Valley Lake
Breydon Water
Blackwater Estuary (Mid-Essex Coast Phase 4)
-20 Abberton Reservoir
30
ENGLISH SPAs General increase in waterbirds
10
0
4.
NORTHERN IRELAND
4.1
Population Change and Alerts
Figure 4.1 shows the changes in number of all regularly indexed waterbird species in Northern Ireland. Table 4.1 shows the 5, 10, 25 and all year Alerts (see Chapter 1 for details). Figure 4.2 shows the cumulative change in individual sites over 5 and 10 years. Three species have triggered negative 50% Alerts, nine more species generated negative 25% Alerts using GAMs. The remaining species are either stable or increasing.
Bewick’s Swan, Knot and Bar-tailed Godwit generated a 50% Alert using the GAM method.
Little Grebe, Whooper Swan, Gadwall, Shoveler, Pochard, Goldeneye, Ringed Plover, Sanderling, and Turnstone have generated a 25% Alert using the GAM method.
With 199 bootstraps, the change measures for Little Grebe, Gadwall, Shoveler, Goldeneye, Knot, Bar-tailed Godwit and Ringed Plover were not significantly below zero.
Using the Underhill technique the following differences occurred: the Alert for Goldeneye was elevated to a 50% Alert and, in contrast, Gadwall and Pochard did not trigger an Alert.
All other species are stable or increasing (mostly increasing).
4.2
Coverage of SPAs by the Waterbird Alert System
For those species that are regularly indexed by WeBS, the coverage of SPAs in Northern Ireland is reasonable, with the exception of waders in Belfast Lough (Tables 4.2 & 4.3). This site is not currently included in the list of regularly indexed UK sites but, in future, it may be possible to include this site in the Waterbird Alert System. Overall, there were 96 species/site combinations that required Alerts (Tables 4.2 & 4.3). Of these, 20 (19%) were for species not regularly indexed by WeBS and data were unavailable for 11 out of the remaining 76 potential combinations (these were mostly for Belfast Lough). Overall, the coverage in Northern Ireland was 65 (68%) out of 96 combinations. Only two SPAs in Northern Ireland are not covered. These are Carlingford Lough and Killough Harbour, both of which are designated for Light-bellied Brent Goose. Other species such as Scaup, Eider, Golden Plover, Greenshank, Greylag Goose, Lapwing and Purple Sandpiper are listed for sites which are regularly counted. It should be possible to include some of these species/site combinations in future waterbird alert analyses. 4.3
Species Generating a 50% Alert Using GAMs
The All Ireland situation for Alert species was taken from I-WeBS. BTO Research Report No. 239 March 2000
73
Bewick’s Swan All Ireland Situation: Increase On the WeBS sites used for this analysis, Bewick’s Swans have shown a very large decline, decreasing from an average of 400-500 birds per month in the late 1980s and early 1990s to less than 50 birds in 1998/99. Numbers have declined on Lough Neagh & Lough Beg and Lough Foyle, two of the main sites in Northern Ireland for this species (see site alerts). There is no evidence of a recovery. Knot All Ireland Situation: Moderate Increase From the start of counts in 1970/71 there was a steady decline in the number of wintering Knot from 10,000-15,000 birds to less than 2,000 in the late 1980s. Numbers then recovered with a very large peak of 30,000 birds in 1995/96 before declining to 5,000-7,000 birds. The 25 year Alert reflects the pattern of long-term decline from the start of the counts. Bar-tailed Godwit
All Ireland Situation: Moderate Increase
Bar-tailed Godwits triggered a 50% Alert over the whole period of counting. There has been a consistent decline in numbers over this period from c5,000 birds in 1970/71 to 2,500 birds in 1997/98. In an All Ireland context, Belfast Lough is also an important site for Bar-tailed Godwit but is not currently included in the Waterbird Alert System. The decline which took place throughout the 1970s and 1980s has now ceased and numbers were relatively stable in the 1990s although there has been no sign of any recovery. 4.4 Species Triggering a 25% Alert Using GAMs Little Grebe All Ireland Situation: Moderate Fluctuation Little Grebe have increased since the start of counting but numbers in Northern Ireland have been low in the last three years of counts, thus triggering a 5 year 25% Alert. There is, however, no long-term downward trend in numbers. Whooper Swan All Ireland Situation: Large Fluctuations Whooper Swans have shown a consistent decline in numbers from c1,500 birds at the start of counts in 1986/87 to 1,000 birds in 1998/99. This decline has triggered Alerts over 10 and all years. The Waterbird Alert System covers two of the three SPAs cited for Whooper Swan (Lough Foyle and Lough Neagh & Lough Beg) but does not cover Upper Lough Erne. However, these former two sites hold most birds in Northern Ireland (I-WeBS) and the change is still likely to be significant across the country. Wigeon
All Ireland Situation: Slight Fluctuation
Wigeon triggered a 25% Alert over the last 10 year period indicating a moderate mediumterm decline. Numbers were highest at the start of counts but declined throughout the late 1980s from 7,000-9,000 birds to the current level of 5,000-6,000 birds. Lough Foyle supports the majority of birds in Northern Ireland and numbers at this site have undergone a large decline. This change is largely responsible for triggering the Alert. The numbers peaked there at 7,000 birds in 1988/98 but declined to the current level of 2,000 birds. Numbers at Strangford Lough (average of 1,140 birds over all years counted) and Lough Neagh & Lough Beg (averaging 1,550 birds over all years counted) have remained stable. Gadwall
All Ireland Situation: Large Increase
Two sites, Lough Neagh & Lough Beg and Strangford Lough are important for Gadwall in Northern Ireland, although none support an average population larger than the international importance threshold of 300 birds. Numbers of Gadwall increased from the start of counts to a peak of c200 birds per month in 1994/95. Numbers have since dropped, triggering a 25% BTO Research Report No. 239 March 2000
74
Alert over the past five years and over all years. The population at Strangford Lough has remained relatively stable but has declined on Lough Neagh & Lough Beg. Shoveler
All Ireland Situation : Moderate Increase
Only two sites in Northern Ireland (Strangford Lough & Lough Neagh and Lough Beg) pass the All Ireland importance level of 65 birds. There has been a consistent decline over the whole period of counts and an all year 25% Alert was triggered due to the decline in numbers since 1986/87. Pochard All Ireland Situation: Large Fluctuations Counts of Pochard have been characterised by an increase in numbers followed by a decrease to a similar numbers of birds as at the start of counts. Counts have been low in the past two years, thus triggering an alert over a 10 year period. Although a longer series of data would be needed to be confident, there does seem to be have been a downward trend in numbers from 1991/92 to 1998/99. Lough Neagh and Lough Beg are the most important site in the UK for this species, holding between 20,000 and 25,000 birds and decline there will have contributed most to the change in the Northern Irish total. In comparison, Abberton Reservoir, the next most important UK site, only supports 2,000-3,000 birds. Goldeneye
All Ireland Situation: Large Fluctuations
Northern Ireland supports a high proportion of the UK total of Goldeneye. The main wintering site for Goldeneye in the UK is the Lough Neagh and Lough Beg SPA and this has supported an average of c7,000-8,000 birds over the whole period of counts. However total numbers have dropped from approximately 10,000 birds in the mid- and late 1980s to c7,500 in 1998/99 causing 25% Alerts to be triggered over 5, 10 and all years. Ringed Plover All Ireland Situation: Slight Decline Although very variable from year-to year, Ringed Plover numbers increased from the 500600 birds at the start of counts to a peak of over 900 in 1984/95. Numbers then declined to the current level of 400-600 birds, thus triggering a 10 year 25% Alert. Sanderling All Ireland Situation: Moderate Increase On the WeBS sites covered for this report, Sanderling are a rare species. Numbers increased from zero to between 60 and 80 birds between the start of counts and the late 1970s. From then there was a quick decline and by the mid-1980s numbers fell to the current level of 10 to 20 birds. Turnstone All Ireland Situation: Moderate Increase Turnstone numbers have changed in line with the national index. Numbers fell from 1,500 to 1,000 birds from the start of counts to the mid-1970s before rising to a peak of 2,000-2,500 birds in the mid- to late-1990s. Numbers fell from 1990/91 to around 1,000 birds, half the previous peak level. 4.5
Site Alerts – Special Protection Areas (SPAs) in Northern Ireland
Table 4.4 shows the Alerts and percentage population change over 5, 10 and all years for each species/site combination. For waterbirds, other than waders, counts began in 1986/87. For waders counts began in 1970/71. All Alerts are calculated using the GAM method. As there is a great deal of variation in counts on individual sites, only 50% Alerts are discussed. Larne Lough
Cited Species: Light-bellied Brent Goose BTO Research Report No. 239 March 2000
75
No Alert species. Light-bellied Brent Goose have shown a steady increase in numbers. Outer Ards
Cited Species: Light-bellied Brent Goose, Ringed Plover, Turnstone 50% Alert: Light-bellied Brent Goose, Ringed Plover Numbers of Light-bellied Brent Geese at Outer Ards have undergone a large decline since 1994/95, thus triggering a 50% five year Alert. From the start of counts numbers rose from 40-60 birds to a peak of an average of just over 120 birds per month before falling to less than 20 in 1997/98. Numbers then recovered to an average of 60 in 1998/99. This is a prime example of where averaging counts across months (in this case September to March, 7 months) reduces the number of birds recorded to below the international threshold. The WeBS reports, which use maxima to identify the importance of a site, will identify more sites as internationally important. Ringed Plover numbers have declined dramatically from 500-600 birds in the mid 1980s to c200 birds currently. The decline was continuous until the last two winters when numbers seem to have stabilised. More years data would be needed to determine whether the decline has slowed down. Belfast Lough
Cited Species: Bar-tailed Godwit*, Black-tailed Godwit*, Cormorant, Curlew*, Dunlin*, Goldeneye, Great Crested Grebe, Knot*, Mallard, Oystercatcher, Red-breasted Merganser, Redshank*, Ringed Plover*, Shelduck, Turnstone* Belfast Lough is not a site that is regularly used to index waders, and so count data were not available to run Alerts. 50% Alert: Goldeneye, Mallard, Shelduck Belfast Lough has shown declines across a number of waterbird species (Figure 4.2). The 50% Alert for Goldeneye has been largely caused by very low counts in the last two years (the two lowest counts for this site on record). Numbers have fluctuated between 300 and 600 birds since the start of counts, but in 1997/98 there were 200 and in 1998/99, 100 birds. More years data would be required to determine if there was a long term decline in numbers. Mallard numbers rose from c300 birds a the start of counts in 1986/87 to 700 birds in 1992/93 but have since declined to their initial level of c300 birds. The decline over the last five years was sufficient to trigger a 50% Alert. Shelduck have triggered a 5 year 50% Alert indicating a short-term decline. Numbers varied between 200-400 birds from the start of counts to 1993/94. In the following two years a large increase to 700 birds took place but then numbers have returned to their previous level by 1997/98. The last three winters have seen a decline in birds and the last counting year, BTO Research Report No. 239 March 2000
76
1998/99, was the lowest ever for the site. If the trend continues, this would be worrying, but more data would be needed to determine if this was the case. All other species have been stable or are increasing. Belfast Lough is one of the most important sites in the UK for Great Crested Grebe and numbers have steadily increased from 200 to over 1,200 birds over the count period. Lough Foyle
Cited species: Bar-tailed Godwit, Bewick’s Swan, Cormorant, Curlew, Dunlin, Great Crested Grebe, Knot, Light-bellied Brent Goose, Mallard, Oystercatcher, Red-breasted Merganser, Redshank, Shelduck, Teal, Whooper Swan, Wigeon 50% Alert: Great Crested Grebe, Bewick’s Swan, Wigeon, Bar-tailed Godwit Great Crested Grebe numbers have fluctuated between 20 and 80 birds throughout the time period. However, an exceptionally large mean count of 140 birds in 1987/88 (the second year of counts) caused the smoothed index to be initially high. This, coupled with the counts for 1998/99 being the second lowest ever triggered the 10 and all year Alerts. There is no longterm trend. Bewick’s Swan numbers have declined from between 20-180 birds per month to less than 10 birds in the last two years, thus triggering a 50% Alert over all time periods. Wigeon have declined from an average of c5,000 birds between 1986/87 and 1991/91 to between 1,000-3,000 birds over the past 5 years, thus triggering a 10-year Alert. Numbers have been stable over the past five years and there is no long term trend. Bar-tailed Godwit numbers have, despite inter-annual fluctuations, undergone a steady decline in numbers from 2,000-3,500 birds in the 1970s and early 1980s to the current levels of 1,500 birds. Lough Neagh & Lough Beg
Cited Species: Bewick’s Swan, Coot, Cormorant, Gadwall, Goldeneye, Great Crested Grebe, Mallard, Pochard, Shelduck, Shoveler, Teal, Tufted Duck, Whooper Swan, Wigeon 50% Alert: Bewick’s Swan, Great Crested Grebe, Red-breasted Merganser, Shoveler Loughs Neagh and Beg support very large internationally important populations of wildfowl and are outstanding, in UK terms, for their populations of Great Crested Grebe, Whooper Swan, Pochard, Tufted Duck, Scaup and Goldeneye. There has been a recent (5 year) decline across a range of waterbird species (Figure 4.2, Table 4.4). Lough Neagh & Lough Beg are the most important site for Bewick’s Swan in Northern Ireland. Numbers increased from 100 birds to a peak of 350 in 1990/91 but there has since been a large decline and by 1998/99 an average of less than 10 birds per month were recorded. Great Crested Grebe triggered a 50% Alert over 10 and all years. Lough Neagh & Lough Beg, along with Belfast Lough, are the most important sites for Great Crested Grebe in the UK, holding more than twice the number of any other site. Numbers have declined from an average of 600-700 birds per month to less than 300 birds per month. These figures are much BTO Research Report No. 239 March 2000
77
lower than the maxima of 1,000 to 2,000 birds reported in the annual WeBS reports but this is due to the fact that this species is indexed over seven months and the alerts figures are expressed as an average number of birds per month. There has been a consistent decline in the number of Shoveler wintering on Loughs Neagh & Beg. Numbers fell from 50 to 80 birds per year at the start of counts to 30 to 40 birds at the end. Strangford Lough
Cited Species: Coot, Cormorant, Curlew, Dunlin, Gadwall, Goldeneye, Great Crested Grebe, Grey Plover, Knot, Light-bellied Brent Goose, Mallard, Oystercatcher, Pintail, Red-breasted Merganser, Redshank, Ringed Plover, Shoveler, Teal, Turnstone, Wigeon 50% Alert: Coot, Goldeneye, Knot, Turnstone Coot numbers have undergone a consistent decline since the start of counts. Numbers have fallen from an average of 500-600 birds to the current level of 200-300 birds. Since this large decline, numbers appear to have stabilised over the last four winters. Goldeneye numbers were initially high in the first winter of counts at an average of over 500 birds. In the following years numbers have fluctuated between 100 and 300 birds and there has been no consistent long-term change in numbers. A 50% Alert was triggered by the initially high counts. Knot have undergone a large decline on Strangford Lough. Numbers have fluctuated annually but have fallen from 10,000-18,000 birds to the current level of 2,000-6,000 birds. In the past five years the decline seems to have levelled off and the population has remained stable at this lower level. A 50% Alert was triggered for the decline across all years considered. Turnstone numbers remained steady at between 150 and 200 birds from the start of counts in 1970 until 1983/84 when the population approximately doubled to over 350 birds. The population remained at this level until 1990/91 when it halved and returned to its previous size, thus triggering a 10 year Alert. Numbers have remained stable since.
BTO Research Report No. 239 March 2000
78
BTO Research Report No. 239 March 2000
Table 4.1
Percentage change and Alerts over 5,10, 25 and all years of counts. For interpretation of symbols see Section 1.6. Population size refers to the average number of birds per month recorded on the WeBS sites used. ALERTS CALCULATED USING GAMS
5-yr ++ -n/a n/a n/a + +
10-yr + ++ + -n/a n/a n/a + + -
79
+
+
+
+ -
-
-
n/a n/a
n/a n/a
++ n/a
+ n/a ++ ++ ++ ++ ++
+ ++ ++ ++ ++ ++
-
25-yr n/a n/a n/a n/a n/a n/a n/a n/a n/a n/a n/a n/a n/a n/a n/a n/a n/a n/a n/a n/a n/a n/a n/a n/a ++ n/a
All ++ ++ ++ ++ -n/a n/a n/a ++ + + + ++ + n/a n/a ++ n/a
++ -++ ++ ++ -
++ ++ ++ --
++
++
5-yr -25 16 89 18 -73 -20 n/a n/a n/a 29 36 1 -29 37 -5 46 -22 -17 -23 -25 -3 n/a n/a -5 80 n/a 2 40 50 76 63 422 -3 70 64 3
10-yr 21 39 134 37 -87 -37 n/a n/a n/a 20 27 -29 -5 -4 1 41 -22 -32 -9 -35 -8 n/a n/a 1 43 n/a -31 113 129 163 58 107 1 9 18 -47
25-yr n/a n/a n/a n/a n/a n/a n/a n/a n/a n/a n/a n/a n/a n/a n/a n/a n/a n/a n/a n/a n/a n/a n/a n/a 268 n/a 7 310 -51 89 101 258 -49 -2 84 0
ALERTS CALCULATED USING UNDERHILL METHOD
NORTHERN IRELAND All 123 56 534 62 -78 -30 n/a n/a n/a 50 43 -23 31 27 4 75 -36 -13 32 -36 21 n/a n/a 23 239 n/a -1 5 -48 1,440 75 60 -58 -23 88 -13
Species Little Grebe Great Crested Grebe Cormorant Mute Swan Bewick`s Swan Whooper Swan European White-fronted Goose Feral Greylag Goose Canada Goose Light-bellied Brent Goose Shelduck Wigeon Gadwall Teal Mallard Pintail Shoveler Pochard Tufted Duck Goldeneye Red-breasted Merganser Goosander Ruddy Duck Coot Oystercatcher Avocet Ringed Plover Grey Plover Knot Sanderling Dunlin Black-tailed Godwit Bar-tailed Godwit Curlew Redshank Turnstone
5yr -8 46 59 14 -57 -12 n/a n/a n/a 15 40 -7 -23 21 -1 4 -17 -21 -15 -35 1 n/a n/a 2 46 n/a -22 76 121 20 56 282 -3 23 38 -14
10yr 64 47 173 37 -65 -29 n/a n/a n/a 39 21 -27 18 4 2 38 -29 -22 13 -37 1 n/a n/a 16 22 n/a -36 71 254 114 51 84 -4 0 3 -47
25yr n/a n/a n/a n/a n/a n/a n/a n/a n/a n/a n/a n/a n/a n/a n/a n/a n/a n/a n/a n/a n/a n/a n/a n/a 249 n/a -1 188 3 757 103 299 -51 -18 44 -16
All 64 47 173 37 -65 -29 n/a n/a n/a 39 21 -27 18 4 2 38 -29 -22 13 -37 1 n/a n/a 16 202 n/a -13 9 -26 757 74 92 -58 -25 73 -17
5yr + ++ -n/a n/a n/a
10yr ++ + ++ + -n/a n/a n/a +
+ -
++ -
-
--
n/a n/a
n/a n/a
+ n/a
++ ++
n/a ++ ++ ++ ++ ++
+
++
++ ++
25yr n/a n/a n/a n/a n/a n/a n/a n/a n/a n/a n/a n/a n/a n/a n/a n/a n/a n/a n/a n/a n/a n/a n/a n/a ++ n/a
All ++ + ++ + -n/a n/a n/a + -
++ -
--
++
8,000 3,500 5,000 155 4,500 9,000 221 120 14,000 10,500 7,500 439
n/a n/a ++ n/a
++ ++ ++ ++ --
Pop size 1998 450 1,500 2,500 2,000 15 794
++ ++ ++ -++
4,000 13,500 0 675 350 6,000 32 16,500 156 2,500 6,000 6,000 1,500
Larne Lough Outer Ards Belfast Lough Lough Foyle Lough Neagh and Lough Beg Strangford Lough
Wigeon
Whooper Swan
Turnstone
Tufted Duck
Teal
Shoveler
Shelduck
Ringed Plover
Redshank
Red-breasted Merganser
Pochard
Pintail
Oystercatcher
Mute Swan
Mallard
Little Grebe
Light-bellied Brent Goose
Knot
Grey Plover
Great Crested Grebe
Goldeneye
Gadwall
Dunlin
Curlew
Cormorant
Coot
Species which are cited for SPAs in Northern Ireland that are not currently covered by the Waterbird Alert System.
Purple Sandpiper
Lapwing
Greylag Goose
Greenshank
Golden Plover
Eider
Whooper Swan
Turnstone
Ringed Plover
Redshank
NOT COVERED BY WeBS
Oystercatcher
Knot
Dunlin
Curlew
Black-tailed Godwit
Bar-tailed Godwit
80
Light-bellied Brent Goose
COVERED BY WeBS
Scaup
Table 4.3
Bewick`s Swan
Bar-tailed Godwit
Species which are cited/proposed for SPAs in Northern Ireland and are covered by the Waterbird Alert System.
SITE NAME
BTO Research Report No. 239 March 2000
Table 4.2
Species / Site Belfast Lough Carlingford Lough Killough Harbour Lough Foyle Lough Neagh and Lough Beg Outer Ards Strangford Lough Upper Lough Erne
Table 4.4
Population change (%) and Site Alerts for waterbirds on SPAs in Northern Ireland over 5, 10, 25 and all years. (++ / -- = 50% Alert, + / - = 25% Alert).
5-year Alert
10-year Alert
++ ----
--+ ++
++ n/a ++ n/a ++ ++ ++
25-year Alert
All years Alert
5-year change
10-year change
25 year change
All years change
First count
Last count
++ ++ -
++ ++
--
--
57 -2 -55 -53 -65 -27
243 139 -28 -20 -63 -25
N/A N/A N/A N/A N/A N/A
535 542 -16 5 -72 3
86 86 86 86 86 86
++
+
2
64
.
43
-+ --
-++ -++ ++ + -
-54 -8 -81 -15 33 90 15 -19 -10 -14 210 inf 181 inf 165 186
-64 47 -89 -38 8 67 -52 -37 -22 -14 31 -49 258 -12 18 17
N/A N/A N/A N/A N/A N/A N/A N/A N/A N/A N/A N/A N/A N/A N/A N/A
-34 -41 168 24
13 -52 339 66
N/A N/A N/A N/A
++ --
+ ++
-++ ++
BTO Research Report No. 239 March 2000
++ ++ ++ -++
++ -++ ++
Species
Site
98 98 98 98 98 98
Great Crested Grebe Cormorant Shelduck Mallard Goldeneye Red-breasted Merganser
Belfast Lough Belfast Lough Belfast Lough Belfast Lough Belfast Lough Belfast Lough
86
98
Light-bellied Brent Goose
Larne Lough
-62 394 -83 -30 128 75 -28 34 -35 -1 80 52 491 -52 55 -11
86 86 86 86 86 86 86 86 86 86 75 75 75 75 75 75
98 98 98 98 98 98 98 98 98 98 98 98 98 98 98 98
Great Crested Grebe Cormorant Bewick`s Swan Whooper Swan Light-bellied Brent Goose Shelduck Wigeon Teal Mallard Red-breasted Merganser Oystercatcher Knot Dunlin Bar-tailed Godwit Curlew Redshank
Lough Foyle Lough Foyle Lough Foyle Lough Foyle Lough Foyle Lough Foyle Lough Foyle Lough Foyle Lough Foyle Lough Foyle Lough Foyle Lough Foyle Lough Foyle Lough Foyle Lough Foyle Lough Foyle
117 -59 2,133 89
86 86 86 86
98 98 98 98
Little Grebe Great Crested Grebe Cormorant Mute Swan
Lough Neagh and Lough Beg Lough Neagh and Lough Beg Lough Neagh and Lough Beg Lough Neagh and Lough Beg
81
5-year Alert
10-year Alert
-+
--
25-year Alert
All years Alert
5-year change
10-year change
25 year change
All years change
First count
Last count
Species
Site
--
-90 -36 -2 1 22 -16 15 -41 -31 -8 -37 931 8
N/A N/A N/A N/A N/A N/A N/A N/A N/A N/A N/A N/A N/A
-81 -30 -20 -18 53 13 22 -54 -12 32 -37 3,538 31
86 86 86 86 86 86 86 86 86 86 86 86 86
98 98 98 98 98 98 98 98 98 98 98 98 98
Bewick`s Swan Whooper Swan Shelduck Wigeon Gadwall Teal Mallard Shoveler Pochard Tufted Duck Goldeneye Red-breasted Merganser Coot
Lough Neagh and Lough Beg Lough Neagh and Lough Beg Lough Neagh and Lough Beg Lough Neagh and Lough Beg Lough Neagh and Lough Beg Lough Neagh and Lough Beg Lough Neagh and Lough Beg Lough Neagh and Lough Beg Lough Neagh and Lough Beg Lough Neagh and Lough Beg Lough Neagh and Lough Beg Lough Neagh and Lough Beg Lough Neagh and Lough Beg
-
-
--
++
+ ++ +
-71 -27 33 -7 -26 25 2 -32 -17 -23 -26 -61 -5
-n/a n/a
--
-
-54 . .
-18 -53 -47
N/A N/A N/A
-8 -49 -46
86 85 85
98 98 98
Light-bellied Brent Goose Ringed Plover Turnstone
Outer Ards Outer Ards Outer Ards
0 58 31 57 1 -33 91 -17 60 -26 -5 -11 -5 42 13
13 -23 21 31 19 -19 40 -23 59 -22 -32 -19 -47 70 53
N/A N/A N/A N/A N/A N/A N/A N/A N/A N/A N/A N/A N/A N/A N/A
-2 -36 19 42 12 1 36 -20 62 -26 -55 -14 -59 221 51
87 87 87 87 87 87 87 87 87 87 87 87 87 70 70
98 98 98 98 98 98 98 98 98 98 98 98 98 98 98
Great Crested Grebe Cormorant Light-bellied Brent Goose Shelduck Wigeon Gadwall Teal Mallard Pintail Shoveler Goldeneye Red-breasted Merganser Coot Oystercatcher Ringed Plover
Strangford Lough Strangford Lough Strangford Lough Strangford Lough Strangford Lough Strangford Lough Strangford Lough Strangford Lough Strangford Lough Strangford Lough Strangford Lough Strangford Lough Strangford Lough Strangford Lough Strangford Lough
+
++
--
++ + ++
+
+
++
+
+
++ -
++ --
++ ++
-++ ++
++ -
+
-
BTO Research Report No. 239 March 2000
82
5-year Alert
10-year Alert
++ + + +
++ ++ ++ ++
25-year Alert
All years Alert
5-year change
10-year change
25 year change
All years change
First count
Last count
+ -+
80 37 37 46 8 10 -18
339 108 65 139 -6 3 -55
N/A N/A N/A N/A N/A N/A N/A
32 -54 30 -25 -38 91 -21
70 70 70 70 70 70 70
98 98 98 98 98 98 98
++ --
BTO Research Report No. 239 March 2000
83
Species
Site
Grey Plover Knot Dunlin Bar-tailed Godwit Curlew Redshank Turnstone
Strangford Lough Strangford Lough Strangford Lough Strangford Lough Strangford Lough Strangford Lough Strangford Lough
800
Little Grebe
Number of birds
Number of birds
700 600 500 400 300 200 100
1965
1970
1975
1980
1985
1990
1995
1,800 1,600 1,400 1,200 1,000 800 600 400 200
2000
Whooper Swan
1965
1970
1975
Years
Great Crested Grebe
2,000 1,500 1,000 500
1965
1970
1975
1980
1985
1990
1995
9,000 8,000 7,000 6,000 5,000 4,000 3,000 2,000 1,000
2000
1965
2,000 1,500 1,000
1970
1975
1980
1985
1990
1995
2000
1990
1995
2000
1990
1995
2000
1995
2000
3,000 2,500 2,000 1,500 1,000 500
1965
1970
1975
1980
1985
1990
1995
1965
2000
1970
1975
Mute Swan
Number of birds
2,000 1,500 1,000 500
1965
1970
1975
1980
1985
1990
1995
10,000 9,000 8,000 7,000 6,000 5,000 4,000 3,000 2,000 1,000
1985
2000
Wigeon
1965
1970
1975
Years
1980
1985
Years
250
500 Bewick's Swan
Number of birds
450
1980
Years
Years
Number of birds
2000
Shelduck
3,500
Number of birds
Number of birds
4,000 Cormorant
500
400
Number of birds
1995
Years
2,500
2,500
1990
Pale-bellied Brent Goose
Years 3,000
1985
Years
Number of birds
Number of birds
2,500
1980
350 300 250 200 150
Gadwall
200 150 100 50
100 50
1965 1965
1970
1975
1980
1985
1990
1995
2000
1970
1975
1980
1985
1990
Years
Years
Figure 4.1 Changes in numbers of regularly indexed waterbirds in Northern Ireland (Underhill and smoothed). BTO Research Report No. 239 March 2000
84
7,000
Teal Number of birds
Number of birds
6,000 5,000 4,000 3,000 2,000 1,000 1965
1970
1975
1980
1985
1990
1995
20,000 18,000 16,000 14,000 12,000 10,000 8,000 6,000 4,000 2,000
2000
Tufted Duck
1965
1970
1975
Years 14,000
25,000
Mallard Number of birds
Number of birds
10,000 8,000 6,000 4,000 2,000 1970
1975
1980
1985
1990
1995
1995
2000
1990
1995
2000
1990
1995
2000
5,000
1970
1975
1980
1985
Years 7,000
Coot
6,000 Number of birds
Number of birds
1990
10,000
150 100 50
5,000 4,000 3,000 2,000 1,000
1970
1975
1980
1985
1990
1995
2000
1965
1970
1975
Years
1980
1985
Years 600
Shoveler
200
Number of birds
Number of birds
2000
Pochard
1965
Pintail
1965
150 100 50
Red-breasted Merganser
500 400 300 200 100
1965
1970
1975
1980
1985
1990
1995
2000
1965
Years 14,000
Goldeneye
10,000 8,000 6,000 4,000 2,000 1965
1970
1975
1980
1985
1990
1995
2000
Years
Figure 4.1
Continued.
BTO Research Report No. 239 March 2000
1970
1975
1980
1985
Years
12,000 Number of birds
1995
15,000
2000
200
250
1990
20,000
Years 250
1985
Years
12,000
1965
1980
85
Number of birds
14,000
300
Oystercatcher
Number of birds
16,000 12,000 10,000 8,000 6,000 4,000
Black-tailed Godwit
250 200 150 100 50
2,000 0 1965
1970
1975
1980
1985
1990
1995
0 1965
2000
1970
1975
1,000 900 Ringed Plover 800 700 600 500 400 300 200 100 0 1965 1970 1975
8,000 7,000
1980
1985
1990
1995
Number of birds
Number of birds
400 300 200 100 1975
1980
1985
1990
1995
2000
Number of birds
Number of birds
20,000 15,000 10,000
1970
1975
1980
1985
10,000 9,000 Curlew 8,000 7,000 6,000 5,000 4,000 3,000 2,000 1,000 0 1965 1970
1975
1980
1985
1995
2000
1990
1995
2000
1990
1995
2000
Redshank
5,000 4,000 3,000 2,000 1,000
0 1965
1970
1975
1980
1985
1990
1995
0 1965
2000
1970
1975
Years
1980
1985
Years 3,000
Sanderling
Number of birds
Number of birds
1990
2,000
6,000
5,000
60 50 40 30 20
Turnstone
2,500 2,000 1,500 1,000 500
10 1970
1975
1980
1985
1990
1995
0 1965
2000
Years
Number of birds
2000
3,000
7,000
Knot
25,000
0 1965
1995
4,000
Years
30,000
70
1990
5,000
Years
80
2000
Years
500
35,000
1995
6,000
0 1965
2000
Grey Plover
1970
1990
1,000
600
0 1965
1985
Bar-tailed Godwit
Years 700
1980
Years
Number of birds
Number of birds
Years
18,000 Dunlin 16,000 14,000 12,000 10,000 8,000 6,000 4,000 2,000 0 1965 1970
1975
1980
1985
1990
1995
2000
Continued.
BTO Research Report No. 239 March 2000
1975
1980
1985
Years
Years
Figure 4.1
1970
86
(a)
(b)
15
15
-10
Outer Ards
Lough Foyle
-10
Figure 4.2 (a-b)
BTO Research Report No. 239 March 2000
Changes in the numbers of waterbirds across SPAs in Northern Ireland over 5,10 and 25 years. The change index is calculated by summing the Alerts for all species in an SPA, where a 50% negative Alert is given a value of –2, a 25% negative Alert –1 a 25% positive Alert +1 and a positive 50% Alert +2. The index indicates direction of trends and so, if an SPA, has 10 species which are all increasing, the index would be a large positive value and vice versa. If some were going up and some going down an index value of close to zero would be expected. The size of the index also indicates to some extent important SPAs (those with larger numbers of cited species). A large negative value indicates that the SPA supports large numbers of internationally important birds and that there is a general decline across species.
87
Strangford Lough
-5
Lough Neg & Lough Beg
-5
Strangford Lough
0
Outer Ards
0
Lough Neg & Lough Beg
5
Lough Foyle
5
Larne Lough
10
Belfast Lough
10
Larne Lough
SPAs in Northern Ireland 10 year change
Belfast Lough
SPAs in Northern Ireland 5 year change
5.
SCOTLAND
5.1
Population Change and Country Alerts
Figure 5.1 shows the Underhill indices and smoothed GAM estimates of the population size of each regularly indexed species of waterbird in Scotland. Table 5.1 details population change using both Underhill and GAM methods and raises country alerts for those species showing changes in their population of 25% (a 25% Alert) or 50% (a 50% Alert). Figure 5.2 shows the mean change index for all cited species in each SPA. Five species triggered a 50% Alert and five triggered a 25% Alert. All other species are stable or generally increasing.
Bewick’s Swan, Whooper Swan, Shoveler, Pochard and Goosander triggered a 50% Alert under the GAM method.
Cormorant, Tufted Duck, Mallard, Red-breasted Merganser, Knot and Turnstone triggered a 25% Alert using GAMs.
Gadwall raised a 25% Alert but the main site, Loch Leven, was not included in the analysis and so should be ignored.
Using 199 bootstraps, all change measures for Goosander and Red-breasted Merganser were not significantly below zero.
Using the Underhill technique the Alert for Red-breasted Merganser was elevated to a 50% Alert and Great Crested Grebe, Coot, Dunlin and Bar-tailed Godwit triggered 25% Alerts.
All other species are stable or increasing (mostly increasing).
5.2
Coverage of SPAs in Scotland by the Waterbird Alert System
For wintering waterbirds on Scottish SPAs there are 181 species/site combinations. Of these, 85 (47%) are of species that are not regularly indexed by WeBS and so are not currently included in the waterbird site alert system. Of the remaining 96 combinations, there are sufficient data for 70 (73%) species/site combinations. Overall, this represents a coverage of 39%. This coverage is much lower than for any other country in the UK, and is due mostly to the larger number of species in Scotland that are not regularly included in WeBS indices. Many of these combinations refer to sites that are regularly counted and so in future it may be possible to include these if the data can be readily extracted from the database. 5.3
Species Generating a 50% Alert
Four species, Whooper Swan, Bewick’s Swan, Pochard and Goosander have shown large declines in Scotland. BTO Research Report No. 239 88 March 2000
Goosander GB Situation: Increasing Goosander raised an alert due to a decline in the population since the 1987/88 winter. Prior to that this species underwent an increase from 300 birds to 1,750 birds in 1987/88. Goosander numbers fluctuate widely between years but the general trend was of an increase in the population on Scottish WeBS sites. Since 1988/89, numbers have remained steady at 5001,000 birds. Pochard GB Situation: Stable Pochard numbers have shown a very large decline in numbers since the early 1970s. At their peak in 1974/75, approximately 14,000 birds wintered in Scotland but this number declined rapidly to the present level of c5,000 birds in only 5-6 years. Since then there have been small between-year fluctuations, but currently the trend is of a stable, if lower, population. Whooper Swan GB Situation: Increasing Whooper Swans have undergone a decline over the past 10 years. From 1966/67 onwards there was a steady increase in the number of birds on Scottish WeBS sites to the mid-1980s. A rapid increase ensued to a peak of 3,000 birds in 1990/91, followed by a rapid decrease to current levels of c1,000 birds which is a similar to previous levels. Bewick’s Swan GB Situation: Increased then Stable Bewick’s Swans are not a species that are usually associated with Scotland. However, from the early 1970s an increasing number of Bewick’s Swans wintered on the Solway, peaking at approximately 50-60 birds in the early 1980s. From this time, numbers have declined to less than 5 birds in the past 5 years. 5.4
Species Generating a 25% Alert
Cormorant GB Situation: Increasing Cormorant numbers in Scotland have undergone an increase followed by a decrease, thus generating a 25% five year Alert. Numbers rose from an average of 1,000 birds per month to bewtween 2,000 and 2,500 in the early 1990s before declining to 1,500 to 2,500 in the last few years of counts. A longer series of data would be needed to determine whether this was indicative of a long-term trend. (Gadwall) GB Situation: Increasing Gadwall raised a 50% Alert. However, the data available for this species did not include Loch Leven which is the main wintering site in Scotland for this species. As the data are clearly not representative of the Scottish population, this alert should be ignored. Tufted Duck GB Situation: Stable Tufted Duck numbers increased slightly in Scotland over the first 10 year of counts and then underwent a slow steady decrease, thus triggering the 25 year 25% Alert. Numbers have fallen from 8,000-9,000 birds in the early- to mid-1970s to 5,000-6,000 birds currently. The decline has not been consistent between years but has been characterised by periods of stability interspersed by periods of decline. Mallard GB Situation: Stable/Recent Decrease Mallard numbers have remained stable over the past 25 years. However at the beginning of counts in 1966/67 it was estimated that 35,000-40,000 birds per month wintered in Scotland. However the following 3 winters saw a decline in birds to approximately 25,000 birds. BTO Research Report No. 239 March 2000
89
Numbers have remained reasonably stable since, although there has been a downward trend in the past 10 winters, mirroring the national trend. Red-breasted Merganser GB Situation: Increasing Mergansers have triggered a 25% five year Alert. Sea duck are notoriously difficult to count and the numbers on WeBS counts often fluctuate widely between years. In Scotland, as with the national picture, numbers have been characterised by peaks and troughs in counts. In the last few years of counting, numbers were in a trough, thus triggering a 5 year Alert. Overall, the trend of Red-breasted Mergansers in Scotland is upwards as indicated by the 50% positive Alert triggered over 25 years. Knot UK: Decrease/Stable Knot showed a consistent decline in numbers from 1969/70 to the mid-1980s followed by a period of stability or slight increase which has continued to this day. The 25 and all year 25% Alerts were triggered by this initial decline. The decline is significant in terms of the number of birds as numbers fell from a peak of 40,000 birds to the current level of c20,000 birds. These changes closely mirror the national trend. Turnstone UK: Increase followed by decrease The changes in numbers of Turnstone in Scotland closely follow those seen in the national trends. Numbers increased from 1969/70 to 1990/91 and thereafter have declined, thus triggering a 5 and 10 year Alert. This trend has not been consistent as the last 2 two winters have seen increases, but number are not showing any return to 1990 levels. 5.5
Site Alerts – Special Protection Areas in Scotland
Table 5.4 shows the Alerts and percentage population change over 5, 10, 25 and all years for each species/site combination. All Alerts are calculated using the GAM method. As there is a great deal of variation in counts on individual sites only 50% Alerts are discussed. Cromarty Firth Cited species: Whooper Swan, Wigeon, Pintail, Red-breasted Merganser, Oystercatcher, Knot, Dunlin, Bar-tailed Godwit, Curlew, Redshank 50% Alerts: Whooper Swan and Wigeon The WeBS data for Whooper Swan is misleading as the numbers recorded on the Cromarty Firth are very variable and can range from several hundred birds to zero. However there does seem to have been a long-term decline in the number of birds recorded and only once in the past 10 winters has more than 100 birds been recorded. The Alert System is not suited to these type of data. Wigeon numbers were initially high at the start of counts at 9,500 birds in 1967/68 and since then numbers remained stable at approximately 4,000 birds. The alerts have been triggered due to the sudden decrease in the number of birds in 1997/98 and 1998/99 to approximately half the previous level. These two runs of years have been sufficient to trigger the alerts but, given that numbers have occasionally dropped to a similar level in the winters of 1990/91 and 1991/92 and subsequently recovered, this may be a short-term decline. BTO Research Report No. 239 March 2000
90
Other species have remained stable or showed a moderate increase over the entire time period. Dornoch Firth and Loch Fleet Cited species: Wigeon, Teal, Oystercatcher, Dunlin, Bar-tailed Godwit and Curlew No Alert species. All cited species have shown moderate to high increases. Firth of Forth Cited species: Great Crested Grebe, Cormorant, Shelduck, Wigeon, Mallard, Goldeneye, Red-breasted Merganser, Oystercatcher, Ringed Plover, Grey Plover, Knot, Dunlin, Bartailed Godwit, Curlew, Redshank and Turnstone. 50% Alerts: Knot and Mallard Knot have declined from 15,000 birds during the early 1970s to the current level of 5,0006,000 birds. This decline was steady and consistent until 1985/86 when the downward trend levelled out and numbers have remained stable since, varying between 4,000 to 10,000 birds. Mallard show a pattern of steady increase followed by a sudden recent decline. Apart from 1966/76 and 1967/68 when counts were in the region of 2,500 birds the pattern for Mallard numbers was of a steady increase from c500 birds in 1970/71 to 1,000-1,500 birds in 1993/94. After this, there was a sudden decrease and the number of birds has remained at 600-800 birds over the past 5 winters. As the Firth of Forth is one of the two sites in the UK that is internationally important for Goldeneye, it should be noted that this species almost triggered an Alert over 25 years. Numbers on the Forth fell from 3,000-3,500 birds in the 1970s to 500 in the mid-1980s. Numbers have recovered from this data and are still on an upward trend at 2,000-2,500 currently. Firth of Tay and Eden Estuary Cited species: Cormorant, Shelduck, Goldeneye, Red-breasted Merganser, Oystercatcher, Grey Plover, Sanderling, Dunlin, Black-tailed Godwit, Bar-tailed Godwit, Redshank. 50% Alerts: Shelduck, Red-breasted Merganser, Redshank Shelduck have been in a steady long-term decline in the Firth of Tay and Eden Estuary. Numbers have dropped from 1,000-1,750 birds to the current average of 500-750 birds. The rate of decline appears to have increased over time. Red-breasted Mergansers have shown an odd pattern of occurrence on this site. The average number of birds recorded on this site during the first 15 years of counts was less than 30. Throughout the 1980s, an average of up to 350 birds per month were recorded and then from 1990/91 number returned to their former levels of less than 50 birds. This sudden increase and then decrease triggered a 10 year Alert. This sudden increase of birds tended to occur in the early part of the count period. Large number of birds tended to occur in October each year and then disappear after a month or two. The set of months over which Red-breasted BTO Research Report No. 239 March 2000
91
Mergansers are indexed in Great Britain begins in October and it is likely that these large post-breeding flocks would have been there in September. Although count quality was poor initially there does seem to have been a decline in the number of Redshank wintering in this site from c2,000 birds at the start of counts to 1,000 currently. Inner Clyde Estuary Cited species: Redshank 50% Alert: Redshank Redshank underwent a large decline from a peak of 7,000 birds to c2,000 birds in 1981/82. Since 1981/82 numbers continued to decline, albeit at a much slower rate, to c1,000 birds. However, the count in 1998/99 of 2,085 birds was the highest since 1984/85. Inner Moray Firth Cited species: Cormorant, Wigeon, Teal, Goldeneye, Red-breasted Merganser, Oystercatcher, Bar-tailed Godwit, Curlew & Redshank. 50% Alert: Cormorant, Red-breasted Merganser, Bar-tailed Godwit Counts of Cormorant fluctuate widely, ranging from less than ten to over 400 birds and there is no consistent pattern. The Alerts were triggered by a series of low counts over the past 3 winters (1996/97 to 1998/96) but these low counts are not unprecedented at this site and no consistent trend can be identified. Red-breasted Merganser numbers regularly vary between less than 10 over 1,000 birds per year. These large peaks tend to occur in December, January and February. There is no overall long-term trend indicated in the data. Bar-tailed Godwit numbers fluctuate from year to year but the underlying trend is of an increase from 500 birds at the start of counts to a peak of 2,000 to 2,500 birds in the mid1980s. Numbers remained at this level until the last two counts which have been of less than 1,000 birds, thus triggering a five year 50% Alert. Loch Eye / Cromarty Firth Cited species: Whooper Swan 50% Alert: Whooper Swan Whooper Swan numbers are generally very low on this site during the months over which the index is calculated. Apart from c700 birds which were recorded in 1990/91, 503 in 1979/80 and 185 in 1972/73 numbers remained low and the Alerts system is not a good method to determine any long term trend. The population level of 213 birds listed for the SPA is based not only on WeBS data but also additional counts outside the WeBS scheme.
BTO Research Report No. 239 March 2000
92
Loch of Boardhouse Cited species: Pochard 50% Alert: Pochard Pochard numbers have varied widely at this site. From the start of counts in 1966/67 counts were generally in the order of 500 birds although in four winters more than 1,000 birds were recorded. From 1986-1994, approximately 1,000 birds occurred on site and since then numbers have plummeted and the last winters counts averaged only 84 birds per month, triggering 50% Alerts. The apparent increase over the whole time period is triggered by the fact that the smoothed index overestimates the final years count which means there is an apparent increase on the 100 birds recorded for 1966. Loch of Skene Cited species: Whooper Swan, Goldeneye, Goosander. 50% alert: Whooper Swan, Goosander Whooper Swan numbers were traditionally very low (1,000 Canada Goose n/a n/a n/a Dark-bellied Brent Goose 5 5 113 Shelduck 12 54 7 Wigeon 40 -14 248 Gadwall 38 226 414 Teal -18 -7 -47 Mallard 97 120 133 Pintail -30 -41 -63 Shoveler -38 -78 -62 Pochard -14 -31 -9 Tufted Duck 28 -7 75 Goldeneye -19 103 130 Red-breasted Merganser -71 -52 30 Goosander >1,000 >1,000 >1,000 Ruddy Duck -12 n/a 5 Coot 10 34 65 Oystercatcher n/a n/a n/a Avocet 9 31 77 Ringed Plover 47 404 >1000 Grey Plover 36 -38 -41 Knot 14 61 24 Sanderling 33 -22 43 Dunlin 358 390 >1,000 Black-tailed Godwit -11 -11 12 Bar-tailed Godwit 33 35 166 Curlew 6 -21 59 Redshank -32 -13 44 Turnstone
5yr 26 -34 -28 7 -98 -27 n/a n/a 50 n/a -9 4 -35 35 2 88 -55 -54 -13 0 -22 -24 218 -29 6 n/a -10 21 -1 29 8 329 -10 -5 0 -29
10yr 59 4 13 19 -97 -55 n/a n/a 60 n/a 8 16 15 33 -17 47 -109 -130 -11 19 -60 -279 97 -14 9 n/a 6 52 49 -7 51 380 -12 27 4 -28
25yr n/a n/a n/a 32 -97 -7 n/a n/a 334 n/a 13 59 -58 202 1 206 -72 -83 -31 -10 109 -39 >1,000 n/a 39 n/a 35 585 -49 33 -8 424 -15 42 -13 -11
All 206 14 15 40 -95 4 n/a n/a >1,000 n/a 94 26 65 327 -33 112 -73 -74 -9 53 53 20 >1,000 -12 48 n/a 58 887 -41 -30 28 >1,000 33 110 27 30
5yr + -
10yr ++
-n/a n/a ++ n/a
--n/a n/a ++ n/a
25yr n/a n/a n/a + --
All ++
n/a n/a ++ n/a
n/a n/a ++ n/a ++ + ++ ++ ++ ---
++ -++
+
+
++ ---
+ ---
++ ---
--++
++ ++ n/a + n/a + ++ +
++ n/a
n/a + +
+ ++
-
++ ++
++
+
+
-
+ --
++ ++ ++ + n/a ++ ++ + ++ + ++ + +
Pop size 1998 259 419 1,500 2,500 0 950 0 0 818 0 5,000 42,500 19 14,000 22,500 2,500 150 2,000 6,000 3,000 969 458 45 5,000 59,000 0 2,000 2,000 22,500 341 37,000 571 7,500 13,500 18,500 2,500
Cromarty Firth Dornoch Firth and Loch Fleet Firth of Forth Firth of Tay and Eden Estuary Inner Clyde Estuary Inner Moray Firth Loch Eye Loch of Boardhouse Loch of Skene Loch of Strathbeg Lochs of Spiggie and Brow Montrose Basin River Spey - Insh Marshes Ythan Estuary, Sands of Forvie and Meikle Loch
BTO Research Report No. 239 March 2000
Wigeon
Whooper Swan
Turnstone
Teal
Shelduck
Sanderling
Ringed Plover
Redshank
Red-breasted Merganser
Pochard
Pintail
Oystercatcher
Mallard
Knot
Grey Plover
Great Crested Grebe
Goosander
Goldeneye
Dunlin
Curlew
Cormorant
Black-tailed Godwit
Species which are cited/proposed for SPAs in Scotland which are currently covered by the Waterbird Alert System.
Bar-tailed Godwit
Table 5.2
96
Species which are cited for Scottish SPAs but which are not currently covered by the Waterbird Alert System.
Black Cart Bridgend Flats, Islay Caithness Lochs Cameron Reservoir Castle Loch, Lochmaben Coll Cromarty Firth Din Moss - Hoselaw Loch Dornoch Firth and Loch Fleet East Sanday Coast Eilean na Muice Duibhe/Duich Moss, Islay Fala Flow Feur Lochain (part of Rinns of Islay) Firth of Forth Firth of Tay and Eden Estuary Glac na Criche (part of Rinns of Islay) Gladhouse Reservoir Greenlaw Moor Gruinart Flats, Islay Inner Moray Firth Kintyre Goose Roosts Laggan, Islay Loch Eye Loch Ken and River Dee Marshes Loch Leven Loch Lomond Loch of Inch and Torrs Warren Loch of Kinnordy Loch of Lintrathen Loch of Skene Loch of Strathbeg Loch Spynie Lochs Druidibeg, a` Machair Monach Isles Montrose Basin Moray and Nairn Coast Muir of Dinnet North Sutherland Coastal Islands North Uist Machair and Islands Phase 1 Rinns of Islay Shiant Isles Slamannan Plateau South Tayside Goose Roosts South Uist Machair and Lochs Switha Tiree Wetlands Treshnish Isles Westwater Ythan Estuary, Sands of Forvie and Meikle Loch
BTO Research Report No. 239 March 2000
Velvet Scoter
Slavonian Grebe
Scaup
Red-throated Diver
Red-necked Grebe
Purple Sandpiper
Pink-footed Goose
Long-tailed duck
Lapwing
Greylag Goose
Greenland White-fronted Goose
Golden Plover
Eider
Common Scoter
Barnacle Goose
Turnstone
Sanderling
SPECIES WHICH ARE NOT REGULARLY INDEXED BY WeBS
Ringed Plover
Oystercatcher
Dunlin
Bar-tailed Godwit
Wigeon
Whooper Swan
Tufted Duck
Teal
Shoveler
Red-breasted Merganser
Pochard
Light-bellied Brent Goose
Goldeneye
Gadwall
Cormorant
SPECIES WHICH ARE REGULARLY INDEXED BY WeBS
Bean Goose
Table 5.3
97
BTO Research Report No. 239 March 2000
Table 5.4
5-year Alert
Population change (%) and Site Alerts for waterbirds on SPAs in Scotland over 5, 10, 25 and all years. (++ / -- = 50% Alert, + / - = 25% Alert).
10-year Alert
+
25-year Alert
All years Alert
5-year change
10-year change
25 year change
All years change
First count
Last count
--
--
21
1
-71
-68
72
n/a n/a n/a n/a ++
++
++ +
3 18 24 -9 52 -21
-24 50 -20 -1 136 -50
n/a n/a n/a n/a 121 -23
175 -21 83 8 971 31
++
Species
Site
98
Redshank
Inner Clyde Estuary
70 70 70 70 66 67
98 98 98 98 98 98
Oystercatcher Knot Dunlin Redshank Shelduck Wigeon
Montrose Basin Montrose Basin Montrose Basin Montrose Basin Montrose Basin Montrose Basin
++ --
-++ --
n/a n/a n/a
-++
-++ ++
-100 71 -75
n/a n/a n/a
-100 75 -2
-100 1,654 974
66 68 67
98 98 98
Whooper Swan Goldeneye Goosander
Loch of Skene Loch of Skene Loch of Skene
++ ++ ++
+ ++ +
++ ++ ++
++ ++ -
102 455 114
42 111 33
54 11,787 81
394 4,360 -44
66 66 66
98 98 98
Whooper Swan Teal Goldeneye
Loch of Strathbeg Loch of Strathbeg Loch of Strathbeg
++
++
++
++
87
148
249
359
69
98
Redshank
Ythan Estuary, Sands of Forvie and Meikle Loch
++
n/a
++
11
58
n/a
117
72
96
Whooper Swan
River Spey - Insh Marshes
++
75
n/a
-22
16,128
67
98
Whooper Swan
Loch Eye
--+ ++ ++
-84 -33 -9 7 62
-92 -33 59 -16 63
-90 -37 -30 186 32
-98 -70 29 1,009 71
66 66 66 66 70
98 98 98 98 98
Whooper Swan Wigeon Pintail Red-breasted Merganser Oystercatcher
Cromarty Firth Cromarty Firth Cromarty Firth Cromarty Firth Cromarty Firth
98
++
++
n/a
--
-++
++
++
-++ +
BTO Research Report No. 239 March 2000
5-year Alert
All years Alert
5-year change
10-year change
25 year change
All years change
First count
Last count
++ ++ ++
23 -11 74 26 34
316 40 117 50 -18
166 -11 70 34 -45
-9 54 131 84 -7
70 70 70 70 70
--
++
-84
-81
-81
73
+ + +
++ ++ + ++ ++ ++
++ ++ ++ ++ ++ ++
33 10 -21 -3 9 9
1 48 -16 43 50 43
125 642 39 275 215 151
-
-
n/a --
-
-++
++ ++ ++
++
++
++ -
++ --
-11 -40 9 -27 -8 -1 23 -14 61 5 15
-3 -33 1 -82 -26 60 -23 15 117 0 -7
n/a n/a
++ ++
++
-++ ++ ++ ++ ++
-26 -9 20 24 -51 6 -1 -7 12 -8
17 95 -18 47 -40 102 79 5 -10 35
++ + +
--
10-year Alert
25-year Alert
++ + ++ ++
++
--
+ +
99
++
++
++
--
+ ++ ++
+
++ + -
++ + ++
Species
Site
98 98 98 98 98
Knot Dunlin Bar-tailed Godwit Curlew Redshank
Cromarty Firth Cromarty Firth Cromarty Firth Cromarty Firth Cromarty Firth
66
98
Pochard
Loch of Boardhouse
123 1,193 82 830 641 167
66 66 70 70 70 70
98 98 98 98 98 98
Wigeon Teal Oystercatcher Dunlin Bar-tailed Godwit Curlew
Dornoch Firth and Loch Fleet Dornoch Firth and Loch Fleet Dornoch Firth and Loch Fleet Dornoch Firth and Loch Fleet Dornoch Firth and Loch Fleet Dornoch Firth and Loch Fleet
n/a -54 2 22 -22 279 -20 -33 129 -35 -31
-46 92 87 641 -8 579 -18 -34 312 -37 -57
86 66 66 66 70 70 69 70 70 70 70
98 98 98 98 98 98 98 98 98 98 98
Cormorant Shelduck Goldeneye Red-breasted Merganser Oystercatcher Grey Plover Sanderling Dunlin Black-tailed Godwit Bar-tailed Godwit Redshank
Firth of Tay and Eden Estuary Firth of Tay and Eden Estuary Firth of Tay and Eden Estuary Firth of Tay and Eden Estuary Firth of Tay and Eden Estuary Firth of Tay and Eden Estuary Firth of Tay and Eden Estuary Firth of Tay and Eden Estuary Firth of Tay and Eden Estuary Firth of Tay and Eden Estuary Firth of Tay and Eden Estuary
n/a n/a -11 63 16 -48 259 19 45 698
55 480 -21 -39 -77 62 509 148 114 2,582
82 86 66 66 66 66 66 69 69 69
98 98 98 98 98 98 98 98 98 98
Great Crested Grebe Cormorant Shelduck Wigeon Mallard Goldeneye Red-breasted Merganser Oystercatcher Ringed Plover Grey Plover
Firth of Forth Firth of Forth Firth of Forth Firth of Forth Firth of Forth Firth of Forth Firth of Forth Firth of Forth Firth of Forth Firth of Forth
BTO Research Report No. 239 March 2000
5-year Alert
100
10-year Alert
25-year Alert
All years Alert
5-year change
10-year change
25 year change
All years change
First count
Last count
--
--
++
-2 20 5 5 14 -34
-10 81 -24 27 16 -46
-61 -34 -13 11 44 19
-56 22 38 195 240 133
69 69 69 69 69 69
-91 22 42 22 -84 12 -55 -2 -8
-90 11 71 0 -73 15 -48 15 -15
n/a 240 686 369 66 75 -36 119 27
-93 79 728 14,397 169 219 -15 171 48
n/a
9
25
-5
+ + -
-
--
--
+
++
--
--
--
-
n/a
n/a ++ ++ ++ ++ ++ ++ +
+ ++ ++ ++
-++ ++ ++ ++ ++ ++ +
Species
Site
98 98 98 98 98 98
Knot Dunlin Bar-tailed Godwit Curlew Redshank Turnstone
Firth of Forth Firth of Forth Firth of Forth Firth of Forth Firth of Forth Firth of Forth
86 66 66 66 66 70 70 70 70
98 98 98 98 98 98 98 98 98
Cormorant Wigeon Teal Goldeneye Red-breasted Merganser Oystercatcher Bar-tailed Godwit Curlew Redshank
Inner Moray Firth Inner Moray Firth Inner Moray Firth Inner Moray Firth Inner Moray Firth Inner Moray Firth Inner Moray Firth Inner Moray Firth Inner Moray Firth
68
95
Whooper Swan
Lochs of Spiggie and Brow
3,500
Little Grebe
Whooper Swan
3,000
250
Number of birds
Number of birds
. 300 200 150 100 50
2,500 2,000 1,500 1,000 500
1965
1970
1975
1980
1985
1990
1995
1965
2000
1970
1975
1980
Great Crested Grebe
Number of birds
Number of birds
900 800 700 600 500 400 300 200 100
1965
1970
1975
1980
1985
1990
1995
1,000 900 800 700 600 500 400 300 200 100
2000
1965
1,500 1,000 500
1970
1975
1980
1970
1975
1980
1985
1990
1995
1995
2000
1990
1995
2000
1990
1995
2000
1995
2000
5,000 4,000 3,000 2,000
2000
1965
1970
1975
1980
Mute Swan
Number of birds
2,500 2,000 1,500 1,000 500 1965
1970
1975
1980
1985
1990
1995
50,000 45,000 40,000 35,000 30,000 25,000 20,000 15,000 10,000 5,000
2000
Wigeon
1965
1970
1975
1980
Years
Number of birds
Bewick's Swan
60 50 40 30 20 10 1975
1980
1985
1990
1995
2000
90 80 70 60 50 40 30 20 10
Gadwall
1965
Years
Figure 5.1
1985
Years
80
1970
1985
Years
3,000
Number of birds
1990
Shelduck
Years
Number of birds
1985
1,000
1965
1965
2000
6,000
Number of birds
Number of birds
7,000
Cormorant
2,000
70
1995
Years
2,500
3,500
1990
Canada Goose
Years 3,000
1985
Years
Years
1970
1975
1980
1985
1990
Years
Changes in the average number of birds recorded per month on WeBS sites in Scotland (Underhill & smoothed GAM).
Research Report No. 239 March 2000
101
Draft - Confidential
Number of birds
14,000
Teal
Number of birds
16,000 12,000 10,000 8,000 6,000 4,000 2,000
1965
1970
1975
1980
1985
1990
1995
10,000 9,000 8,000 7,000 6,000 5,000 4,000 3,000 2,000 1,000
2000
Tufted Duck
1965
1970
1975
1980
45,000 40,000 35,000 30,000 25,000 20,000 15,000 10,000 5,000
6,000
Mallard
1970
1975
1980
1985
1990
1995
Number of birds
Number of birds
2000
1990
1995
2000
1990
1995
2000
1995
2000
2,000
2,500
2,500 2,000 1,500 1,000
1965
1970
1975
1970
1975
1980
1985
900 800 700 600 500 400 300 200 100
1990
1995
Red-breasted Merganser
1,000 500
1965
1970
1975
Goosander
1980
1985
1990
1995
2,000 1,500 1,000 500
2000
1965
1970
1975
1980
1985
Years 80
Pochard
Number of birds
70
12,000 10,000 8,000 6,000 4,000 2,000
Ruddy Duck
60 50 40 30 20 10
1970
1975
1980
1985
1990
1995
2000
1965
Years
Figure 5.1
1985
2,500
Years
1965
1980
Years
Number of birds 1975
1985
1,500
2000
Shoveler
1970
1980
2,000
Years
Number of birds
1995
3,000
Years
500
Number of birds
1990
Goldeneye
1965
Pintail
14,000
2000
4,000
2000
3,000
16,000
1995
5,000
Years
1965
1990
1,000
1965 3,500
1985
Years
Number of birds
Number of birds
Years
1970
1975
1980
1985
1990
Years
Continued.
Research Report No. 239 March 2000
102
Draft - Confidential
Number of birds
7,000
1,200
Coot
Number of birds
8,000 6,000 5,000 4,000 3,000 2,000
Sanderling
1,000 800 600 400 200
1,000 1965
1970
1975
1980
1985
1990
1995
0 1965
2000
1970
1975
1980
Years 70,000
80,000
Oystercatcher
70,000
Number of birds
Number of birds
60,000 50,000 40,000 30,000 20,000 10,000
1995
2000
1990
1995
2000
1990
1995
2000
1995
2000
1995
2000
Dunlin
60,000 50,000 40,000 30,000 20,000
1970
1975
1980
1985
1990
1995
0 1965
2000
1970
1975
1980
Years
1985
Years 16,000
Ringed Plover
14,000
2,000
Number of birds
Number of birds
1990
10,000
0 1965 2,500
1985
Years
1,500 1,000 500
Bar-tailed Godwit
12,000 10,000 8,000 6,000 4,000 2,000
0 1965
1970
1975
1980
1985
1990
1995
0 1965
2000
1970
1975
Years 600
Grey Plover
2,500 2,000 1,500 1,000 500 0 1965
Black-tailed Godwit
500 400 300 200 100
1970
1975
1980
1985
1990
1995
0 1965
2000
1970
1975
1980
Years 50,000 Knot 45,000 40,000 35,000 30,000 25,000 20,000 15,000 10,000 5,000 0 1965 1970
16,000 14,000
1990
Curlew
12,000 10,000 8,000 6,000 4,000 2,000
1975
1980
1985
1990
1995
0 1965
2000
Years
Figure 5.1
1985
Years
Number of birds
Number of birds
1985
Years
Number of birds
Number of birds
3,000
1980
1970
1975
1980
1985
1990
Years
Continued.
Research Report No. 239 March 2000
103
Draft - Confidential
Redshank
25,000
Number of birds
Number of birds
30,000
20,000 15,000 10,000 5,000 0 1965
1970
1975
1980
1985
1990
1995
2000
Years
Figure 5.1
4,500 Turnstone 4,000 3,500 3,000 2,500 2,000 1,500 1,000 500 0 1965 1970 1975
1980
1985
1990
1995
Years
Continued.
Research Report No. 239 March 2000
104
Draft - Confidential
2000
15
(a) SCOTTISH SPAs 5 year changes
Montrose Basin
River Spey - Insh Marshes
Ythan Estuary, Sands of Forvie and Meikle Loch
River Spey - Insh Marshes
Ythan Estuary, Sands of Forvie and Meikle Loch
Loch of Strathbeg Loch of Strathbeg
Montrose Basin
Loch of Skene Loch of Skene
Lochs of Spiggie and Brow
Loch of Boardhouse Loch of Boardhouse
Lochs of Spiggie and Brow
Loch Eye
Inner Moray Firth Inner Moray Firth
Loch Eye
Inner Clyde Estuary
Firth of Forth
Firth of Tay and Eden Estuary
-5
Dornoch Firth and Loch Fleet
0
Inner Clyde Estuary
5
Cromarty Firth
INDEX OF CHANGE (%)
10
-10
15
(b) SCOTTISH SPAs 10 year changes
Firth of Tay and Eden Estuary
-5
Firth of Forth
0
Dornoch Firth and Loch Fleet
5
Cromarty Firth
INDEX OF CHANGE (%)
10
-10
Figure 5.2 (a-c)
Research Report No. 239 March 2000
Changes in the numbers of waterbirds across Scottish SPAs over 5,10 and 25 years. The change index is calculated by summing the Alerts for all species in an SPA, where a 50% negative Alert is given a value of –2, a 25% negative Alert –1 a 25% positive Alert +1 and a positive 50% Alert +2. The index indicates direction of trends and so, if an SPA, has 10 species which are all increasing, the index would be a large positive value and vice versa. If some were going up and some going down an index value of close to zero would be expected. The size of the index also indicates to some extent important SPAs (those with larger numbers of cited species). A large negative value indicates that the SPA supports large numbers of internationally important birds and that there is a general decline across species.
105
Draft - Confidential
-5
Figure 5.2 (a-c)
Research Report No. 239 March 2000
106
Continued.
Draft - Confidential
River Spey - Insh Marshes
Ythan Estuary, Sands of Forvie and Meikle Loch
-10 Montrose Basin
Lochs of Spiggie and Brow
Loch of Strathbeg
Loch of Skene
Loch of Boardhouse
Loch Eye
Inner Moray Firth
Inner Clyde Estuary
Firth of Tay and Eden Estuary
Firth of Forth
Dornoch Firth and Loch Fleet
Cromarty Firth
INDEX OF CHANGE (%) 15
(c) SCOTTISH SPAs 25 year changes
10
5
0
6.
WALES
6.1
Population Change and Alerts
Figure 6.1 shows the changes in number of all regularly indexed waterbird species in Wales. Table 6.1 shows the population change and 5, 10, 25 and all year Alerts generated by using GAMs (see Chapter 1 for details). Five species have triggered 50% Alerts, 10 species generated 25% Alerts and the remaining species are either stable or increasing.
European White-fronted Goose, Shoveler, Ringed Plover, Knot and Bar-tailed Godwit generated a 50% Alert under the GAM method.
Cormorant, Feral Greylag Goose, Wigeon, Mallard, Pochard, Oystercatcher Grey Plover, Dunlin, Redshank and Turnstone generated a 25% Alert using GAMs.
Using 199 bootstraps, the change measures for Alerts raised for the following species were not significantly below zero: Greylag Goose, Pochard, Wigeon, Bewick’s Swan, and Whooper Swan.
Using the Underhill technique the following differences were found: the Alerts for Wigeon, Mallard and Pochard were elevated to a 50% Alert, Gadwall, Tufted Duck, Goldeneye, Red-breasted Merganser triggered a 25% Alert and Cormorant did not trigger an alert.
All other species are stable or increasing.
6.2
Coverage of SPAs by the Waterbird Alert System
Coverage in Wales was good with 27 out of the 29 species/site combinations having sufficient data to perform Alerts. Only Spotted Redshank on the Burry Inlet and Greenland White-fronted Goose on the Dyfi Estuary were not included. For the Severn Estuary it is possible to extract WeBS data at country level. We have presented Alerts for the Welsh section but have discussed the changes at a whole SPA level rather than split it on a country basis. This discussion, along with the Dee Estuary appear in Chapter 3. 6.3
Species Generating a 50% Alert Using GAMs
European White-fronted Goose National Situation: Declining Numbers of White-fronted Goose in Wales have deceased dramatically from a peak of 1,500 birds in the early 1970s to less than 10 in recent years. This has resulted in 50% Alerts over all periods considered. Shoveler National Situation: Increasing Shoveler numbers in Wales have fluctuated greatly across years. The smoothed index indicates peaks of over 130 in the late 1970s and late 1980s and a decline of over 50% in the last 10 years.
Research Report No. 239 March 2000
107
Draft - Confidential
Ringed Plover
National Situation: Stable
After initial fluctuations, numbers of Ringed Plover in Wales have shown a steady decline, dropping from 1,500 birds in the 1970s to 500 at present. This has resulted in 50% Alerts over 10-year and 25-year periods and for all years combined and a 25% alert for the last five years. Knot
National Situation: Initial Decline. Now Stable
Knot numbers in Wales have fluctuated greatly from year to year, but have shown an overall downward trend. Numbers peaked at almost 50,000 in the 1970s, but had declined to less than 10,000 by the last two winters. The smoothed index has indicated declines of over 50% over 10-year and 25-year periods and for all years combined and a decline of over 25% in the last five years. Bar-tailed Godwit
National Situation: Stable
Bar-tailed Godwit numbers in Wales have dropped from over 6,000 in the early 1970s to less than 1,000 since the mid-1980s. The smoothed index shows that numbers have been more stable since then, but has indicated declines of over 50% over the last 25 years and for all years combined. 6.4 Species Triggering a 25% Alert Using GAMs Cormorant
National Situation: Increase then Decrease
Numbers of Cormorants in Wales rose from less than 200 in 1986/87 to almost 900 in 1994/95. A subsequent decline to less than 500 has resulted in a 25% Alert being triggered for the past five years. Over all years considered, however, the species has still shown an upward trend of over 50%. Feral Greylag Goose
National Situation: Increasing
The population of feral Greylag Geese in Wales has shown an upward but fluctuating trend since the 1960s, when less than 100 were counted. The population had reached 2,500 by the late 1980s, but has declined since, triggering a 25% Alert for the past 10-year period. Over the past 25 years and all years combined, however, the population has shown increases of over 50%. Wigeon National Situation: Increasing
Numbers of Wigeon in Wales have shown long-term fluctuations, rising to a peak of over 35,000 in 1986/87 but declining subsequently to previous levels of 10-20,000. The smoothed index indicates a decline of over 25% over the past 10-year period but an increase of over 25% over all years considered. Mallard
National Situation: Slight recent decrease
Mallard numbers in Wales rose to over 6,000 by the early 1980s but have since gradually declined to present levels of around 3,000. 25% Alerts have been triggered for the past fiveand 10-year periods. Pochard
National Situation: Stable
Pochard in Wales have shown a long-term, but fluctuating, decrease in numbers and an Alert has been issued for a drop of over 25% for all years considered. Numbers fell from 1,800 in the 1960s to around 800 by the late 1970s. A subsequent increase to numbers of between 1,000 and 1,700 has been followed by a further fluctuating decline.
Research Report No. 239 March 2000
108
Draft - Confidential
Oystercatcher
National Situation: Increasing
Oystercatcher numbers in Wales rose from under 40,000 in the 1970s to over 50,000 during the 1980s. A decline of over 25% since then to 1970s levels has given rise to a 10-year alert. Grey Plover
National Situation: Increasing
Grey Plover numbers in Wales have fluctuated widely from year to year, but when smoothed, they showed a pattern of gradual increase until the late-1980s followed by gradual decline. The index indicates a population of over 2,000 in the 1980s declining to one of less than 1,500 at present. This has triggered a 25% Alert for the last 10-year period. Over all years combined, however, Grey Plover have shown an increase of over 50% in number. Dunlin National Situation: Fluctuating/Stable
Dunlin numbers in Wales have shown a fluctuating pattern and have triggered an alert due to a decrease of over 25% over the past 25 years. Numbers peaked in the early 1970s at over 80,000 but had declined to 40,000 by 1985/86. Numbers have shown a slight increase and more stability since. Redshank
National Situation: Increasing/Stable
Numbers of Redshank in Wales rose to a peak of over 12,000 in the late 1980s, but have declined since to around 7,000. This has resulted in a 25%. Alert being triggered for the past 10-year period. Turnstone
National Situation: Decrease followed by Increase
Turnstone numbers peaked in Wales at around 2,000 birds in the late 1980s. The population declined sharply after this to around 1,000 birds, a similar number to that found in the 1970s, but has since stabilised. The decline over the past 10 years has resulted in a 25% Alert. 6.5
Site Alerts – Special Protection Areas (SPAs) in Wales
Burry Inlet Cited Species: Black-tailed Godwit, Curlew, Dunlin, Knot, Oystercatcher, Pintail, Shelduck, Shoveler 50% Alert: Black-tailed Godwit, Grey Plover, Knot, Turnstone Over 5 and 25 years there has been a general increase of waterbirds in the Burry Inlet. However, over 10 years the index of change, calculated by summing the alerts (where a negative 50% Alert equals –2, a negative 25% Alert –1, a positive 25% Alert +1 and a positive 50% Alert +2), is low at an index of –6. An arbitrary cut-off point of –5 has been used to flag up sites which are showing declines across most species. Numbers of Black-tailed Godwit on the Burry Inlet dropped from a peak of over 100 in 1972/73 to zero in 1975/76 and remained low over much of the next decade. Numbers subsequently rose to between 50 and 80 during the mid-1990s before dropping again to less than 30 in the winter of 1998/99. This final decrease has resulted in a five-year Alert. Grey Plover rose in number on the Burry Inlet from around 200 in the early 1970s to over 600 by the late 1990s. A decline since then to fluctuating numbers of between 60 and 300 has triggered a ten-year Alert.
Research Report No. 239 March 2000
109
Draft - Confidential
Numbers of Knot have fluctuated markedly on the Burry Inlet, varying between an initial peak of almost 6,000 to less than 200 in the winters of 1978/79, 1991/92 and 1992/93. Overall the trend has been downward and there has been a drop of over 50% over all the years considered. Counts had fallen to around 2,000 by the last two winters. No Shoveler were counted on the Burry inlet until 1980/81, but have fluctuated greatly since. Peaks of 150 and 100 were recorded in 1988/89 and 1996/97 respectively, but over the last 10 years the overall trend has been downward with a drop in numbers of over 50%. Numbers of Turnstone on the Burry Inlet rose from around 200 in the early 1970s to over 1,500 by the mid-1980s. A sharp drop occurred after the winter of 1985/86, however, and since then numbers have declined further from an average of 200 to less than 100. This has resulted in Alerts being triggered for all time periods considered. Numbers of Shelduck, Teal, Pintail and Dunlin have shown long-term increases of over 50% on the Burry Inlet, whilst those of Wigeon, Oystercatcher, Curlew and Redshank have been more stable. Traeth Lafan/Lavan Sands, Conway Bay Cited Species: Oystercatcher 50% Alert: Oystercatcher Although numbers of Oystercatcher have fluctuated from year to year there has been an overall downward trend and declines of over 50% over the past five and 25 years. Severn Estuary Separate Alerts were calculated for the Gwent section of the Severn Estuary and are presented in Table 6.4. However we have only discussed the changes in waterbird numbers over the SPA as a whole. This discussion appears in Chapter 3. Dee Estuary The WeBS counts for the Dee Estuary are amalgamated at the whole estuary level and it is not possible to split the English and Welsh populations. The discussion of the Dee estuary appears in Chapter 3.
Research Report No. 239 March 2000
110
Draft - Confidential
BTO Research Report No. 239 March 2000
Table 6.1
Percentage change and Alerts over 5,10, 25 and all years of counts. For interpretation of symbols see section 1.6. Population size refers to the average number of birds per month recorded on the WeBS sites used. It was not possible to run the Underhill model for European White-fronted Goose due to Modelling errors. ALERTS CALCULATED USING GAMS
5-yr + + ----
10-yr ++
++ --++
+
111
+ ++
25-yr n/a n/a n/a ++ ---++ ++ ++ ++ ++ ++
--++ ++ ++ ++ + ++ ++
++ --
+ ++ ++
All ++ ++ ++ ++
++ ++
++ ++ n/a
++ ++ + ++ ++ ++ ++ +
-
--+ ++
-
-+ -+ --
-++ -+ ++ -++
ALERTS CALCULATED USING UNDERHILLMETHOD
WALES
5-yr 27 -5 -30 42 -54 -72 -89 15 20 5 -4 -13 -2 25 -26 64 23 -13 -5 -23 -7 124 53 15 -16
10-yr 109 -3 -2 102 -43 -87 -99 -42 106 10 -14 -25 49 -6 -36 -3 -51 -13 1 -7 -17 113 169 21 -35
25-yr n/a n/a n/a 157 -56 -89 -100 235 580 >1000 163 -2 250 186 -23 183 -16 -16 1 45 2 288 >1000 n/a 12
All 218 229 53 81 24 -86 -100 >1000 308 >1000 216 37 >1000 781 22 226 57 -49 27 155 441 >1000 >1000 40 -7
-50 -24 -47 24 12 -12 14 0 -21 9
-61 -46 -50 28 8 68 3 -7 -44 -46
-76 34 -81 6 -45 49 -89 22 -1 -12
-75 105 -79 48 -18 113 -84 63 10 11
Species Little Grebe Great Crested Grebe Cormorant Mute Swan Bewick's Swan Whooper Swan European White-fronted Goose Feral Greylag Goose Canada Goose Dark-bellied Brent Goose Shelduck Wigeon Gadwall Teal Mallard Pintail Shoveler Pochard Tufted Duck Goldeneye Red-breasted Merganser Goosander Ruddy Duck Coot Oystercatcher Avocet Ringed Plover Grey Plover Knot Sanderling Dunlin Black-tailed Godwit Bar-tailed Godwit Curlew Redshank Turnstone
5yr 46 10 -8 55 149 -70
10yr 58 8 15 46 77 -79
All 184 94 18 65 308 -50
5yr +
10yr ++
++ ++ --
+ ++ --
-112 68 20 -29 -93 31 3 -65 6 -194 -80 -32 -62 -28 41 64 12 -25
25yr n/a n/a n/a 110 -13 -84 see legend 288 449 >1000 146 -10 364 273 -20 188 -33 -42 -13 25 21 217 >1000 n/a 21
-30 73 -5 -7 -10 -33 43 -15 90 24 -33 -14 -50 -8 117 49 16 1
>1000 536 >1000 207 26 >1000 850 15 281 9 -54 2 70 276 838 >1000 23 11
++
-++
-41 -23 -26 22 14 11 88 1 -15 10
-51 -38 -4 30 14 266 23 -6 -37 -46
-71 70 -74 -19 -47 85 -87 18 13 -9
-67 121 -71 9 -29 70 -83 54 11 7
-
+
-+
25yr n/a n/a n/a ++ -++ ++ ++ ++ ++ ++
All ++ ++ ++ ++ -++ ++ ++ ++ + ++ ++
-++ -++ +
---+ ++
++ -
++
+
++ ++ ++ ++
++ ++ n/a
--
--
-
-++ --
-++ --
++ --
++ -++
+ ++ ++ -
Pop size 1998 110 155 439 187 0 3 6 910 608 795 4,500 11,000 41 5,500 3,000 1,500 48 712 956 109 103 68 110 2,500 34,000 0 339 1,000 5,000 766 49,000 851 654 11,000 6,500 877
Severn Estuary-WALES ONLY
Wigeon
White-fronted Goose
Turnstone
Tufted Duck
Teal
Shoveler
Shelduck
Redshank
Pochard
Pintail
Oystercatcher
Mallard
Knot
Grey Plover
Gadwall
Dunlin
Burry Inlet
Table 6.3
Curlew
SITE NAME Traeth Lafan/Lavan Sands, Conway Bay
Black-tailed Godwit
Species which are cited/proposed for SPAs in Wales and are covered by the Waterbird Alert System
Bewick`s Swan
BTO Research Report No. 239 March 2000
Table 6.2
Species which are cited for SPAs in Wales that are not currently covered by the Waterbird Alert System.
Burry Inlet
Spotted Redshank
Greenland White-fronted Goose
112 Dyfi Estuary
BTO Research Report No. 239 March 2000
Table 6.4 Population change (%) and Site Alerts for waterbirds on SPAs in Wales over 5, 10, 25 and all years. (++ / -- = 50% Alert, + / = 25% Alert) 5-year Alert ++ ++ ++ ++ ++
10-year Alert
---
25-year Alert
All years Alert
5-year change
10-year change
25 year change
All years change First count Last count Site
++
++
++ ++ ++
++ ++ ++
+ ++
+ -++ -
--
--
57 124 519 110 282 6 20 128 91 -51 48 79 -72
-20 -16 11 -9 -73 -31 -59 24 29 399 -28 -33 -78
220 15 544 506 >1000 -4 9 -46 32 166 -3 -35 -90
416 -20 571 178 >1000 -18 46 -60 114 -29 7 17 -68
66 66 66 66 66 69 69 69 69 69 69 69 69
98 98 98 98 98 98 98 98 98 98 98 98 98
Shelduck Wigeon Teal Pintail Shoveler Oystercatcher Grey Plover Knot Dunlin Black-tailed Godwit Curlew Redshank Turnstone
Burry Inlet Burry Inlet Burry Inlet Burry Inlet Burry Inlet Burry Inlet Burry Inlet Burry Inlet Burry Inlet Burry Inlet Burry Inlet Burry Inlet Burry Inlet
Species
113
++ ++ -+ ++ --
+ ++ --
--
-
---
--
-55 -27
-40 -39
-68 -50
-73 -14
69 69
98 98
Oystercatcher Curlew
Traeth Lafan/Lavan Sands, Conway Bay Traeth Lafan/Lavan Sands, Conway Bay
---
++ --
++ -++
--------
-----
++ -++ + ++ ++ ++ ++ -++ ++ --++
-69 -100 -15 -88 -99 -83 -35 -29 -98 -60 -77 -38 -57 -28
610 -100 -1 -94 -99 -74 -52 -14 -97 -70 -77 -70 -71 -56
>1000 -100 361 27 >1000 295 800 >1000 -100 >1000 >1000 -69 -73 114
>1000 -100 222 -8 >1000 . . >1000 . 724 >1000 . . .
66 66 66 66 66 73 73 66 73 66 66 73 73 73
98 98 98 98 98 98 98 98 98 98 98 98 98 98
Bewick`s Swan European White-fronted Goose Shelduck Wigeon Gadwall Teal Mallard Pintail Shoveler Pochard Tufted Duck Grey Plover Dunlin Redshank
Severn Estuary - Wales only Severn Estuary - Wales only Severn Estuary - Wales only Severn Estuary - Wales only Severn Estuary - Wales only Severn Estuary - Wales only Severn Estuary - Wales only Severn Estuary - Wales only Severn Estuary - Wales only Severn Estuary - Wales only Severn Estuary - Wales only Severn Estuary - Wales only Severn Estuary - Wales only Severn Estuary - Wales only
-------
++ N/A N/A ++ N/A ++ ++ N/A N/A N/A
Number of birds
140
Little Grebe
Number of birds
160 120 100 80 60 40 20
0 1965
1970
1975
1980
1985
1990
1995
2000
100 90 80 70 60 50 40 30 20 10 0 1965
Whooper Swan
1970
1975
1980
Years
1990
1995
2000
1,600
Great Crested Grebe
European White-fronted Goose
1,400
200
Number of birds
Number of birds
250
1985
Years
150 100 50
1,200 1,000 800 600 400 200
0 1965
1970
1975
1980
1985
1990
1995
0 1965
2000
1970
1975
1980
1,000 900 Cormorant 800 700 600 500 400 300 200 100 0 1965 1970 1975
3,000
2000
1990
1995
2000
1990
1995
2000
1990
1995
2000
2,500 2,000 1,500 1,000 500
1980
1985
1990
1995
0 1965
2000
1970
1975
1980
1985
Years
1,600 1,400
Number of birds
Number of birds
Canada Goose
1,200 1,000 800 600 400 200
1980
1985
1990
1995
0 1965
2000
1970
1975
1980
1985
Years 1,600
Mute Swan
1,400
200
Number of birds
Number of birds
1995
Feral Greylag Goose
Years 250
1990
3,500
Years 90 Bewick's Swan 80 70 60 50 40 30 20 10 0 1965 1970 1975
1985
Years
Number of birds
Number of birds
Years
150 100 50
Dark-bellied Brent Goose
1,200 1,000 800 600 400 200
0 1965
1970
1975
1980
1985
1990
1995
0 1965
2000
Years
Figure 6.1
1970
1975
1980
1985
Years
Changes in the average number of birds recorded per month on WeBS sites in Wales. = mean number of birds recorded per month, = smoothed average number of birds.
BTO Research Report No. 239 March 2000
114
Number of birds
Number of birds
9,000 Shelduck 8,000 7,000 6,000 5,000 4,000 3,000 2,000 1,000 0 1965 1970 1975
1980
1985
1990
1995
2000
2,000 1,800 Pintail 1,600 1,400 1,200 1,000 800 600 400 200 0 1965 1970
1975
Years 250 Wigeon
Number of birds
Number of birds
1985
1990
1995
2000
1990
1995
2000
1990
1995
2000
1990
1995
2000
1990
1995
2000
Years
40,000 35,000
1980
30,000 25,000 20,000 15,000 10,000
Shoveler
200 150 100 50
5,000 0 1965
1970
1975
1980
1985
1990
1995
0 1965
2000
1970
1975
90 Gadwall 80 70 60 50 40 30 20 10 0 1965 1970
1975
1980
1985
1990
1995
2000
2,000 1,800 1,600 1,400 1,200 1,000 800 600 400 200 0 1965
1970
1975
10,000
Number of birds
Number of birds
Teal 8,000 6,000 4,000 2,000
1975
1980
1985
1990
1995
2000
2,000 1,800 Tufted Duck 1,600 1,400 1,200 1,000 800 600 400 200 0 1965 1970 1975
Years 7,000
350
1980
1985
Goldeneye
300
Number of birds
6,000
Number of birds
1985
Years
Mallard
5,000 4,000 3,000 2,000 1,000 0 1965
1980
Years
12,000
1970
1985
Pochard
Years
0 1965
1980
Years
Number of birds
Number of birds
Years
250 200 150 100 50
1970
1975
1980
1985
1990
1995
0 1965
2000
Years
Figure 6.1
1975
1980
1985
Years
Continued.
BTO Research Report No. 239 March 2000
1970
115
160
Number of birds
Number of birds
120
Red-breasted Merganser
140 120 100 80 60 40
Ruddy Duck
100 80 60 40 20
20 0 1965
1970
1975
1980
1985
1990
1995
0 1965
2000
1970
1975
Number of birds
Years 100 90 Goosander 80 70 60 50 40 30 20 10 0 1965 1970 1975
1980
1985
1990
1995
2000
Years 3,500 Coot 3,000 2,500 2,000 1,500 1,000 500
1980
1985
1990
1995
0 1980
2000
1985
1990
1995
2000
Years 70,000
6,000
Oystercatcher
Number of birds
Number of birds
60,000 50,000 40,000 30,000 20,000
Sanderling
5,000 4,000 3,000 2,000 1,000
10,000 0 1965
1970
1975
1980
1985
1990
1995
0 1965
2000
1970
1975
Years 60,000
Ringed Plover
2,000 1,500 1,000 500 0 1965
1995
2000
1990
1995
2000
Knot
40,000 30,000 20,000 10,000
1970
1975
1980
1985
1990
1995
0 1965
2000
1970
4,500 Grey Plover 4,000 3,500 3,000 2,500 2,000 1,500 1,000 500 0 1965 1970 1975
1975
1980
1985
Years 120,000
Number of birds
Number of birds
1990
50,000
Years
Dunlin
100,000 80,000 60,000 40,000 20,000
1980
1985
1990
1995
0 1965 1970 1975 1980 1985 1990 1995 2000
2000
Years
Figure 6.1
1985
Years
Number of birds
Number of birds
2,500
1980
Years
Continued.
BTO Research Report No. 239 March 2000
116
16,000 14,000
Number of birds
Number of birds
2,000 Black-tailed Godwit 1,800 1,600 1,400 1,200 1,000 800 600 400 200 0 1965 1970 1975 1980
Redshank
12,000 10,000 8,000 6,000 4,000 2,000
1985
1990
1995
0 1965
2000
1970
1975
Years 3,000
Bar-tailed Godwit
10,000 8,000 6,000 4,000
2000
1990
1995
2000
Turnstone
2,000 1,500 1,000
1970
1975
1980
1985
1990
1995
0 1965
2000
Years
Number of birds
1995
500
0 1965
14,000
1990
2,500
2,000
16,000
1985
Years
Number of birds
Number of birds
12,000
1980
12,000 10,000 8,000 6,000 4,000 2,000 1970
1975
1980
1985
1990
1995
2000
Years
Figure 6.1
Continued.
.
BTO Research Report No. 239 March 2000
1975
1980
1985
Years
Curlew
0 1965
1970
117
7.
CONCLUSIONS
7.1
National Alerts
The Alerts process has reinforced the message given by the annual WeBS reports that, on a national basis, the majority of waterbirds wintering in the United Kingdom are stable or increasing. Only two species of wildfowl, European White-fronted Goose and Mallard, and two waders, Knot and Turnstone, have triggered a Medium (25% negative) Alert. One of the species of most concern is the European White-fronted Goose. Numbers in the UK are at their lowest ebb since counts began, and this species is now effectively extinct in Wales. The population in England, although a small part of the flyway population, has declined from over 10,000 birds to 4,000 currently. Numbers have remained effectively stable at 4,000 birds over the last five winters counts but have not shown an upturn. Mallard triggered a 10 year Alert and numbers have fallen from 140,000 to the current level of just over 100,000. This decline started in the mid-1980s and the UK population has changed from a population that was increasing slightly into one that is in sustained decline. The reasons for this are unknown. Alerts raised for individual sites (see Mallard map in Appendix 1) showed that over ten years the numbers of Mallard declined on all English SPAs for which they are cited but remained stable on most similar sites in Northern Ireland. The decline is most marked on some east coast SPAs, e.g. the Firth of Forth, the Humber Estuary and Stodmarsh, where number have continued to go down over the last five years. Numbers have remained stable on west coast SPAs but Belfast Lough showed a decline. Over 25 years, only one site, the Solway, has seen a large increase in the number of wintering birds. Knot triggered a Medium Alert over 25 years, due to the large decline in the wintering population in the early 1970s. As discussed in Chapter 2, this was probably due to a period of poor spring and summer weather in the Greenland breeding areas which increased adult mortality, through lack of food. This lack of food made the birds tame and more susceptible to hunting. Although now stable, there has been no return to former levels. Turnstone numbers have fluctuated over the past 30 years. They initially increased but are currently in decline and have returned to the level they were at in the early 1970s. The reasons for this are unknown. 7.2
Geographical Trends and Country Alerts
The Alerts process has highlighted that, although the majority of species are stable or increasing at a national level, many more species are decreasing at a country level (Table 7.1). The most extreme examples of these declines are Bar-tailed Godwit and European White-fronted Goose in Wales and Bewick’s Swan in Northern Ireland. There seems to be an east-west split, in that waterbird populations are generally decreasing in the west and increasing in the east. This especially seems to be the case to waders. Of the 11 species of wader that occur in Wales, seven triggered Alerts and only Curlew, Black-tailed Godwit and Sanderling are not in decline, whereas in England only Turnstone and Knot triggered an Alert. In Northern Ireland, the populations of some wildfowl are of great international significance and Alerts for Bewick’s Swan, Pochard and Goldeneye are worrying. BTO Research Report No. 239 March 2000
118
These changes may indicate a shift in the distribution of the wintering population as shown by other studies (Austin & Rehfisch 1999) rather than a true decline in numbers. The evidence from the UK population trends is that most of these species are increasing. This requires that either there are site specific factors occurring in Wales and Northern Ireland or that this shift is taking place due to some other large scale factor. Winters have become increasingly warmer throughout this century and this shift in bird populations may represent a response to climate change. 7.3
Site-based Alerts
7.3.1 Coverage Overall, 64% of the 967 species/site combinations which were requested had sufficient data to run Alerts (Table 7.2). The species which are currently outside the WeBS Alert System accounted for 25% of this total. For the species which are covered, an 85% coverage was achieved. Coverage varied between countries (Table 7.2). Very few SPAs are associated with Wales and a near 100% coverage was achieved. For England and Northern Ireland, reasonable coverage was achieved with 87% and 86% coverage for species currently included in the system and 70% and 68% overall. In contrast, data were only available for 39% of the requested Site Alerts in Scotland, highlighting how poorly that country is currently covered by this process. 7.3.2 Site Alerts Alerts present an opportunity to examine and measure change on a number of different scales. Site-based Alerts can be used in two ways. First, they give an effective picture of population change at individual sites over time. Individual species which are declining can be flagged up. Second, these Alerts can also be used to produce a picture of the general state of the populations on that site. To address this second point, we used a simple index of change for each site which was the sum of the Alert values totalled across all cited/proposed SPA species where negative Alerts were given negative values (50% Alert = -2, 25% Alert = -1) and positive Alerts positive values (25% Alert = +1, 50% Alert = +2). A high negative score indicated that large numbers of nationally or internationally important waterbirds had declined over that period. This index is a first attempt at highlighting sites where widespread declines are taking place among nationally or internationally important waterbird populations. The following sites had a high negative score: Over 25 years: Lindisfarne, indicating a general long term decline in a number of waterbird populations. Over 10 years: Chichester and Langstone Harbours, Lindisfarne, the Medway, the Welsh part of the Severn and the Wash, indicating medium-term declines across waterbird populations. Over 5 years: the Blackwater has shown a spectacular decline across species and Chichester and Langstone Harbours, the Severn, the Solent and Southampton Water, Belfast Lough, Loughs Neagh & Beg and the Inner Moray Firth have all shown lesser declines. Most other estuaries show general increases across species, notably Breydon Water and the North Norfolk Coast. This simple analysis can be taken further and the change in the populations at these sites can be examined between years. Figure 7.1 shows the mean annual percentage changes in all cited species for selected SPAs in England. These graphs show that populations fluctuate markedly over time but that general patterns can be BTO Research Report No. 239 March 2000
119
deduced. They also allow the identification of when turning points occur, i.e. for sites at which waterbird populations are declining, the turning points or the years in which the decline started, can be identified. In the example graphs shown in Figure 7.1, Chichester and Langstone Harbours showed a general increase across the populations of cited species until the winter of 1988/89 when populations started to decline. This decline has continued since and seems to be intensifying. The Blackwater Estuary is an estuary that has shown long-term increase in most species and, up until 1992/93, the rate of increase in numbers was increasing. However, the following winter saw a fall in the rate of increase and there has since been a short-term decline across most species. A similar case is seen in the Solent and Southampton Water where populations of birds were increasing until 1995/96 after which there was sharp fall since. In the Wash, populations of birds increased rapidly from the start of counts but the rate of increase declined and by 1989/90 there was overall stability on the Wash. This turning point coincided with crashes in the commercial shellfish stocks in the Wash. In 1997/98 numbers started to fall for the first time. Similar graphs are shown for sites where large increases have been identified, such as Breydon Water, the North Norfolk Coast, the Alde-Ore estuary and The Swale. Although fluctuating, there is an apparent upward trend on Breydon Water and the North Norfolk Coast, whereas the Swale and the Alde-Ore have shown periodic increases followed by stability. When considering population changes on SPAs as a whole in England, there has been an overall increase across all species. The average rate of increase was initially high at 14% a year and then declined to 1980 after which it increased again to 10% a year throughout the 1980s. From 1990 there has been a decline, indicating that the average rate of increase has slowed down. 7.4
Recommendations and Future Development of the Alerts System
7.4.1
Implementation of the Alerts System
As this is the first year of a new system there are, inevitably, problems with implementation. While the technical specification (i.e. GAMs & Underhill method) has worked well, a quick and efficient system of processing Alerts needs to be implemented. The national and country Alerts produce information that is easy to interpret. However, Site Alerts can produce a mass of confusing information and a method of highlighting those that are behaving atypically needs further development. In this first year, much time was spent developing methods to run the Alerts and inevitable this report has concentrated on species rather than sites. There was only limited time available to evaluate results or designing an output which condenses the appropriate information into an easily-digestible format.
7.4.2
Technical issues to be addressed
Site Alerts, in terms of the species and sites to run, should be clearly identified. A list of sites and species was provided by JNCC for this analysis. For future years, when SSSIs will be reported on, a similar list will be required. GIS coerages of these locations and boundaries would aid matching these sites to WeBS count section boundaries.
The data needs to be extractable in a quick and easy manner. In this analysis, two different database systems (one for waders and one for ducks) were used. A great deal of time was required to develop methods to deal with the two different sets of data. With the new database system, these methods will need to be modified again but, once in place, can be used in future years.
For some species which are not regularly indexed and currently lie outside the WeBS Alerts system, a method of extracting data from the WeBS database needs to be implemented.
Sites need to be matched up with WeBS sites. At present, more than one SPA can occur in a WeBS site and vice versa. For an effective system, WeBS sites will have to be split and the appropriate sectors used. Matching of SPAs and correct WeBS codes (NWC codes for wildfowl & BoEE codes for waders) took a disproportionate amount of time in this analysis.
BTO Research Report No. 239 March 2000
120
Further to this, it is essential that reporting sites can be defined in terms of WeBS count sections interactively in the database, and the database return all data summarised at the reporting site level with the completeness of compounded sites clearly indicated.
Some sites, which include more than one WeBS site, can suffer from count quality problems. If one or more of these WeBS sites are not counted, then missing data are imputed. In some cases the imputed count may make up a very large proportion of the estimated count and make the estimated count unrealistic. A cut-off point needs to be included to address this problem.
The large-scale approach used here has identified a number of problems:
The number of months over which birds are indexed for Alerts needs to be considered. For national and country Alerts, there is a case for using the existing series of months, as these months have been chosen as they refer to a period of stability in the populations. However for individual sites this may not be appropriate. For example, many ducks congregate to moult on some sites in late summer before moving on to winter elsewhere, and the current indexing months may miss internationally important populations at some sites. It may be more appropriate to index over all WeBS months (September to March) if data are available, rather than the current months.
WeBS counts of some species for some SPAs are generally low but have qualified due to high maximum counts. In some cases, these counts are from other sources (e.g. goose counts) or the site may only sporadically hold large numbers of birds (e.g. in cold weather). These sites should be identified during the Alerts process and excluded if they are not suited to the current system of Alerts.
These recommendations indicate that more preparatory work needs to be carried out, initially at the database level, and then in the methods used to implement the Site Alerts. The latter includes effective filtering of the data to exclude sites with poor quality or inappropriate data and devising methods to highlight the sites which are behaving atypically to the national and country picture. To assess change on sites, we would recommend an approach based on scoring change in comparison with the national or country trends rather than the current method used here. The graphs showing annual change of species were a useful indicator of how populations change on a site. This was an initial attempt at assessing inter-annual changes and in future, instead of expressing change as a percentage of the previous years population, expressing it as a percentage change of the flyway population may be more appropriate. This would reduce the problem of species which occur in small numbers contributing a disproportionate amount to the average change measure (e.g. a change from 2 to 20 birds is a 1,000% increase, whereas a change from 100,000 to 140,000 is only a 40% increase but probably more significant). However, it is necessary to be clear what scale this should be investigated. If the national or internationally important population is the important factor then the current approach is fine. If however, the proportionate change in the flyway population is important then weighting the annual changes by this value is necessary. In this analysis, SPAs were reported on. These are outstanding sites, and as such, tend to have a long series of counts associates with them. In future, when SSSIs are reported on data quality may be a much larger issue.
BTO Research Report No. 239 March 2000
121
Table 7.1 Summary of the Alerts issued in 2000, using the 1998/99 WeBS data. High Alerts refer to declines in the population of over 50% over 5, 10, 25 or all year periods; Medium Alerts refer to declines that are between 25% and 50% over similar time periods.
Species Little Grebe Great Crested Grebe Cormorant Mute Swan Bewick’s Swan Whooper Swan European White-fronted Goose Feral Greylag Goose Canada Goose Dark-bellied Brent Goose Light-bellied Brent Goose Shelduck Wigeon Gadwall Teal Mallard Pintail Shoveler Pochard Tufted Duck Goldeneye Red-breasted Merganser Goosander Ruddy Duck Coot Oystercatcher Avocet Ringed Plover Grey Plover Knot Sanderling Dunlin Black-tailed Godwit Bar-tailed Godwit Curlew Redshank Turnstone
BTO Research Report No. 239 March 2000
United Kingdom
England
Northern Ireland
Scotland
Wales
Medium Alert Medium Alert
Medium Alert
High Alert
High Alert
High Alert
Medium Alert
High Alert
High Alert
Medium Alert
High Alert Medium Alert
Medium Alert Medium Alert Medium Alert
Medium Alert
Medium Alert
Medium Alert
Medium Alert
High Alert
High Alert
Medium Alert
High Alert
Medium Alert
Medium Alert Medium Alert Medium Alert High Alert
Medium Alert Medium Alert
High Alert Medium Alert
Medium Alert
Medium Alert
High Alert
Medium Alert
High Alert
Medium Alert Medium Alert High Alert
High Alert Medium Alert
Medium Alert
Medium Alert
122
Medium Alert
Medium Alert
Medium Alert
Table 7.2
Coverage of the Site Alert species/site combinations by country and nationally.
Total species/site combinations requested England Northern Ireland Scotland Wales
661 96
Number referring Number for which % of species/site to species currently data were available combinations outside the WeBS successfully run for Alert system species currently covered 130 461 87% 20 65 86%
181 29
85 2
70 27
73% 100%
39% 93%
UK
967
237
623
85%
64%
BTO Research Report No. 239 March 2000
123
% of species/site combinations successfully run overall 70% 68%
Chichester and Langstone Harbours
50
Mean annual change across all species
Mean annual change across all species
10 8 6 4 2 0 1970 -2
1975
1980
1985
1990
1995
2000
-4 -6
Blackwater Estuary
Mean annual change across all species
Mean annual change across all species
20 10 0 1970
70
20 15 10 5 0 1970 -5
1975
1980
1985
1990
1995
2000
-10
1975
1980
1985
1990
1995
2000
1985
1990
1995
2000
1985
1990
1995
2000
1985
1990
1995
2000
25
1985
1990
1995
2000
50 40 30 20 10 0 1970 -10
1975
1980
-20
35
Mean annual change across all species
The Wash
20 15 10 5 0 1970 -5
1975
1980
1985
1990
1995
2000
North Norfolk Coast
30 25 20 15 10 5 0 1970 -5
1975
1980
-10
-10
20
80
Mean annual change across all species
Lindisfarne
15 10 5 0 1970 -5
1975
1980
1985
1990
1995
2000
-10 -15
Alde-Ore Estuary
70 60 50 40 30 20 10 0 1970 -10
1975
1980
-20
The Solent and Southampton Water
Mean annual change across all species
25
Breydon Water
60
-30
-15
Mean annual change across all species
30
-10
-8
Mean annual change across all species
The Swale
40
20 15 10 5 0 1970 -5
1975
1980
1985
1990
1995
2000
-10 -15
Figure 7.1
16
All English SPAs
14 12 10 8 6 4 2 0 1970
1975
1980
General indicator of inter-annual change of waterbirds on selected estuarine sites in England. The measure is calculated by taking the mean, across all species cited for the SPA, of the annual change in the smoothed index. The value for 1998 indicates the mean change in the smoothed index across all species from the winter 1997/98 to the winter of 1998/99. Sites on the left hand sides have shown recent declines in across many waterbird populations, those on the right increases. Values above the line indicate increasing populations, below declining.
BTO Research Report No. 239 March 2000
124
Acknowledgements
The Wetland Bird Survey is a joint partnership between the British Trust for Ornithology, The Wildfowl and Wetlands Trust, Joint Nature Conservation Committee (on behalf of English Nature, Scottish Natural Heritage, the Countryside Council for Wales and the Heritage Service in Northern Ireland) and the Royal Society for the Protection of Birds. We would especially like to thank Nicola Read for her sterling work in typesetting and producing the report.
BTO Research Report No. 239 March 2000
125
References Austin, G. & Rehfisch, M.M. (1999) Ringed Plovers go east. BTO News, 22, 14-15. Atkinson, P.W., Clark, N.A, Clark, J.A., Bell, M.C., Dare, P.J. & Ireland, P.L. (2000) The effects of changes in shellfish stocks and winter weather on shorebird populations: results of a 30 year study on the Wash, England. BTO Research Report No 238. British Trust for Ornithology, Thetford. Atkinson, P.W. & Rehfisch, M.M. (2000) Development of a national and regional alert system for waterbirds using generalized additive models. In National and site-based alert systems for UK birds. Richard D. Gregory, Mark M. Rehfisch, Les G. Underhill, Rob H. Field, Philip W. Atkinson, Stephen N. Freeman, Gavin M. Siriwardena and Stephen R. Baillie. BTO Research Report No. 226. British Trust for Ornithology, Thetford. Gregory, R.D., Rehfisch, M.M., Underhill, L.G., Field, R.H., Atkinson, P.W. Freeman, S.N., Siriwardena, G.M. and Baillie, S.R. (2000) National and site-based alert systems for UK birds. BTO Research Report No. 226. British Trust for Ornithology, Thetford. Underhill, L.G. & Prys-Jones, R. (1994) Index numbers for waterbird populations. I. Review and methodology. Journal of Applied Ecology, 31, 463-480.
BTO Research Report No. 239 March 2000
126