Poli, Wolfe, Backholer, De Courten, & Peeters, 2011; Kim et al., 2012). ...... Atienza, A. A., Moser, R. P., Perna, F., Dodd, K., Ballard-Barbash, R., Tronano, R. P., &.
USING TECHNOLOGY TO CHANGE ADULT SEDENTARY BEHAVIOUR, PHYSICAL ACTIVITY LEVELS AND TOTAL WELLNESS
FAISAL AWAD BARWAIS MSc, BSc
Submitted in fulfilment of the requirements for the degree of Doctor of Philosophy
School of Exercise and Nutrition Sciences Faculty of Health Queensland University of Technology 2013
Keywords
Physical activity, sedentary behaviour, the Wellness Evaluation of Lifestyle (WEL), sedentary behaviour assessment, accelerometer, anatomical position, inclinometer function, physical activity and sedentary behaviour intervention, online personal activity monitor.
i
Abstract Low levels of physical activity and high levels of sedentary behaviour are major public health concerns. Whilst the benefits of moderate-to-vigorous intensity physical activity for health benefits are well-documented, there remains a need for deeper understanding of the effects of sedentary behaviour and light intensity physical activity on total wellness. The construct of total wellness incorporates a holistic approach to body, mind and spirit.
A key goal of successful health
management is to achieve lifestyle changes which enhance total wellness. To initiate lifestyle change and more importantly to maintain these changes generally requires challenging long-term processes that require great personal motivation. This thesis by publication contributes to current literature by examining the role that technology can play in the promotion and support of an active lifestyle through selfmonitoring, goal setting and other behavioural strategies that increase physical activity and reduce sedentary time. The general aims of this dissertation are: 1) to provide baseline data to enhance our understanding of the effects of sedentary behaviour and physical activity levels on total wellness, 2) to provide an accurate self-report instrument to quantify sedentary behaviour and light-intensity physical activity among sedentary adults in all aspects of a free-living environment, and 3) to provide empirical evidence that using an online personal activity monitor to reduce sedentary time and increase physical activity levels may be associated with increased total wellness among sedentary adults. In order to examine these three general aims, five papers were designed, implemented, evaluated, published or submitted and these form the majority of this thesis. The five papers provide: (1) an examination of the differences in adult total wellness based on being in a group with high/low levels of sitting time combined with insufficient/sufficient physical activity; (2) the
ii
development of an accurate self-report instrument to quantify sedentary behaviour and light-intensity physical activity among sedentary adults in a free-living environment; (3) the establishment of the instrument validity and reliability; (4) information concerning the effects of an online personal activity monitor to reduce sedentary time and increase physical activity; and (5) the relationship between changes in sedentary behaviour, physical activity levels and total wellness. Each paper addresses the individual objectives of the overall study, in terms of its particular introduction, method results, discussion and conclusion.
iii
List of Publications Related to this Thesis 1-Barwais, F.A., Cuddihy T.F, & L. Michaud Tomson. (Submitted 6th May 2013, and revised and resubmitted 14th October 2013). Adult Total Wellness: Group Differences Based on Sitting Time and Physical Activity Level. BMC Public Health. 2- Barwais, F.A., Cuddihy T.F, Washington , T.L, L. Michaud Tomson, & Brymer, E. (In Press). Development and Validation of a New Self-Report Instrument for Measuring Sedentary Behaviours and Light-Intensity Physical Activity in Adults. Journal of Physical Activity & Health. 3- Barwais, F.A., Cuddihy T.F. (Manuscript submitted for publication). Reliability of the 7-day Sedentary and Light Intensity Physical Activity Log (7-day SLIPA Log). International Journal of Behavioral Nutrition and Physical Activity. 4- Barwais, F.A., Cuddihy T.F., & White, K. M. (under review). Empowering Sedentary Adults to Reduce Sedentary Behaviour and Increase Physical Activity Levels and Energy Expenditure: Success with a Technology-Based Physical Activity Monitor. Journal of Physical Activity & Health. 5- Barwais, F.A., Cuddihy T.F, & L. Michaud Tomson. (2013). Physical Activity, Sedentary Behaviour and Total Wellness changes among Sedentary Adults: A 4week Randomized Controlled Trial. Health and Quality of Life Outcomes, 11(1):183. 6- Barwais, F.A., Cuddihy T.F., Rachele J. N., & Washington , T.L. (2013). The ActiGraph GT3X determined variations in “free-living” standing still, lying and sitting duration among sedentary adults in different BMI categories. Journal of Sport and Health Science. (Online pre-print), http://dx.doi.org/10.1016/j.jshs.2013.06.003
iv
Other Publication 1- Rachele, J. N., Cuddihy, T. F., Washington, T. L., Barwais, F. A., & McPhail, S. (In Press). Valid and reliable assessment of wellness among adolescents: do you know what you’re measuring? International Journal of Wellbeing.
v
List of Presentations Related to this Thesis 1- Barwais, F.A., Cuddihy T.F, Washington , T.L, Brymer , E & Tomson, M.L. (2011). Development and Validation of a New Self-Report Instrument for Measuring Sedentary Behaviours in Adults. IHBI Inspires Postgraduate Student Conference. 24-25 November, Brisbane, Australia. 2- Barwais, F.A., Cuddihy T.F. Wellness and levels of physical activity among Adults. (2012). 37th Annual National Wellness Conference (NWC). 16-19 July, Wisconsin, USA. 3- Barwais, F.A., Cuddihy T.F & Tomson, M.L. (2012). “Free-living” standing, sitting and lying times among sedentary adults in different BMI categories. 4th International Congress on Physical Activity and Public Health (ICPAPH). 1-4 October, Sydney, Australia. 4- Barwais, F.A., Cuddihy T.F. Using a Technology-based Physical Activity Monitor to Encourage Adults to Reduce Sedentary Behaviour: A 4-week Randomized Controlled Trial (2013). 38th Annual National Wellness Conference (NWC). 15-18 July, Wisconsin, USA.
vi
Table of Contents Keywords..............................................................................................................................i Abstract ...............................................................................................................................ii List of Publications Related to this Thesis ........................................................................... iv Other Publication ................................................................................................................. v List of Presentations Related to this Thesis .......................................................................... vi Table of Contents ............................................................................................................... vii List of Figures ...................................................................................................................... x List of Tables ...................................................................................................................... xi List of Abbreviations.......................................................................................................... xii Statement of Original Authorship ......................................................................................xiii Acknowledgements ........................................................................................................... xiv
Chapter 1: General Introduction ......................................................................... 17 Chapter 2: Literature Review .............................................................................. 25 2.1 Sedentary Behaviour and Physical Activity Levels ....................................................... 25 2.1.1 Defining Sedentary Behaviour and Physical Activity.................................................... 25 2.1.2 Sedentary Behaviour Time as Distinct from Physical Activity Levels ........................... 26 2.1.3 Associations amongst Sedentary Behaviour, Physical Activity and Health .................... 28 2.1.4 Assessment of Sedentary Behaviour and Physical Activity Levels ................................ 32 2.1.4.1 Subjective Measurement ........................................................................................... 33 2.1.4.2 Objective Measurement ............................................................................................ 36
2.2 Technologies to Reduce Sedentary Time and Increase the Level of Physical Activity ... 40 2.3 Wellness ...................................................................................................................... 46 2.3.1 Historical Perspective on Wellness .............................................................................. 46 2.3.2 Defining Wellness ....................................................................................................... 46 2.3.3 Wellness Theories and Models..................................................................................... 49 2.3.4 Wellness Evaluation of Lifestyle (WEL) inventory....................................................... 53 2.3.5 The Role of Physical Activity in Wellness ................................................................... 56
Chapter 3: Adult Total Wellness: Group Differences Based on Sitting Time and Physical Activity Level .......................................................................................... 59 3.1 Notes............................................................................................................................ 59 3.2 Abstract........................................................................................................................ 60 3.3 Introduction.................................................................................................................. 62 3.4 Methods ....................................................................................................................... 64 3.4.1 Participants and Procedures ......................................................................................... 64 3.4.2 Measurement ............................................................................................................... 64
3.5 Statistical Analyses ...................................................................................................... 67 3.6 Results ......................................................................................................................... 68 3.7 Discussion .................................................................................................................... 72 3.8 Conclusion ................................................................................................................... 76
vii
Chapter 4: Development and Validation of a New Self-Report Instrument for Measuring Sedentary Behaviours and Light-Intensity Physical Activity in Adults..........................................................................................................................77 4.1 Notes............................................................................................................................ 77 4.2 Abstract........................................................................................................................ 78 4.3 Introduction.................................................................................................................. 79 4.4 Methods ....................................................................................................................... 82 4.4.1 7-day SLIPA Log Development ................................................................................... 82 4.5 Methods for the concurrent validation study. ................................................................... 83 4.5.2 Procedures................................................................................................................... 84 4.5.3 Instruments.................................................................................................................. 85
4.6 Statistical Analyses ...................................................................................................... 87 4.7 Results ......................................................................................................................... 88 4.8 Discussion .................................................................................................................... 95 4.8.1 Strengths and Limitations ............................................................................................ 98
4.9 Conclusion ................................................................................................................... 99
Chapter 5: Reliability of the 7-day Sedentary and Light Intensity Physical Activity Log (7-day SLIPA Log)....... .................................................................. 101 5.1 Notes.......................................................................................................................... 101 5.2 Abstract...................................................................................................................... 102 5.3 Introduction................................................................................................................ 103 5.4 Methods ..................................................................................................................... 106 5.4.1 Participants.................................................................................................................106 5.4.2 Study Design ..............................................................................................................106
5.5 Statistical Analysis ..................................................................................................... 109 5.6 Results ....................................................................................................................... 109 5.7 Discussion .................................................................................................................. 111 5.8 Conclusions................................................................................................................ 113
Chapter 6: Empowering Sedentary Adults to Reduce Sedentary Behaviour and Increase Physical Activity Levels and Energy Expenditure: Success with a Technology-Based Physical Activity Monitor .................................................... 114 6.1 Notes.......................................................................................................................... 114 6.1 Abstract...................................................................................................................... 115 6.2 Introduction................................................................................................................ 117 6.3 Methods ..................................................................................................................... 119 6.3.1 Participants.................................................................................................................119 6.3.2 Study Design ..............................................................................................................120 6.3.3 Description of an Online Personal Activity Monitor ....................................................120 6.3.4 Intervention Structure .................................................................................................122 6.3.5 Study Measures ..........................................................................................................123
6.4 Statistical Analysis ..................................................................................................... 125 6.5 Results ....................................................................................................................... 126 6.5.1 Efficacy of the Intervention ........................................................................................127 6.5.2 Self-report Outcome ...................................................................................................129
viii
6.5.3 Technology Acceptance Model (Intervention participants) ..........................................131 6.5.4 Predicted future use (Intervention participants)............................................................131
6.6 Discussion .................................................................................................................. 132 6.6.1 Limitations and Strengths ...........................................................................................136
6.7 Conclusion ................................................................................................................. 137
Chapter 7: Physical Activity, Sedentary Behaviour and Total Wellness changes among Sedentary Adults: A 4-week Randomized Controlled Trial ................. 138 7.1 Notes.......................................................................................................................... 138 7.1 Abstract...................................................................................................................... 139 7.2 Introduction................................................................................................................ 141 7.3 Methods ..................................................................................................................... 143 7.3.1 Design Overview ........................................................................................................143 7.3.2 Participants.................................................................................................................143 7.3.3 Intervention (online personal activity monitor) Group .................................................143 7.3.4 Outcome Measures .....................................................................................................145
7.4 Statistical analyses...................................................................................................... 148 7.5 Results ....................................................................................................................... 148 7.6 Discussion .................................................................................................................. 155 7.7 Conclusion ................................................................................................................. 158
Chapter 8: General Discussion ........................................................................... 159 8.1 Introduction................................................................................................................ 159 8.2 Consolidated Papers-Discussion ................................................................................. 159 8.3 Future Research.......................................................................................................... 165 8.4 Contribution to the Literature ..................................................................................... 166
References ........................................................................................................ 169 Appendices............................................................................................................... 184 Appendix 1: Wellness Evaluation of Lifestyle (WEL) Inventory definitions scales, and number of items .......................................................................................................184 Appendix 2: 7-day Sedentary and Light Intensity Physical Activity Log (7-day SLIPA Log) 187 Appendix 3: International Physical Activity Questionnaire (IPAQ) ......................................189 Appendix 4: Recruitment flyer (QUT HREC: 1100000358) .................................................194 Appendix 5: Information Sheet and Consent Form (QUT HREC: 1100000358)....................195 Appendix 6: Email Invitation to Recruit Participants (QUT HREC: 1100000358) ................197 Appendix 7: Recruitment flyer (QUT HREC: 1100000359) .................................................198 Appendix 8: Information Sheet and Consent Form (QUT HREC: 1100000359)....................200 Appendix 9: Recruitment flyer (QUT HREC: 1200000226) .................................................203 Appendix 10: Information Sheet and Consent Form (QUT HREC: 1200000226) ..................205 Appendix 11: Email Invitation to Recruit Participants (QUT HREC: 1200000226) ..............209 Appendix 12: The ActiGraph GT3X determined variations in “free-living” standing, lying and sitting duration among sedentary adults in different BMI categories (Paper) .....................................................................................................................210
ix
List of Figures
Figure 1.1 A summary of the general aims of the thesis and its papers. ................ 24 Figure 2.1: Illness-Wellness Continuum. .............................................................. 49 Figure 2.2: Hettler’s six dimensions of wellness. .................................................. 52 Figure 3.1-A IPAQ constructed sitting time/physical activity categories (N = 226). B Wellness Evaluation of Lifestyle (WEL) categories (based on Total Wellness). (N = 226). .............................................. 69 Figure 4.1: GT3X accelerometer inclinometer functions in each posture of sedentary behaviour (i.e. standing, sitting, lying, and off) during 1 hour of free-living activities. .............................................. 87 Figure 4.2: Bland–Altman plots assessing agreement between the 7-day SLIPA Log and ActiGraph GT3X (A) sedentary behaviour (hours/day) (B) light intensity physical activity (hours/day). Solid line shows the mean difference in hours, and the dashed lines show 95% CI of agreement. ..................................................... 93 Figure 4.3: Bland–Altman plots assessing agreement between the 7-day SLIPA Log and ActiGraph GT3X (A) time in standing (hours) (B) time in lying (hours) (C) time in sitting (hours). The Solid line shows the mean difference in hours, and the dashed lines show 95% CI of agreement. ............................................................. 94 Figure 6.1: Decrease in time spent in sedentary and increase in time in light intensity physical activity from baseline to week 4.*(p < 0.001). ............................................................................................128 Figure 6.2: Increased time in moderate and vigorous intensity physical activity from baseline to week 4.**(p < 0.001),*( p < 0.05). ............129 Figure 6.3: Time differences (Hours/day) spent in sedentary and lightintensity physical activity across four daily life domains: work, transportation, household activities, and leisure time (based on the 7-day SLIPA Log).* (p 7 hours per day, were invited to participate in the study (Rosenberg, et al., 2008; Tremblay, et al., 2010). The sample size for this study was set at a minimum of 32 by using G*Power V.1.1.3 software set for F-test analysis of variance (ANOVA). Power was calculated at 0.8, Alpha level was set at p 0.8) were interpreted as small, moderate, and large, respectively (Cohen, 1988).
217
STANDING
LYING 2:00 PM 3:00 PM 4:00 PM 5:00 PM
6:00 PM 7:00 PM 8:00 PM
9:00 PM 10:00 PM 11:00 PM
3:00 PM
4:00 PM
5:00 PM
6:00 PM
7:00 PM
8:00 PM
9:00 PM
10:00 PM
11:00 PM
12:00 PM
11:00 AM
10:00 AM
9:00 AM
8:00 AM
7:00 AM
6:00 AM
5:00 AM
4:00 AM
3:00 AM
2:00 AM
1:00 AM
12:00 AM
2:00 PM
60 50 40 30 20 10 0 1:00 PM
Obese
1:00 PM
12:00 PM
11:00 AM
10:00 AM
9:00 AM
8:00 AM
7:00 AM
6:00 AM
5:00 AM
4:00 AM
3:00 AM
2:00 AM
1:00 AM
12:00 AM
SITTING
11:00 PM
10:00 PM
9:00 PM
8:00 PM
7:00 PM
6:00 PM
5:00 PM
4:00 PM
3:00 PM
2:00 PM
1:00 PM
12:00 PM
11:00 AM
10:00 AM
9:00 AM
8:00 AM
7:00 AM
6:00 AM
5:00 AM
4:00 AM
3:00 AM
2:00 AM
1:00 AM
12:00 AM
Normal Weight
60
50
40
30
20
10
0
Normal Weight
60
50
40
30
20
10
0
Non-wear
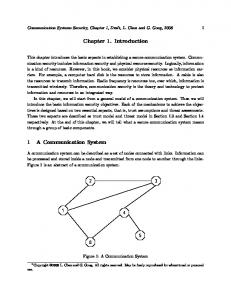
Figure 1 Free-living time allocated across consecutive 24 hours spent in each of the postural positions of standing, lying, sitting, and non-wear.
218
Results A total of 22 (88%) participants (14 males, 8 females) aged 18 to 45 years (mean age ± SD, 26.5 ± 4.1 years) met the inclusion criteria for wear-time of more than 16 hours per day over a 7 day period, and were included in the analysis. The majority of the participants were either fulltime students (54%) or worked full time (46%). Characteristics of the study participants are presented in Table 1. Participants wore the accelerometer for 7 days with an average of 22.23 hours of wear-time per day. The average durations of wear time (hr/day) for all participants were similar for both weekdays and weekend days (22.3 and 22.0 hours respectively). The mean BMI’s ± (SD) for each category are displayed in Table 1. Table 1: Demographic data for normal-weight, overweight and obese participants (mean ± SD).
Normal weight Number of subjects Male Female Overall Age (years) Male Female Overall Height (cm) Male Female Overall Weight (kg) Male Female Overall BMI (kg/m2 ) Male Female Overall
Overweight
Obese
5 5 10
3 3 6
6 -6
27.2 ± 1.3 26.8 ± 3.4 27.0 ± 2.4
24.3 ± 4.7 24.0 ± 4.5 24.1 ± 4.1
28.0 ± 5.6 -28.0 ± 5.6
172.2 ± 5.9 165.4 ± 5.1 168.8 ± 6.3
177.3 ± 9.0 166.3 ± 7.3 171.8± 9.5
174.8± 6.4 -174.8± 6.4
61.4 ± 9.4 63.8 ± 5.2 62.2 ± 7.3
84.3 ± 11.5 73.0± 1.0 78.6± 9.6
108.8 ± 19.6 -108.8 ± 19.6
21.9 ± 1.6 23.3 ± 1.5 22.6± 1.6
26.7 ± 1.3 26.4 ± 2.1 26.6 ± 1.5
35.5 ± 5.8 -35.5 ± 5.8
219
Daily posture frequencies are illustrated in Figure 2. Participants within the normal weight and overweight groups spent more time standing (6.7 and 7.3 hours, respectively) than those in the obese group (5.5 hours) after adjustment for MVPA and wear-time. The ANCOVA revealed that after accounting for the effects of MVPA and wear time there was a statistically significant effect of BMI status on standing time F (2,149) = 13.02 (p < .001).
Figure 2 Average hours per day spent in posture allocations standing, lying and sitting (Error bars represent SE). After adjustment for wear-time ** (p < .001), * (p < .05).
Post-hoc tests showed significant differences in standing time for normal weight and overweight groups with obese groups (p < .001) while no significant difference was found between normal weight and overweight groups (p = .051) (see Figure 3). The ANCOVA revealed that after accounting for the effects of “wear time” there was a
220
statistically significant effect of BMI status on sitting time F (2,150) = 6.39 (p < .05). Post Hoc tests reveal a significant difference existed between the normal weight (7.1 hours) and obese groups (8.0 hours) (p < .05), and between overweight (6.9 hours) and obese groups (p < .001) for sitting time. There was no significant difference in sitting time between normal weight and overweight groups (p = .67) after adjustment for weartime. No significant difference was found in the total time spent lying among all groups F (2,150) = .58 (p = .55).
Figure 3 Average hours per day spent in the postural position of standing during days of week (Error bars represent SE).
Large effect sizes were observed between the normal weight and obese groups (d = 0.9) and between the overweight and obese groups (d = 1.5) in time standing (Table 2). A moderate effect size was observed (d = .5) between the normal weight and the overweight group for standing duration. A moderate effect size was observed for time spent sitting
221
between the normal weight and obese groups and between overweight and obese groups (d = 0.6 and d = 0.7 respectively). The obese group spent significantly (p < .001) less time standing for weekdays compared with weekend days (5.8 and 5.4 hours) and less time than those in the normal weight (6.5 and 6.6 hours) and overweight (7.2 and 7.6 hours) groups. No significant differences were observed for weekdays compared with weekend days between normal weight (6.5 and 6.6 hours) and overweight (7.2 and 7.6 hours) groups (p = .33 and p = .35 respectively) in standing time. Additionally, no significant differences were found for weekdays compared with weekend days in the total time spent sitting between normal weight (7.1 and 7.0 hours) and overweight (7.0 and 6.6 hours) (p = .87 and p = .84 respectively), and between normal weight (7.1 and 7.0 hours) and obese (7.3 and 8.1 hours) (p = .31 and p = .31 respectively), as well as between overweight (7.0 and 6.6 hours) and obese (7.3 and 8.1 hours) (p = .25 and p = .13 respectively). For total time spent in lying, there were no significant differences for weekdays compared with weekend days between normal weight (9.4 and 9.3 hours) and overweight (9.3 and 9.2 hours) (p = .88 and p = .99 respectively), and between normal weight (9.4 and 9.3 hours) and obese (9.8 and 9.3 hours) (p = .87 and p = .95 respectively), as well as between overweight (9.3 and 9.2 hours) and obese (9.8 and 9.3 hours) (p = .54 and p = .99 respectively).
222
Table 2: Duration and estimated effect sizes, comparing BMI categories in time spent in different postures (standing and sitting).
Time (hours) in Standing
Time (hours)in Sitting
BMI classification
N’s
Mean (hours)
SD (hours)
Cohen' s d†
Cohen's classifications
Normal weight Overweight Normal weight Obese Overweight Obese
10 6 10 6 6 6
6.7 7.3 6.7 5.5 7.3 5.5
1.4 1.2 1.4 1.4 1.2 1.4
0.5
moderate*
0.9
large**
1.5
large**
Normal weight Overweight Normal weight Obese Overweight Obese
10 6 10 6 6 6
7.1 6.9 7.1 8.0 6.9 8.0
1.3 1.6 1.3 1.9 1.6 1.9
0.2
small
0.6
moderate*
0.7
moderate*
**Large effect size p