Chapter 11 Evaluation of Best Nitrogen Management Practices Across Regions of Argentina and Spain Raúl S. Lavado Facultad de Agronomía Universidad de Buenos Aires Av. San Martín 4453 C1414 DSE Buenos Aires, Argentina
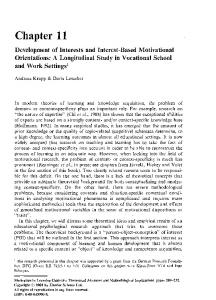
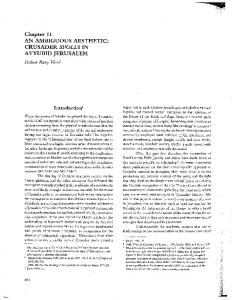
[email protected] José M. de Paz Departamento de Recursos Naturales Instituto Valenciano de Investigaciones Agrarias Carretera Moncada-Naquera, km 4,5. Apdo. Oficial. 46113 Moncada-Valencia, Spain Jorge A. Delgado Soil Plant Nutrient Research Unit USDA Agricultural Research Service 2150 Centre Avenue, Building D, Suite 100 Ft. Collins, CO 80526 USA Helena Rimski-Korsakov Facultad de Agronomía Universidad de Buenos Aires Av. San Martín 4453 C1414 DSE Buenos Aires, Argentina INTRODUCTION The agricultural best nitrogen (N) management practices for Argentina and Spain (Figure 1) are different; however, for both countries the N fertilizer application rates have been increasing (Figure 2). The average N rate in Spain doubled during the last 40 years (from about 60 to 145 kg N ha-1), and in Argentina the N rate increased from near 0 to 26 kg N ha-1 during the same period. The reasons for a lower rate of fertilization in Argentina was summarized by Lavado and Taboada (2009). Since N use is increasing in these countries, there is the need to evaluate the potential use of new tools, such as NLEAP GIS 4.2 and or 314
Advances in Nitrogen Management
new Nitrogen Index, to test how they could contribute to improve our understanding of best management practices across regions in these countries. Initials studies show that there is the potential to use these new tools to evaluate best management practices (BMPs) for different agroecosystems in order to increase N use efficiencies (NUEs) and to reduce nitrogen losses to the environment.
Figure 1. Location of Spain (Valencia study sites) and Argentina (study sites).
Figure 2. Evolution of the annual nitrogen doses in Spanish and Argentinean agriculture. Values were calculated using data obtained from FAOSTAT (2006).
Chapter 11
315
Since nitrate leaching management practices that affect NO3-N leaching are site-specific (Meisinger and Delgado, 2002; Shaffer and Delgado, 2002; Delgado, 1998, 2001), it is possible to have differences in average N inputs between both sites and still report NO3-N leaching problems for both countries. Argentina is a large country that covers an extensive area from middle South America to near the South Pole (Figure 1). Argentina’s agroecosystems ranges from tropical forests (located in the northeast) to colder forests (located in the southwest). The grassland zones for Argentina range from arid zones in the northwest (with low potential for NO3-N leaching) to temperate grasslands in the middle of the country (with a high potential for NO3-N leaching). Argentina’s cropland area is shown in Table 1. Table 1. Field crops cultivated area in Argentina (in thousand hectares) and yields (kg ha-1)
Crop Cereals: Wheat Maize Oat Sorghum Malting barley Rice1 Other cereals2 Oil crops: Soybean Sunflower Cotton1 Peanut Other oil crops3
Seeded area
Yield
5,676 3,578 1,067 700 339 168 268
2,625 7,665 1,760 4,702 3,768 6,560 1,214
16,141 2,381 403 216 115
2,971 1,487 1,387 2,790 1,076
Note: Data from 2006/2007 (SAGPYA, 2008). 1 Rye, canary grass, millet, and others. 2 Cropped entirely out of the Pampas. 3 Safflower, canola, flax, and others.
The grassland areas are called the Pampas, which are humid in the east and semi-arid in the west. Grain cereals, oil crops, fruit crops, vegetable crops, industrial crops, and other crops are grown in the Pampas region. The Pampas region, extending across 55 Mha, is one of the largest temperate areas dedicated to cereal crops in the southern hemisphere. Sustainability and soil and water conservation across this region is necessary in order to reduce N losses that can impact soil, water, and air at local and regional levels. Spaniards introduced cattle to this region in 1573. The area was scarcely grazed, natural grassland until mid-nineteenth century, when European immigrants introduced the agriculture and tillage activity across the region. This region showed initially an agricultural evolution 316
Advances in Nitrogen Management
relatively similar to the North American grasslands. Cereals such as wheat, maize, and barley were initially grown based on the high natural fertility of the soils and by using crop rotations with green manures. From the mid-twentieth century, these similarities ended when North American cropland prairies started to receive higher N fertilizers inputs; a practice that was not used in the Pampas region. By the early nineteennineties, the original high fertility of the Pampas soils was lost, and an acute depletion of soil nutrients was generalized (Lavado and Taboada, 2009). Fertilizer consumption across the Pampas increased exponentially in the last 15 years, from nearly no fertilizer used to about 100% and 83% of the cropland area being fertilized for wheat and corn, respectively. Urea N fertilizer was used for wheat and corn, with average N rates ranging from 20 to 80 kg N ha-1 (MECON, 2006). Berardo (2004) reported that for the Pampas region, although the cropped land increased by 30% during the last 50 years, the production increase was much higher (150%), which was driven by higher, new crop yielding varieties that were N fertilized. Although N inputs increased in this region, Garcia and Salvagiotti (2009) reported that for the main crops such as soybean, wheat, maize, and sunflower, N fertilizer inputs only restored 50%, 56%, 3%, and 43% of the nitrogen, phosphorus, potassium, and sulphur removed from the soils, respectively. Although the nutrient balance for this region is still negative, fertilizer use in this region is projected to increase in the near future. There is the need to calibrate and validate new tools such as the NLEAP GIS 4.2 and or a new Nitrogen Index that can contribute to identify management practices that can yield higher N fertilizer use efficiencies to reduce potential N losses to the environment. The Pampas dry season, although random, occurs mainly during the summers. If needed during these drought periods, the crops are irrigated to maintain high yield productivity. It was initially believed that due to the low N inputs and water deficits, the leaching losses of NO3-N were insignificant (Giambiagi et al., 1976; Conti et al., 1985). However, field studies in the late 1990s found that NO3-N leaching is a problem during the growing season of corn and other crops (Rimski-Korsakov et al., 2001; Costa et al., 2002; Rimski-Korsakov et al., 2004; Aparicio et al., 2008; Portela et al., 2009; Rimski-Korsakov et al., 2008). Rimski-Korsakov et al. (2004) and Rimski-Korsakov et al. (2009a) found that nitrates leach mainly during fallow periods. Although there is no report on the geographical distribution of groundwater NO3-N concentrations in the Pampas region, González at al. (1999) reported that NO3-N concentrations in aquifers is highly variable in space and time and highly related to rainfall intensity. Several surveys of groundwater NO3-N concentrations have been conducted. In a recent survey of groundwater within the rolling Pampas, Herrero et al. (2005) found that 20% of the groundwater samples showed nitrate concentrations exceeding 10 mg l-1 NO3-N. In that survey the higher measurement value for the rolling Pampas was 26 mg l-1 NO3-N. Auge Chapter 11
317
(1998) found that crop areas that were dominated with intensive production of vegetables, fruit, and ornamentals, the groundwater NO3N concentrations averaged around 20 mg l-1 NO3-N and were often found to contain a maximum of 44 mg l-1. In the same study it was found that groundwater NO3-N concentrations located near cities were high and were correlated with leaks in sewage systems. The study also found high groundwater NO3-N concentrations in areas located under vegetable production areas that received high doses of manure. There is spatial variability of soils and climate across the Pampas. The rolling Pampas is dominated by Typic Argiudolls and Typic Hapludolls (Soriano et al., 1991). The rolling Pampas area has humid weather and a longer rainy season from December to March (Hall et al., 1992). The rolling Pampas area covers 5 Mha and is planted mainly by soybean and corn. Corn yields are correlated with rainfall and N availability (Otegui et al., 1995; Alvarez, 2005). Alvarez correlated corn yields with the rainfall period of October thru February, residual soil NO3-N, and N fertilizer (p < 0.01; Equation 1) in the following equation: yield = (–15500 + 63 ppt – 0.040 ppt2 + 0.021 ppt) * nsf ,
(1)
where yield = Corn yields in kg ha-1; ppt = rainfall from October to February (mm); * nsf = kg NO3-N ha-1 (soil 0 - 0.3 m depth) + nitrogen fertilizers g N ha-1. Traditionally, the soybean grown in this region has not been fertilized, but farmers have started to add phosphorus and sulphur. Rimski-Korsakov et al. (2001) assess the effect of fertigation to tomatoes that were grown on greenhouse in the rolling pampas. They found that NO3-N leaching in these systems was 10 times higher than nitrate leaching for field corn. Costa and Vidal (1998) reported that NO3-N leaching losses from potato fields were higher than those observed for deep-rooted crops, such as grain. These results from Costa and Vidal (1998) are similar to those from Delgado (1998, 2001). Delgado (1998, 2001) reported that the correlations of deeper rooted crops with shallow rooted crops not only reduces the NO3-N leaching for the deeper rooted crop, but it reduces the NO3-N leaching for the shallower rooted crop and even mines NO3-N from underground water. Irrigated vineyards with increased N fertilizer use, located in the arid west near the Andes range, have been reported to contribute to NO3-N leaching (S. Malone, personal communication). Septic systems leaking around cities and towns are another significant source of NO3-N leaching in Argentina (Lavado, personal communication). There is a growing concern in Argentina about the increasing underground water NO3-N concentration exceeding 10 mg l-1 NO3-N (Lavado, personal communication). Although higher N fertilizer inputs have been correlated with increasing underground water NO3-N concentrations, there are areas with high NO3-N values that have not been extensively fertilized with N. Andriulo et al. (2000) reported that 318
Advances in Nitrogen Management
the higher NO3-N underground water concentrations probably came from 100 years of plowing and increasing the mineralization of soil organic matter. At these sites, the soils have lost 50% of their original soil organic matter content, releasing the N that was tied to these large quantities of organic matter (Alvarez, 2001; Steinbach et al., 2004). Aparicio et al. (2008) found that organic matter mineralization for these soils with high organic content contributes to a high release of nitrogen increasing nitrate leaching potential and source of nitrates to groundwater. The other natural source was the NO3-N leaching from grazed alfalfa (Scheiner et al., 2000). Aparicio et al. (2008), Costa et al. (2002), Rimski-Korsakov et al. (2004) and Rimski-Korsakov et al. (2008) found a high correlation between nitrogen fertilization doses and ground and surface water enrichment with NO3-N. Feijoo et al. (2005) reported surface water NO3-N concentrations of 0.03 and 6.5 mg l-1 for grazed and cropped areas, respectively. The data suggests that surface runoff from N fertilized cropland areas contributed to increase the NO3-N concentrations of surface waters. The installation of buffer areas and BMPs that reduce offsite transport are recommended. Mugni et al. (2005) monitored the inorganic N concentrations of surface runoff and several streams of the rolling Pampas. Although surface runoff of NO3-N averaged 0.46 mg l-1 and NH4-N averaged 0.48 mg l-1, they reported that for the streams that were monitored, the NO3-N averaged 2.39 mg l-1, which is much higher than the average ammonia NH4-N of 0.03 mg l-1. NITROGEN MANAGEMENT PRACTICES AND INPUTS IN ARGENTINA Farmers usually tend to use low N fertilization rates, mainly due to the low fertilizer cost/crop production income ratios. Extensionists recommend measuring NO3- N content in the surface at 0 to 60 cm depth during wheat, sunflower, and barley planting (Alvarez, 2005). The credit of the initial soil NO3-N content is also used for corn, but the N fertilizer is not applied at planting, due to the overlap of corn planting time with the rainy season. To minimize the potential losses of N to the environment, it is recommended the application of N fertilizer to corn at the V6 stage of growth (Alvarez, 2005). By crediting the N content at planting, NUE is being increased. Although corn usually leaves low residual soil NO3-N content in the soil profile, during some years, the residual soil NO3-N content could be high, increasing the potential for NO3-N leaching during the winter when the evapotranspiration is lower and the rainy season occurs. We still need additional studies and new, advanced quick tools to evaluate the effects of soils, crop systems, and N inputs on potential NO3-N leaching.
Chapter 11
319
GENERAL PROBLEMS OF NITROGEN MANAGEMENT IN SPAIN About 50% of Spain’s land area is cultivated (MARM, 2009a) with two main agroecosystems: the humid Atlantic climate of Northern Spain and the remainder of the area with a dry Mediterranean climate. The humid Atlantic climate region, with average annual rainfall greater than 800 mm, has a large surplus of water. This region is dominated with forests and pastures. The dry Mediterranean climate southeast region is characterized as a more arid climate with average annual rain lower than 300 mm. The rest of the dry Mediterranean region has a more continental climate with a colder winter and a rainier autumn (inland). The annual average rainfall is lower than 600 mm. The predominant land use across the dry Mediterranean climate region is dryland and irrigated agriculture. Barley and wheat are the main crops planted across 6.2 Mha, about half of the total arable area for the dry Mediterranean climate region (Table 2). With deficit water budgets and low N fertilizer inputs, the average barley and wheat small grain yields of 2500 kg ha-1 are low. Olive trees are the third main crop grown in the southern dryland region across Andalusia, where the summers are hot and dry. Since the average N fertilizer rates for these olive and small grains crops are 45 to 90 kg N ha-1, combined with a low, dry climate, the potential for NO3-N leaching across the area, planted in small grains and olives, is low. However in this Mediterranean dry climate region there are irrigated areas in which vegetables (e.g., tomato, cauliflower, cabbage, artichoke, onion, lettuce), fruits (e.g., melon, watermelon), citrus (e.g., orange, mandarine), or tuber crops (e.g., potato, sugar beet) are heavily N fertilized with rates from 200 to 300 kg N ha-1, where the NO3-N leaching potential is higher. Table 2. Distribution of agricultural land use in Spain (in thousand hectares) (MARM, 2009). Land use Dryland Irrigated Greenhouse Total Meadow, pasture Cereal grain Fallows Olive tree Vineyard Industrial crops Fruit trees (non-citrus) Forage crops Citrus Vegetables Legume grains Tuber crops Other agriculture uses 320
7,956 5,317 3,294 1,879 748 863 761 631 17 95 259 15 10
35 892 108 689 347 202 241 262 304 299 16 52 12
0 0 0 0 0 0 4 0 0 25 0 0 33
7,991 6,209 3,402 2,568 1,095 1,065 1,006 893 321 317 275 67 55
Advances in Nitrogen Management
In general, the agricultural fields of Spain tend to be small, and in 52% of the farms the cultivate fields are smaller than 5 ha (INE, 2004). The N rate in Spain was doubled during the last forty years (MAPA, 2004). The agricultural crop production, extension, and management in Spain are generally regulated by European directives and legislation, and in some cases, are supported by subsidies. Due to the new regulations in the European Union, these subsidies have been reduced. This fact, in addition to recent increases in N fertilizer prices contributed to changes in N management in which the rates tend to be reduced. From 2004 to 2008 the mineral nitrogen fertilizer consumption in Spain was reduced in a 15%, from 1.15 million to 0.96 million N tones (ANFFE, 2008), and the average rates were also reduced from 67 to 51.2 kg Nha-1 (MARM 2009a). Fertigation is increasing and about one million hectares uses this system, where 80% of the fruit trees are fertigated (Cadahia, 2005). Intensive irrigated agriculture with high N rates of fertilizer are increasing in area and N fertilizer use. There is the need to continue looking for new, quick assessment tools that can be used to evaluate the effects of BMPs on N losses and NUE. To reduce the NO3-N leaching to underground waters, the European Union and Spanish institutions have enacted directives and legislation (CEC, 1991; BOE, 1996). The first step was the need to identify groundwater bodies with high vulnerability to nitrate pollution (Figure 3). The main criteria used to identify groundwater bodies with high vulnerability to nitrate pollution, is to identify their current NO3-N concentrations. Varela (1991) correlated the main areas of high NO3-N concentrations with intensive agriculture (Figure 4). In Spain, 30% of the population, about 12 million people, use groundwater at a water demand between 1100 to 1600 hm3 year-1 (LopezGeta, 1999; ITGME, 1998). In some regions of intensive agriculture and heavy N fertilizer applications, this water supply is threatened by NO3-N leaching. The Ministry of the Environment and Rural and Marine Environs (MARM, 2009b) conducts a study of the N balance in the Spanish agriculture yearly. This study is done using agricultural statistics of planted areas, N fertilizer used by crop area, atmospheric N deposition of N, and biological N fixation. Crop productivity and potential N uptake was also used for the N balance. Potential N losses via denitrification, NH3 volatilization, NO3-N leaching, and crop N uptake were estimated.
Chapter 11
321
Figure 3. Vulnerable areas to nitrate pollution from agricultural sources in Spain (MARM, 2008).
Figure 4. Spatial distribution of the nitrate content in the groundwater of Spain (MARM, 2008).
322
Advances in Nitrogen Management
The last national nitrogen balance updated by the MARM (2009a, 2009b) found that 9 and 4.6 million hectares for herbaceous plants and trees, respectively, received almost 900,000 million tons of inorganic N fertilizer per year and 310,000 tons of a combination of organic and inorganic N fertilizer per year. Nitrogen (organic and/or inorganic) was been over-applied to vegetables, citrus, and tuber crops at a rate of 272, 350, and 261 kg N ha-1, respectively (MARM, 2009b). Assuming minimal atmospheric N losses potential, then the difference between N input and N output harvested by the crops can be estimated to represent the risk of nitrogen losses by leaching and runoff. The total leaching and runoff N losses potential risk for vegetables, citrus, and tuber cropping systems were estimated at 129, 142, and 164 kg N ha-1 respectively. These N losses represented 47%, 40%, and 63% of the N input for vegetables, citrus, and tuber crops, respectively. The risk for other crops with better nitrogen management practices, such as cereals and olive trees was much lower, and the over application of nitrogen was 14 and 4 kg N ha-1, respectively. These balances are in agreement with De Paz et al. (2009) that conducted an in depth nitrogen management study across a Mediterranean region of Spain. They found that higher than needed nitrogen application increased nitrate leaching losses risk. Additionally, De Paz et al. (2009) found that when best management practices that match the nitrogen inputs with nitrogen outputs are applied, the nitrogen use efficiencies are significantly increased and the risk for nitrogen leaching is minimized. A network for nitrate control of groundwater (MARM, 2008), in which more than 1,500 wells are monitored yearly, indicate that more than 20% of the wells from 2003 to 2007 had NO3-N concentrations greater than 11 mg l-1, which is the maximum allowed for water supply in Europe (Meinardi et al., 1995; ITGME, 1998; CEE, 1998) (Figure 5). The NO3-N content in groundwater has been correlated to land use with high N fertilizer rates (Varela, 1991; MMA, 2001). In some of the irrigated areas with well water, NO3-N concentrations higher than 50 mg l-1 may be contributing to increase the N losses when the underground water is also used for irrigation if the background N in the irrigated water is not credited as a potential source of N. There is the need to credit some of the N applied with well water NO3-N concentrations. At least 50% of the N content in the water should be credited, or the N should be applied with water when the crop is actively growing and taking N from the system. The underground water areas with high NO3-N concentrations are located in the alluvial plain of the Guadalquivir river of Andalusia; in the Maresme–Llobregat river of Catalonia; in the Mediterranean coastal plain of the Valencia Community; in the greenhouse areas of Almeria, in southeaster Andalusia; in the plain of Castilla la Mancha, associated as the biggest aquifer of Spain; in some areas of the Canary Islands and the Balear islands; and in other small regions associated with intensive agriculture (Figures 3 and 4).
Chapter 11
323
Figure 5. Nitrate concentration in wells in Spain from 2003 to 2007 (MARM, 2008).
NITROGEN MANAGEMENT PRACTICES AND INPUTS IN SPAIN Generally, the Spanish farmers do not follow any detailed nutrient management plans. Farmers use traditional N rates following recommendations from extension advisors. The N fertilizer rates are usually higher than the N uptake and transport out of the field (MMA, 2001). The current trends are to apply the N management codes and recommendations that are site-specific for the region (e.g., Valencia region established a code in 2000 Generalitat Valenciana 2000b, Gobierno Navarra 1997; Xunta de Galicia 1999). These codes are recommending the synchronization of N inputs from fertilizers with the N sink uptake by crops by using split N applications between planting and side dressing. Using organic forms of N and improving irrigation management is also recommended in these nutrient management codes. Use of crop rotations of shallower and deeper rooted crops to increase NUE, reduce NO3-N leaching of the following crop, and potential for NO3-N mining from underground waters is described by Delgado (1998, 2001) and Delgado et al. (2001a, 2001b). The practice of using shallower and deeper rooted crops is also recommended in the nutrient management codes across Spain to protect and conserve groundwaters. The Spanish agriculture is considering the recommendation of viable practices that maximize productivity, while reducing environmental N losses. Delgado (1998, 2001), Delgado and Bausch (2005), and Delgado et al. (2005) showed that we can conduct viable management practices such as remote sensing, precision conservation and site-specific management 324
Advances in Nitrogen Management
zones to reduce NO3-N leaching, while maintaining viable returns to farmers. Ramos et al. (2005) conducted the first congress about N fertilizer recommendation systems and the use of simulation models in fertilizer decisions in Spain. New N fertilizer management systems based on soil and plant analysis and the use of simulation models are being considered. However, very few farmers currently use them. To promote the use of new tools and concepts for the efficient use of the nitrogen in agriculture, several Spanish researcher groups are connected by the network RUENA (Thematic Network for the Efficient use of N in Agriculture; www.ruena.csic.es). The main objective of this network is to exchange practical experiences and disseminate the knowledge about the use of the N fertilizer. EVALUATION OF NITRATE LEACHING IN THE PAMPAS (ARGENTINA) USING NLEAP MODEL To evaluate BMP in the southern part of the rolling Pampas, the original version of the NLEAP model (Shaffer et al., 1991) was used. Rimski-Korsakov et al. (2004) studied NO3-N leaching from two soils near the key south rolling Pampas towns of Alberti, Pergamino, and Salto (Figure 1) and the usefulness of the NLEAP to predict NO3-N leaching. The studies were conducted on a Typic Argiudoll and Typic Hapludoll with different characteristics (i.e., particle size distribution, organic matter content), but they were subjected to similar histories of N fertilization and complementary irrigation. Rimski-Korsakov et al. (2004) correlated simulated NO3-N leaching by the NLEAP with observed NO3N leaching. Rimski-Korsakov et al. (2004) used average climatic weather for the southern part of the rolling Pampas (Table 3). Their results show that during the dry periods in the rolling Pampas, the NO3-N accumulates in the soil profile and remains there after harvest. However, when rainfall is higher than average, the large quantities of accumulated NO3-N are leached. Table 3. NLEAP results: residual soil Nitrates-N, annual leached Nitrates-N, and annual leaching risk potential for three different rainfall situations in the rolling Pampas Region of Argentina. Residual Leached Annual Rainfall Soil NO3-N NO3-N Site and soil leaching risk -1 -1 situation potential (kg ha ) (kg ha ) Alberti (Typic Hapludoll) Pergamino (Typic Argiudoll)
Chapter 11
Average Dry year Wet year Average Dry year Wet year
91 155 55 124 231 57
64 0 79 102 17 167
Low Very low Low Moderate Low Moderate
325
Validation of the NLEAP model for determination of residual nitrates: The NLEAP model was tested in the already mentioned locations (Figure 1). For this purpose, we used observed data from six field experiments carried out throughout 5 cropping seasons (Table 4). These studies used commercial N fertilizer management practices for corn grown in the Pampas region. Corn was grown in Typic Argiudolls and Typic Hapludolls, showing variations in soil texture, organic matter, and nitrate content (Alvarez et al., 2007). These soils are the dominant soils for this region. We used site-specific weather and management practices collected each year (Rimski-Korsakov et al., 2005). The simulated NO3-N values after harvest were correlated to measured residual soil NO3-N (p < 0.001, R2 = 0.79) with an intercept close to 0 and the slope at 1 (Figures 6 and 7). The NLEAP model was an effective tool capable of simulating different soils and climate conditions. Table 4. Ranges of organic matter; nitrate at start and at the end of the simulation (0.00–0.33 and 0.33–1.50 m depth); pH, fertilization doses, maize yield, sowing, and harvest dates used for simulation (Argentina). Required variable Units Range Organic matter N-NO de 0.00–0.33 m 3
N-NO de 0.33–1.50 m 3
% -1
Kg NO -N ha 3
-1
Kg NO -N ha
25.8–50.6
3
pH Fertilization doses
Kg N ha
Maize yield
t ha
Sowing date Harvest date
2.5–2.9 17.5–45.3
-1 -1
5.4–6.8 60–250 7.7–14.6 9/02–10/15 2/15–4/01
The results from the model show that we can increase NUE by monitoring soil residual soil NO3-N to reduce N fertilizer inputs, which is usually recommended for this region (Alvarez, 2005). The risk of NO3N leaching for the winter period and for the following crop can be reduced by growing a cover crop, such as winter rye or winter wheat, as recommended by Delgado (1998). The cover crop can cycle N to the following crop (Delgado, 1998, Delgado, 2001, Collins et al. 2007) and can be used for grazing or providing other income to the farmer. Using ryegrass as a cover crop and labeled fertilizer (15N), Rimski-Korsakov et al. (2009b) found that N derived from fertilizer accumulated significantly in the cover crop, reducing the nitrates leaching risk during fallow.
326
Advances in Nitrogen Management
Figure 6. Simulated versus estimated leached NO3-N (kg ha-1) in Argentina (Pampas region).
Figure 7. Simulated and observed residual nitrates in Argentina (Pampas Region).
The annual leaching risk potential according to the rainfall during the corn season is shown in Table 5. We recommend using the event by event NLEAP simulation model to assess the event losses of N, such as NO3-N leaching events, or the gaseous N losses events that occurs daily. Additionally, Delgado et al. (1998a, 1998b) recommended the calibration of the NLEAP using a regional index that considers the high and low N Chapter 11
327
inputs and even N uptake by different varieties. Delgado et al. (2006, personal communications) conducted several NLEAP runs for the Pampas region under different nitrogen management practices. Delgado et al. (2006, personal communication) recommended that a region index should have a N uptake index should be 1.1 and 0.77 for highly and low fertilized corn, respectively. These N uptake index values reflected the results from high and low nitrogen input management, and improved the calibration of the model across the region. In a set of experiments Rimski-Korsakov et al. (2008) found nitrate losses from soils amounting 39 to 64 kg NO3-N ha-1. They conducted a 15N study that suggested that the NO3-N leaching losses were mainly from residual soil nitrates left by the previous crop and from mineralization of soil organic matter and crop residues. Table 5. Annual Leaching Risk Potential, experimental rainfall during maize cycle, measured residual nitrates, and simulated leached nitrates. Fertilization doses between 60 and 250 kg N ha-1 (Argentina). Residual Leached Rainfall Annual leaching Soil NO3-N NO3-N -1 -1 (mm) risk potential (kg ha ) (kg ha ) 376 616 627 691 887 905
Very low Very low/Low Low/Moderate Very low/Low Low Moderate
57 86 43 29 48 38
0 12 46 32 38 95
REGIONAL APPLICATION OF NLEAP TO ASSESS NO3-N LEACHING IN A MEDITERRANEAN IRRIGATED REGION The NLEAP screening analysis (Annual Nitrogen Index Approach, see De Paz et al. 2009) was used to estimate effects of nitrogen management practices on NO3-N leaching across 230 km2 located near the Valencia Mediterranean coast of Spain (Figure 1). For this purpose, the NLEAP screening analysis algorithms (Annual Nitrogen Index Approach) were programmed in C++ language and linked to a vectorial geographical information system (GIS) and a graphical user interface (GUI). This programming in C++ language was done by De Paz et al. (2009) and is a different NLEAP version than the original code used for the NLEAP DOS version by Shaffer et al. (1991) or the new code used in the new version of NLEAP by Shaffer et al. (2010, Chapter 13) or the NLEAP GIS 4.2 used by Delgado et al. (2010, Chapter 14). De Paz et al. (2009) linkage a GIS with the NLEAP screening analysis (Annual Nitrogen Index Approach) to evaluate the potential NO3-N leaching for two fertilizer alternatives. The GUI was developed within the GIS to facilitate the communication between the Spanish GIS 328
Advances in Nitrogen Management
databases and the NLEAP screening analysis (Annual Nitrogen Index Approach). Several information layers of climate (annual and seasonal rainfall), soil (hydrologic group), NO3-N content in irrigation water, and land use (citrus or vegetable) were combined using the GIS to identify homogeneous units where this Spanish NLEAP screening analysis (Annual Nitrogen Index Approach) was applied (De Paz et al. 2009). Underground NO3-N water concentrations higher than 22 mg l-1 have been measured for this region (ITGME, 1998), which is one of the highrisk regions of Spain susceptible to NO3-N leaching, and declared, by the regional government of Valencian Community, as Vulnerable Zone of nitrogen pollution (Generalitat Valenciana, 2000a). The excessive N fertilizer applications have been correlated with higher NO3-N concentrations of underground water. The region has extensive crop areas dedicated to citrus orchards, and vegetable crops such as potato, onion, cauliflower, lettuce, and artichoke. Soils are usually of alluvial type, with loam texture at the surface changing to clay loam texture at deeper horizons. The climate is semiarid and mesothermic with dry, warm summers that average temperatures of 25ºC. Annual rainfall is about 400 mm with 37% occurring during the rainy autumns with temperatures of 14ºC. Two fertilizer scenarios were simulated using the GIS-NLEAP system to evaluate the potential NO3-N leaching risk. In the first scenario, a conventional N management followed by the farmer’s management was simulated. For the second scenario, a reduced N fertilization following the guidelines of the regional Code of Good Agricultural Practices (GAP) (Generalitat Valenciana 2000b) was simulated. Generalized assumptions were made about the simulation depth (60 cm), the irrigation amount, the initial soil mineral N, NH4-N + NO3-N (70 kg N ha-1), and the crop yield values. The main agricultural management practices and the crops selected for the two scenarios are given in Table 6. A crop rotation of two years with four of the main vegetable crops was built to conduct the simulation in the vegetable area, and the orange crop was simulated for the citrus area. Before applying the NLEAP model (screening analysis) to the study area, a sensitivity analysis for different parameters was carried out (de Paz 1999, de Paz et al. 2009). From this analysis, the most important parameters and processes that affect the percolation and NO3-N leaching were identified. One of these processes is represented by the algorithms to estimate the percolation index (PI). The functions to estimate the PI index were calibrated to properly fit the water percolation observed in several experimental plots (Figure 8) as indicated in de Paz et al. (2009). The N uptake per unit yield parameter was also calibrated for each crop considered in this study. Some experimental studies conducted close to the area with different crops were consulted to assess this N uptake parameter (Gomez and Palmero, 1987; Pomares, 1997; Maroto, 1992).
Chapter 11
329
Table 6. Main management crop data used in the NLEAP simulation for the conventional and reduced fertilization scenarios (Spain). Vegetable rotation 1st year
Citrus 2nd year
Early potato
Lettuce
Onion
Cauliflower
Orange
46
41
96
30
42
330
200
230
260
350
Organic fertilizer (t ha )
24*
—
10*
—
—
Conventional mineral
600
225
350
180
450
300
185
230
120
270
-1
Yield (t ha ) Irrigation (mm) -1
-1
fertilization (kg N ha ) Reduced mineral
-1
fertilization (kg N ha ) *Poultry manure.
Figure 8. PI index calibration. Blue points correspond to observed drainage for soils classified as hydrologic group B and green points for group C.
330
Advances in Nitrogen Management
The resulting maps are shown in Figures 9a and 9b. These maps indicate the spatial distribution of NO3-N leaching for the two scenarios. The NO3-N leaching of 200 kg N ha-1 was lower for 60% of the area covered by citrus but increased significantly for the areas irrigated using groundwater with high background NO3-N contents. Since citrus N fertilizer rates are lower, the NUE was higher; however, intensive rains during autumn, when the crops reduce their activity, caused considerable NO3-N leaching events. This temporal variability shows the sensitivity of higher NO3-N leaching potentials during the rainy autumn periods when temperatures are colder (e.g., lower ET) and the N uptake sink is higher. In order to avoid this, it is recommended to reduce the N fertilization close to autumn and/or use cover crops, such as those reported by Delgado (1998) and Dabney et al. (2001), to uptake the excess of soil mineral nitrogen before the rainy season.
Figure 9. Nitrogen leaching result maps for the (a) conventional and (b) reduced scenarios for the Mediterranean Valencia region. The thicker line that crosses the maps separates the irrigated area with groundwater on the left with higher nitrate contents and the surface water on the right with lower nitrate contents.
Chapter 11
331
Another recommendation is to take into account the background N applied in the irrigation (Delgado, 2001). For the traditional scenario, crops showed a higher risk potential for NO3-N leaching due to the excessive use of N fertilization and manure applied by farmers. We found that the vegetable cropping area represents less than 40% of the total cultivated area and is about 47% of the N fertilization but contributes with more than 60% of the total NO3-N leaching. In this case, the main recommendation is matching the N supply with the crop demand following some recommendation system based on soil nitrate content such as Nmin (Neeteson, 1995) developed in Europe; the Pre-sidedress soil nitrate test (PSNT), developed in the US (Magdoff, 1991); other systems based on foliar nitrogen content (Olson and Kurtz 1982); or the use of a more detailed simulation model. We also recommend the basic principles to reduce NO3-N leaching presented by Meisinger and Delgado (2002) and the use of deeper rooted crops with shallower rooted crops as recommended by Delgado (1998, 2001) to mine NO3-N from groundwater resources. By comparing the obtained maps (Figure 9) from the two scenarios, a clear reduction of the N leaching is observed for the reduced scenario that follows the GAP recommendations. In Figure 10, the area distribution of NO3-N leaching for the two scenarios is shown. In this figure, we recognize that for the conventional scenario, 5% of the total area leached is less than 100 kg NO3-N ha-1 that corresponds to the citrus area. However, in the reduced fertilization scenario, the NO3-N leaching is reduced significantly, and the area with a lower leaching than 100 kg NO3-N ha-1 is increased to 49%. This reduction is less pronounced in zones irrigated with groundwater with high nitrate content (>100 mg l-1).
Figure 10. Area distribution of the nitrate leaching for the conventional and reduced mineral fertilization scenarios in the Mediterranean Valencia Region of Spain. 332
Advances in Nitrogen Management
Considering just vegetable area, this reduction of leaching is more important, since 33% of the vegetable area that leaches more than 300 kg NO3-N ha-1 in the conventional management is reduced to 7.2% for the reduced fertilization scenario. The nitrate leaching simulated by the NLEAP (monthly analysis) was evaluated against observed data from 4 experimental plots with early potato (Solanum tuberosum L.) (Rodrigo, 1995), orange (Citrus spp.) (Lidon, 1994), romanesco cauliflower (Brassica oleracea var. botritys) (Vaño, 2005) and onion (Allium cepa L.) (unpublished) located close to Valencia. The management data for each field plot and soil parameter are shown in Table 7. The soils of those plots are representatives for the area, with a sandy loam texture at surface and a clayey loam texture in deeper horizons. Table 7. Main crop management and soil input data used in the NLEAP evaluation (Spain). Management parameters: Planting date Harvest date -1
NO -N fertilizer (kg N ha )
Orange
Early potato
Cauliflower
Onion
04/10/92* 12/18/92 0
01/06/92 05/22/92 178
09/20/03 02/10/04 91.5
01/14/03 05/17/04 0
320
406
91.5
60
46.4
56
30.5
96
286 228 80 0
396 126 60 26
264 135 80 0
299 271 60 0
47.4
41.2
17.4
31.4
3
-1
NH -N fertilizer (kg N ha ) 4
-1
Yield (t ha ) Irrigation (mm) Rainfall (mm) Root depth (cm) -1
Organic fertilizer (t ha ) -1
NO3-N irrigation (kg N ha ) Soil parameters: Depth (cm) -3
Bulk density (g cm ) 3
-3
Avail. soil water (cm cm ) 3
-3
Wilting point (cm cm ) Organic matter (%) pH Texture (USDA)
0-30 1.21
30-80 1.5
0-30 1.4
30-60 1.64
0-30 1.21
30-80 1.62
0-30 1.21
30-60 1.62
0.06
0.09
0.16
0.2
0.15
0.09
0.15
0.09
0.08
0.13
0.09
0.1
0.11
0.22
0.11
0.22
1.6 — 1.7 — 1.3 — 1.3 — 7.5 — 8.1 — 7.5 — 7.5 — Sandy Clay Sandy Clay Sandy Clay Sandy Clay loam loam loam loam loam loam loam loam
*Initial simulation date.
Chapter 11
333
The simulated amount of nitrate leached was compared with the estimated NO3-N leaching for each experimental plot. The nitrate leaching observed in the experimental plots was assessed multiplying the water drainage by the nitrate content in soil solution at the maximum rooting depth for each crop. The drainage was estimated by water balance following the FAO methodology (Allen et al., 1998), or in some cases, the drainage under potato or orange crops were calculated in base on the chloride balance in the soil (Ramos, 1988, Lidon et al., 1999). This methodology, although more complex, was used to avoid uncertainties in evapotranspiration estimates. Soil and plant sampling was carried out several times during the crop period to determine the soil mineral nitrogen content at different depths (30, 60, 90 cm) and to determine dry matter and the nitrogen content for each crop. Some calibrations were conducted to adapt the model to local conditions. For this purpose, the parameter required to estimate the N uptake per unit. Yield was calibrated using observed data from the experimental plots. The transpiration crop coefficients (Kc) and length of the growth stages were also calibrated. These model parameters were estimated using those proposed by Allen et al. (1998) for the vegetable crops and those estimated by Castell (2001) for the orange tree. The “region.idx” file was modified to include these parameters. Additional calibration and validation of the model using observed data for other fertilizer management practices, crops, soils, and climate conditions would improve the reliability in the application of the model. After these adjustments were made, the model was ready to conduct the simulations. The soil, climate, and crop management data was inputted in the model for each crop and simulation (Table 7). The general results for the main outputs of the model are shown in Table 8. The evapotranspiration was generally underestimated by the model. This could be explained because some water deficits simulated by the NLEAP would reduce the crop transpiration that are not considered in the assessment of crop evapotranspiration. Although this evapotranspiration was in some cases under predicted, the water drainage simulated was acceptable with a standard error lower than 24% between observed and simulated data. The regression analysis conducted to compare observed to simulated data had a high degree of correlation (r2 = 0.88); a slope of the regression line close to 1 and the intercept at the origin equal to zero can be observed in Figure 11. A close correlation between the N uptake simulated and observed values were found as a result of the calibration of the parameter of nitrogen uptake per unit yield. This parameter should be averaged for each crop and local conditions for a better simulation of the N uptake by the model. Generally, the N leaching simulated by the NLEAP was acceptable with a standard error lower than 18% between observed and simulated, and a high regression coefficient (r2 = 0.90) was found when comparing the observed with simulated (Figure 11).
334
Advances in Nitrogen Management
Table 8. Nitrogen and water budget observed and simulated by NLEAP for each crop.
Figure 11. Measured and simulated amounts of (a) water drainage and (b) nitrate leached for the crops considered in the Mediterranean Region of Spain.
In Figure 12, the cumulative, simulated, and observed NO3-N leaching for each crop during the growing period are shown. In these figures, the model adequately describes the evolution of NO3-N leaching for each crop. The crop with the highest NO3-N leaching was the onion crop. The main nitrate leaching event (61 kg NO3-N ha-1) occurred at the first stage of onion growth (November). This event was due to the high content of soil nitrate at the planting day (216 kg NO3-N ha-1) and was washed out by the planting irrigation event (73 mm). A similar nitrate leaching event was observed during the initial stages of the cauliflower crop. In this crop, high soil nitrate content (366 kg NO3-N ha-1) at the planting day coincides with a high amount of irrigation water (85.3 mm) applied. Chapter 11
335
Figure 12. NO3-N leaching simulated and observed during the growing period for (a) onion, (b) potato, (c) orange, and (d) cauliflower crop.
Two main nitrate leaching periods were observed with the potato crop. The first period was at the development stage of potato (February). The nitrogen taken up by the crop was reduced, and the leaching risk was increased. The second leaching period was caused by an intensive rainfall (73 mm) during May, which leached 84 kg NO3-N. The NO3-N leached during June for the orange crop was not effectively simulated by the model, probably due to the difficulties of the NLEAP to simulate N uptake and root development for permanent crops, such as orange trees. A peak in NO3-N leaching during the orange crop (25 kg N ha-1) was simulated, which was caused by the intensive rainfalls of December (71 mm). An unusual slighted nitrate capillary elevation in the soil was observed during summer in this crop that the NLEAP simulated as null leaching. One of the NLEAP utilities is the estimation of nitrogen uptake efficiency (NUE), which is a useful index to evaluate the efficiency of the nitrogen fertilization for each crop, climate, nitrogen doses, etc. In this study, the NUE was estimated for each crop as the total N uptake divided by the amount of soil NO3-N in rooting depth, plus fertilizer N applied, plus the NO3-N applied in irrigation water and multiplied by 100. The highest value of NUE was 55% for the cauliflower crop. This crop demanded high nitrogen as indicated by its high N uptake (265 kg N ha1 ), and it was fertilized with adjusted doses of nitrogen fertilizer, taking into account the amount of mineral soil nitrogen at the beginning of the 336
Advances in Nitrogen Management
crop (224 kg N ha-1) and the nitrogen crop demand. The lowest fertilizer efficiency was observed for the potato crop where 76% of the amount available to the crop was lost. This crop demands high levels of nitrogen, but it has a low efficiency use (Greenwood et al., 1985; Neeteson and Wadman, 1987; Neeteson and Zwetsloot 1989). Therefore, potato crops are usually heavily fertilized to maintain high yields, however most of the nitrogen is lost to leaching. Higher N Use efficiencies have been reported for potato systems, such as 45% reported by Delgado (1998, 2001). Shoji et al. (2001) reported N Use efficiencies close to 29% for the initial N applied to the potato at planting, but the fertigated N had a NUE of about 64%. This data suggests that NUE with fertigation systems that can control water inputs are higher than those from flooded irrigation. Although the onion crop was fertilized with reduced nitrogen doses (60 kg N ha-1), its NUE of 24% was similar to the potato crop. These efficiencies were close to the 30% efficiency reported for lettuce by Delgado (1998, 2001). The orange crop took up the nitrogen more effectively with a NUE close to 40% for the period considered (April - December). Similar efficiencies were observed by Feigenbaum et al. (1987) for mature orange tree “Shamouti” fertilized with high doses of potassium nitrate labelled with 15N. The rooting system of this crop explores a large volume of soil and facilitates the nitrogen uptake, which increases its efficiency. These NUE values can be used with N fertilizer as an effective way to reduce the NO3-N leaching and maximize the crop yields. CONCLUSION The nitrogen management problems in both countries illustrate similar management problems; however they differ in the factors that cause the specific problems. Fertilizers applied in excess in relation to crop requirements appear to be the main cause of present groundwater enrichment with NO3-N. On the other hand, NO3-N leaching in Argentina is a new issue, and fertilizers are not entirely responsible for the problem. The mineralization of soil organic matter increased by conventional agriculture appears to be mainly responsible in the past. However, with projected increases in N fertilizer inputs, we expect that the occurrence of NO3-N leaching events will increase. It is important to calibrate new tools, such as the NLEAP, to assess the changes in management to help the development of BMP that will increase NUE. In both cases, management of nitrogen became imperative for sustainable crop production. The NLEAP model is a versatile tool that allows for the calculation of potential losses of NO3-N, making use of easily obtained or estimated inputs to run in any local conditions. As reported by Delgado et al. (1998a; 1998b) and Shaffer and Delgado (2001), the NLEAP needs regional and local calibration to improve the accuracy and potential to serve as a tool for Argentinean and Spanish conditions. Chapter 11
337
In Spain, the screening (Annual Nitrogen Index Approach) analysis of the NLEAP model linked to a GIS system (Spanish version) provides a useful tool that can quickly assess and estimate the potential NO3-N leaching at a regional scale. This tool can also be used to evaluate the NO3-N leaching from different management practices in a cost-effective way. In this study, the N doses recommended by the GAP reduced the NO3-N leaching 35% compared with conventional management. A higher reduction is possible if the farmer uses some other fertilizer recommendation system or a detailed simulation model to optimize the management practices. The NLEAP model allowed us to conduct a more detailed analysis of N management and NUE for several crops. After a slight calibration, the model simulated water drainage and NO3-N leaching accurately (Table 8). Although a more extended calibration and validation in other conditions would be needed, the model can be used as a tool to determine the effects of the climate, crop, irrigation, and nitrogen fertilization practices in the nitrate leaching, and is also valuable to support the fertilizer decision and provide information about N leaching. The NLEAP model is starting to be used to develop management strategies to improve the nitrogen fertilization efficiency, reducing the nitrate leaching risk, and increasing crop yield in the Pampas region. Future uses of the model with GIS technology (New NLEAP GIS 4.2 version) would be valuable to detect areas of high risk aquifer contamination, differences in soil properties, management, fertilization doses and application moments, complementary irrigation, crop rotation, and so on. REFERENCES Allen G.R, L.S. Pereira, D. Raes, and M. Smith. 1998. Crop evapotranspiration: Guidelines for computing crop water requirements. Irrigation and Drainage Paper 56. Rome: United Nations Food and Agriculture Organization. http://www.fao.org/docrep/X0490E/x0490e00.htm. Alvarez, R. 2001. Estimation of carbon losses by cultivation from soils of the Argentine Pampa using the Century Model. Soil Use and Management 17:6266. Alvarez, R. 2005. Fertilización de cultivos de granos y pasturas. Diagnostico y Recomendación en la Región Pampeana. Ed. Facultad de Agronomía, UBA. Alvarez, C.R., H. Rimski-Korsakov, P. Prystupa, and R.S. Lavado. 2007. Nitrogen dynamics and losses in direct drilled maize systems. Communications in Soil Science and Plant Analysis 38:1-15. Andriulo, A., C. Ferreira, C. Sasal, M.L.R. de Galetto, F. Abrego, M. Bueno, F. Rimatori, M.A. de la Cruz, M.D.V. Venancio, and R. Giacosa. 2000. Nitratos en el agua subterránea del Partido de Pergamino. Efecto a largo plazo de la agricultura continua y a corto plazo de la producción intensiva de granos. Transactions, XVII Congreso Argentino de la Ciencia del Suelo, Mar del Plata, April 2000. ANFFE. 2008. Asociación Nacional de Fabricantes de Fertilizantes (Spain). www.anffe.com/evolucion.html. 338
Advances in Nitrogen Management
Aparicio, V., J.L. Costa, and M. Zamora. 2008. Nitrate leaching assessment in a long-term experiment under supplementary irrigation in humid Argentina. Agricultural Water Management 95:1361-1372. Auge, M. 1998. Aprovechamiento del Agua subterránea en La Plata, Argentina. In Agua Problemática Regional. Enfoques y perspectivas en el aprovechamiento de recursos hídricos. Asoc. Univ. Grupo Montevideo. Ed. Eudeba, 187-195. Berardo, A. 2004. Manejo de la fertilización en una agricultura sustentable. INPOFOS Informaciones Agronómicas 23:23-28. BOE (Boletín Oficial del Estado). 1996. Real decreto 261/1996 del 16 de febrero sobre protección de las Aguas contra la contaminación producida por los nitratos procedentes de fuentes agrarias. Boletín Oficial del Estado. Boletín Oficial del Estado, March 11, 1996, 9734-9737. Cadahia, C., et al. 2005. Fertirrigacion. Cultivos Horticolas, Frutales y Ornamentales. Madrid: Mundi- Prensa. Castell, J.R. 2001. Consumo de agua por plantaciones de cítricos en Valencia. Fruticultura Profesional 27-32. CEC. 1991. Council Directive of 12th December 1991 Concerning the Protection of Waters Against Pollution Caused by Nitrates from Agricultural Sources (91/676/EEC). Official Journal of the European Communities (L135/1 to 8). CEE. 1998. Directiva del consejo de 3 noviembre, relativa a la calidad de las aguas para el consumo humano. Diario oficial de las Comunidades Europeas. L330, 32-54. Collins, H.P., J.A. Delgado, A. Alva, and R.F. Follett. 2007. Use of 15N isotopic techniques to assess the potential of a mustard cover crop to cycle N to potatoes. Agronomy Journal 99:27-35. Conti, M.E., A.M. Rodríguez, and S.B. Pena. 1985. Distribución y dinámica de los nitratos en argiudoles series arroyo Dulce y Delgado, bajo Cultivo de maíz. Ciencia del Suelo 3:124-129. Costa, J.L., H. Massone, D. Martínez, E.E. Suero, C.M. Vidal, and F. Bedmar. 2002. Nitrate contamination of a rural aquifer and accumulation in the unsaturated zone. Agricultural Water Management 57:33-47. Costa, J.L., and C. Vidal. 1998. Transporte de nitratos en la zona no saturada saturada bajo diversos usos del suelo. XVI Congreso Argentino de Ciencias del Suelo. Villa Carlos Paz, Córdoba, 349-350. Dabney, S.M., J.A. Delgado, and D.W. Reeves. 2001. Using winter cover crops to improve soil and water quality. Communications in Soil Science and Plant Analysis 32:1221-1250. Delgado, J.A. 1998. Sequential NLEAP simulations to examine effect of early and late planted winter cover crops on nitrogen dynamics. Journal of Soil and Water Conservation 53:241-244. Delgado, J.A. 2001. Use of simulations for evaluation of best management practices on irrigated cropping systems. Chapter 10. In Modeling Carbon and Nitrogen Dynamics for Soil Management, ed. M.J. Shaffer et al. Boca Raton, FL: CRC Press. Delgado, J.A., and W.C. Bausch. 2005. Potential use of precision conservation techniques to reduce nitrate leaching in irrigated crops. Journal of Soil and Water Conservation 60:379-387. Delgado, J.A., and M.J. Shaffer. 2008. Nitrogen management modeling techniques: Assessing cropping systems/landscape combinations. In Nitrogen in the Environment: Sources, Problems and Management, ed. R.F. Follett and J.T. Hatfield, 539-570. Elsevier.
Chapter 11
339
Delgado, J.A., M.J. Shaffer, and M.K. Brodahl. 1998b. New NLEAP for shallow and deep rooted crop rotations. Journal of Soil and Water Conservation 53:338-340. Delgado, J.A., R. Khosla, W.C. Bausch, D.G. Westfall, and D. Inman. 2005. Nitrogen fertilizer management based on site specific management zones reduce potential for nitrate leaching. Journal of Soil and Water Conservation 60:402-410. Delgado, J.A., R.R. Riggenbach, R.T. Sparks, M.A. Dillon, L.M. Kawanabe, and R.J. Ristau. 2001b. Evaluation of nitrate-nitrogen transport in a potato-barley rotation. Soil Science Society America Journal 65:878-883. Delgado, J.A., R.F. Follett, J.L. Sharkoff, M.K. Brodahl, and M.J. Shaffer. 1998a. NLEAP facts about nitrogen management. Journal of Soil and Water Conservation 53:332-338. Delgado, J.A., R.J. Ristau, M.A. Dillon, H.R. Duke, A. Stuebe, R.F. Follett, M.J. Shaffer, R.R. Riggenbach, R.T. Sparks, and A. Thompson, L.M. Kawanabe, A. Kunugi, and K. Thompson. 2001a. Use of innovative tools to increase nitrogen use efficiency and protect environmental quality in crop rotations. Communications in Soil Science and Plant Analysis 32:1321-1354. De Paz, J.M. 1999. Acople de un Sistema de Información Geográfica con dos modelos de simulación de lixiviación de nitrato y su aplicación a una zona agrícola. PhD thesis, Universidad Politécnica de Valencia, Valencia, Spain. De Paz, J.M., J.A. Delgado, C. Ramos, M.J. Shaffer, and K.K. Barbarick. 2009. Use of a new GIS nitrogen index assessment tool for evaluation of nitrate leaching across a Mediterranean region. Journal of Hydrology 365:183-194. FAOSTAT. 2006. Agricultural Data. Rome: United Nations Food and Agriculture Organization. http//faostat.fao.org. Feigenbaum S., H. Bielorai, Y. Erner, and S. Dasberg. 1987. The fate of 15N labelled nitrogen applied to mature citrus trees. Plant and Soil 97:179-187. Feijoó, C., L. Rigacci, and S. Doyle. 2005. Ecological regionalization of pampean streams in Argentina. Verhandlungen des Internationalen Verein Limnologie 29:748-754. García, F.O., and F. Salvagiotti. 2009. Eficiencia de uso de nutrientes en sistemas agrícolas del Cono Sur de Latinoamérica XVIII Congreso Latinoamericano de la Ciencia del Suelo San José, Costa Rica, Noviember 16-20, 2009. Generalitat Valenciana. 2000a. Decreto 13/2000 por el que se designan, el ámbito de la Comunidad Valenciana, determinados municipios como zonas vulnerables a la contaminación de las aguas por nitratos procedente de fuentes agrarias. DGOV 3677:1511-1515. Generalitat Valenciana. 2000b. Orden de 29 de marzo de 2000, de la Conselleria de Agricultura, Pesca y Alimentación, por la que se aprueba el Código Valenciano de Buenas Prácticas Agrarias. DGOV 3727:6039-6052. Giambiagi, N., T.V. Pirolo, and L.B. Kraljev. 1976. Disponibilidad de nitrógeno en suelos de la cuenca del Río Samborombón. IDIA 33:170-179. Gobierno Navarra. 1997. Código de Buenas Prácticas Agrarias de Navarra. Pamplona, Spain: Secretaria Técnica, Departamento de Agricultura, Ganaderia y Alimentación. Gómez, A.M., and M.L. Palmero. 1987. Cultivo de Cebolla de Dia Corto. Valencia, Spain: Serie Divulgación Técnica, Generalitat Valenciana, Consellería de Agricultura y Pesca. González, N., M.A. Hernández, and A.V. Ruíz de Galarreta. 1999. Investigación de la contaminación en el acuífero freático. Cuenca de los arroyos Martin-
340
Advances in Nitrogen Management
Carnaval. Buenos Aires, argentina. IV Seminario Hispano-Argentino sobre temas actuales de la hidrología subterránea. Santa Fe, Argentina. Greenwood, D.J., J.J. Neeteson, and A. Draycott. 1985. Response of potatoes to N fertilizer: Dynamic model. Plant and Soil 85:185-203. Hall, A.J., C.M. Rebella, C.M. Ghersa, and J.P. Culot. 1992. Field-crop systems of the Pampas. In Ecosystems of the World, ed. C.J. Pearson, 413-450. Field Crop Ecosystems. Amsterdam: Elsevier. Herrero, M.A., G. Sardi, M.C. Flores, L.I. Carbó, M.S. Iramain, E. Valeriani, and G. Galindo. 2005. Utilización de los factores de riesgo de contaminación por nitratos en la gestión de aguas subterráneas en zonas húmedas de la Argentina. V Seminario Internacional CYTED-XVII, Buenos Aires. INE (Instituto Nacional de Estadística). 2007. Instituto Nacional de Estadística: 2007. Anuario Estadístico de España. Agricultura Caza y Pesca. Encuesta sobre la Estructura de las Explotaciones Agrícolas. Madrid, Spain. ITGME (Instituto Tecnológico Geominero de España). 1998. Mapa de Contenido en nitrato de las aguas subterráneas en España. Ministerio de Medio ambiente. Instituto Tecnológico Geominero de España. Lavado, R.S., and M.A. Taboada. 2009. The Argentinean Pampas: A key region with a negative nutrient balance and soil degradation needs better nutrient management and conservation programs to sustain its future viability as a world agroresource. Journal of Soil and Water Conservation 64:150A-153A. Lidón, A.L. 1994. Lixiviación de nitrato en huertos de cítricos bajo diferentes tratamientos de abonado nitrogenado. PhD thesis, UPV-ETSIA Valencia, Spain. Lidón, A.L., C. Ramos, and A. Rodrigo. 1999, Comparison of drainage estimation methods in irrigated citrus orchards. Irrigation Science 19:25-36. Lopez-Geta, J.A. 1999. La contaminación de las aguas subterráneas por las actividades agrarias en España: La visión de la administración. Jornadas sobre la contaminación de las aguas subterráneas: un problema pendiente. Valencia 1998, 39-63. Madrid, Spain: Instituto Tecnológica Geominero de España. Magdoff, F. 1991. Understanding the Magdoff pre-sidedress nitrate test for corn. Journal of Production Agriculture 4:297-305. MAPA (Ministerio de Agricultura, Pesca y Alimentación). 2004. Anuario de Estadística del Ministerio de Agricultura, Pesca y Alimentación. Madrid, Spain: Ministry of the Environment and Rural and Marine Environs. Maroto, J.V. 1992. Horticultura Herbácea Especial. Madrid, Spain: Mundi-Prensa. MARM (Ministry of the Environment and Rural and Marine Environs). 2008. Sistemas de Indicadores del Agua-SIA. Madrid, Spain: Ministry of the Environment and Rural and Marine Environs. www.mma.es/portal/secciones/acm/aguas_continent_zonas_asoc/sia/inde x.htm. MARM. 2009a. Anuario de Estadística Ministerio de Medio Ambiente y Medio Rural y Marino: 2008. Madrid, Spain: Ministry of the Environment and Rural and Marine Environs. MARM. 2009b. Balance de Nitrógeno en la Agricultura Española: Año 2007. Resumen de resultados a nivel: provincial,·autonómico,·nacional. Madrid, Spain: Ministry of the Environment and Rural and Marine Environs. MECON. 2006. Abastecimiento de Urea Para el Sector Agropecuario. http://www.mecon.gov.ar/cndc/dictamenes/dictamenfinal_urea.pdf.
Chapter 11
341
Meinardi, C.R., A.H.W. Beusen, M.J.S. Bollen, and O. Klepper. 1995. Vulnerability to diffuse pollution and average nitrate contamination of European soils and groundwater. Water Science Technology 31:159-165. Meisinger, J.J., and J.A. Delgado. 2002. Principles for managing nitrogen leaching. Journal of Soil and Water Conservation 57:485-498. MMA (Ministerio de Medio Ambiente). 2001. Caracterización de las fuentes agrarias de contaminación de las aguas por nitratos. Madrid, Spain: Dirección General de Obras Hidráulicas y Calidad de la Aguas, Ministerio de Medio Ambiente. Mugni, H., S. Jergentz, R. Schulz, A. Maine, and C. Bonetto. 2005. Phosphate and nitrogen compounds in streams of Pampean Plain areas under intensive cultivation (Buenos Aires, Argentine). 4th International Symposium Phosphate in Sediments, ed. L. Serrano and H.L. Golterman, 163-170. Neeteson, J.J. 1995. Nitrogen management for intensively grown arable crops and fields vegetables. In Nitrogen Fertilization in the Environment, ed. P.E. Bacon, 295-325. New York: Marcel Dekker. Neeteson, J.J., and W.P. Wadman. 1987. Assessment of economically optimum application rates of fertilizer N on the basis of response curves. Fertilizer Research 12:37-52. Neeteson, J.J., and H.J.C. Zwetsloot. 1989. An analysis of the response of sugar beet and potatoes to fertilizer nitrogen and soil mineral nitrogen. Netherlands Journal of Agricultural Science 37:129-141. Olson, R.A., and L.T. Kurtz. 1982. Crop nitrogen requirements, utilization and fertilization. In Nitrogen in Agricultural Soils, ed. F.J. Stevenson, 567-604. Madison, WI: American Society of Agronomy. Otegui, M.E., F.H. Andrade, and E.E. Suero. 1995. Growth, water use, and kernel abortion of maize subjected to drought at silking. Field Crops Research 40:8794. Pomares, F. 1997. Fertilización. In Cultivo de la Coliflor y Bróculi. 77-88. Valencia. Spain: Consellería de Agricultura, Pesca y Alimentación, Generalitat Valenciana, Fundación Caja Rural. Portela, S.I., A.E. Andriulo, E.G. Jobbágy, and M.C. Sasal. 2009. Water and nitrate exchange between cultivated ecosystems and groundwater in the Rolling Pampas. Agriculture, Ecosystems and Environment 134: 277-286. Ramos, C. 1988. The use of the chloride balance method for estimating nitrate leaching. In Nitrogen Efficiency in Agricultural Soils, ed. D.S. Jenkinson and K.A. Smith, 256-268. London: Elsevier. Ramos, C., I. Bautista, R. Belda, J.M. De Paz, J. Doltra, F. Legaz, and F. Pomares. 2005. Sistemas de recomendación de abonado. In Proceedings of the 1st Meeting of the Fertilization Group of the Spanish Horticultural Science Society, Valencia, Spain, October 4-6, 2005. Rimski-Korsakov, H., M. Alconada, and R.S. Lavado. 2001. Lixiviación de nitratos a partir de fertilizantes y biosólidos en un suelo arcilloso. Ingeniería Sanitaria y Ambiental 53:60-63. Rimski-Korsakov, H., G. Rubio, and R.S. Lavado. 2004. Potential nitrate losses under different agricultural practices in the Pampas Region, Argentina. Agricultural Water Management 65:83-94. Rimski-Korsakov, H., C. Alvarez, M.B. Rodríguez, and R.S. Lavado. 2005. Predicción de los nitratos a cosecha de maíz en suelos de la región pampeana. Informaciones Agronómicas INPOFOS 27:14-17.
342
Advances in Nitrogen Management
Rimski-Korsakov, H., G. Rubio, I. Pino, and R.S. Lavado. 2008. Destino del nitrógeno del fertilizante en un cultivo de maíz. Informaciones Agronómicas IPNI 39:1-5 Rimski-Korsakov, H., G. Rubio, and R.S. Lavado. 2009a. Effect of the water stress in the maize crop production and nitrogen fate. Journal of Plant Nutrition 32:565- 578. Rimski-Korsakov, H., M.S. Zubillaga, M.R. Landriscini, I. Pino, S. Etchegaray, N. Baldassini, and R.S. Lavado. 2009b. Cultivos de cobertura: son siempre eficientes para disminuir el riesgo de lixiviación de nitratos? In Jornadas Nacionales Sistemas Productivos Sustentables: Cultivos de Cobertura, Bahía Blanca, August 10-11, 2009. Rodrigo, A. 1995. Efecto del abonado nitrogenado en la lixiviación de nitrato en el cultivo de la patata. PhD thesis, UPV-ETSIA, Valencia. Spain. Scheiner, J.D., C.O. Fernández, and R.S. Lavado. 2000. Riesgo ambiental asociado al aumento de la carga animal en pasturas cultivadas en suelos del oeste bonaerense. Ecología Austral 10:81-87. Shoji, S., J.A. Delgado, A. Mosier, and Y. Miura 2001. Miura. Use of controlled release fertilizers and nitrification inhibitors to increase nitrogen use efficiency and to conserve air and water quality. Communications in Soil Science and Plant Analysis 32:1051-1070. SAGPYA. 2008. Estimaciones Agrícolas. http://www.minagri.gob.ar/. Shaffer, M.J., and J.A. Delgado. 2002. Essentials of a national nitrate leaching index assessment tool. Journal of Soil and Water Conservation 57:327-335. Shaffer, M.J., and J.A. Delgado. 2001. Field techniques for modeling nitrogen management. In Nitrogen in the Environment, ed. R.F. Follett and J.T. Hatfield, 391- 411. CRC Press. Shaffer, M.J., A.D. Halvorson, and F.J. Pierce. 1991. Nitrate leaching and Economic Analysis Package (NLEAP): Model description and application. In Managing Nitrogen for Groundwater Quality and Farm Profitability, ed. R.F. Follett, D.R. Keeney, and R.M. Cruse, 285-322. Madison, WI: American Society of Agronomy, Crop Science Society of America, and Soil Science Society of America. Soriano, A., R.J.C. León, O.E. Sala, R.S. Lavado, V.A. Deregibus, M.A. Cauhépé, O.A. Scaglia, C.A. Velásquez, and J.H. Lemcoff. 1991. Rio de la Plata grasslands. In Temperate Subhumid Grasslands, ed. R.T. Coupland, 367-407. Ecosystems of the World. 8, Natural Grasslands. Amsterdam: Elsevier. Steinbach, H.S., R. Alvarez, and C.R. Valente. 2004. Balance between mineralization and immobilization of nitrogen as affected by soil mineral nitrogen level. Agrochimica LVIII:204-212. Vaño, T. 2005. Influencia del nitrógeno mineral disponible en la producción de romanesco y en la lixiviación del nitrato. Valencia, Spain: Universidad Politécnica de Valencia. Varela, M. 1991. Situación de la contaminación por nitratos en las aguas subterráneas del territorio peninsular y balear. Servicio Geológica. Informaciones y Estudios 53. MOPT. Xunta de Galicia. 1999. Código galego de boas prácticas agrarias. Conselleria de agricultura, ganderia e política agroalimentaria. Servicio de Publicacions. Coruña, Spain.
Chapter 11
343