Does not account for the total costs of producing a product on a recurring basis and that full. (totally absorbed) costing, as in traditional accounting, is a better ...
1
Section IV Performance Measures
.
Chapter 13 Traditional Measures in Finance and Accounting, Problems, Literature Review, and TOC Measures
Charlene Spoede Budd
Introduction This chapter is a basic introduction to Throughput Accounting (TA). To provide historical perspective, the chapter provides a brief review of both the business environment and the development of cost accounting methodologies. Accounting personnel usually are among the last people to be educated in Theory of Constraints (TOC) concepts. We constantly are amazed at the reported successful TOC implementations that have not educated accounting and finance people at all. Yet operations people expect that they can overcome resistance to their improvement plans. One very successful TOC implementation champion, strongly supported by the CEO, lamented that he could not understand why the accounting department had hired additional personnel to track the cost of each individual operation when he had established a seamless flow line. The accountants were doing what they had been taught to do. Without an understanding of TOC concepts, when they had sufficient information, they would begin questioning the cost of certain operations,
2 reporting local efficiencies, and providing other misleading information such as unit costs. I hope that this chapter will develop an appreciation of accounting and finance personnel—what they can do for you and what they can do against you—and provide a strong argument for educating accounting and finance personnel along with those in operations. TOC initiatives need collaborative partners rather than colleagues who constantly construct a maze of barriers. For accountants who have a suspicion that traditional accounting methodologies produce internal data containing weaknesses for decision makers, this chapter will point out where the weaknesses exist. To accomplish this ambitious goal, the chapter will:
Briefly describe the history of traditional cost accounting and explain why it no longer provides the information needed to support the improvement initiatives made possible by TOC.
Survey, classify, and describe the limitations of the profession’s various accepted (published) solutions to replace traditional internal measurement systems.
Discuss the breadth of TA and its impact on all TOC initiatives through a continuing case study.
Identify the need for future research in accounting and finance to support TOC concepts, including the development of relevant performance evaluation systems.
The final section of the chapter will introduce the remaining chapters in this section of the TOC Handbook.
Traditional Cost Accounting and Business Environment Cost accounting is designed and developed to help managers make decisions. When cost accounting's assumptions mirror those of the organization, the information provided enables good decisions. Conversely, when accounting assumptions are not valid, managers make good decisions only by using their intuition or by chance and not by using the accounting information provided. As the environment changes, internal accounting and reporting should be changed to reflect that new environment and provide information that is more relevant to managers. In most companies, as we shall see, this adaptation has not occurred or has greatly lagged changes.
Development of Cost Accounting Accounting has been around since exchanges first began taking place, but until the 19th century, few people were involved in financial reckonings and internal accounting was mostly conducted visually by owners and managers. With the onset of the industrial revolution and the growth of large companies, accounting became more important and cost accounting began to be developed to control large organization chaos (Cooper, 2000; Antonelli, Boyns, and Cerbioni, 2006; Kaplan, 1984; McLean, 2006). Since the industrial revolution began first in Great Britain, their engineers and accountants were the first to recognize the need for cost/management accounting (McLean, 2006; Edwards and Boyns, 2009; Fleischman and Parker, 1990), but their accounting developments were not publicized (Fleischman and Parker, 1997). In the United States, modern cost/management accounting began in the late 19th and early
3 20th centuries (Tyson, 1993), especially with the introduction of mass production.1 The scientific management movement, supported by the theories of Frederick Taylor2 (1911, 1967), Walter Shewhart (1931, 1980), and Mary Parker Follet's enlightened approach to management (Follett and Sheldon, 2003), drove the development of supporting cost/management accounting by engineers and accountants such as Alexander Hamilton Church (Jelinek, 1980; Litterer, 1961), who railed against "averaging" production overhead costs over all jobs or products produced and insisted that all production costs must be assigned to orders or products (Church, 1908). In a two-stage process, overhead typically is assigned first to departments and then to jobs or products passing through the department.
Business Environment, First Half of the 20th Century Frederick Taylor's theories, while not universally accepted, were widely believed and practiced by companies during the early decades of the 20th century (Kanigel, 1997). Business schools, including Harvard Business School (Cruikshank, 1987) began teaching Taylor's scientific management. By the 1930s, most large manufacturers had adopted some form of manufacturing overhead allocation, but standard costs and related detailed variance analysis did not come into widespread use until after World War II (Johnson and Kaplan. 1987). Rather than being developed to control manufacturing costs, the original purpose of variance analysis was to value inventories and derive income statement costs (Johnson and Kaplan. 1987). This is because generally accepted accounting principles (GAAP) require that actual (not standard) costs appear on the balance sheet and the income statement and standard costs, plus favorable variances or minus unfavorable variances, equal actual costs. During World War II, the demand for war supplies fueled widespread implementation of mass production (Grudens, 1997). Following the war, companies rushed to fulfill pent up consumer demand, and some companies used standard costs and variance analysis to control production costs (Vangermeersch and Schwarzback, 2005; McFarland 1950).
Business Environment, Second Half of the 20th Century During the 30 years following World War II, U.S. companies basically followed the same strategy of costconscious mass production. In addition, the premier department in schools of business, those drawing the most intelligent students and wielding the most political power, slowly switched from accounting to finance. During the 1960s and probably much earlier, Harvard Business School began teaching MBA students how to manage by the numbers, meaning using a company’s financial records and other formulas and models developed in finance (Peters and Waterman, 1982, 30) to manage the company. While there were cautions published about the formulas’ complex and fragile treatment of uncertainty in the development of financial models and the overreliance on the skills of MBAs (Johnson and Kaplan, 1987, 15, 125–126; Peters and Waterman, 1982, 31–33; Hayes and Abernathy, 1980 67), the predominance of finance departments over accounting departments in both academia and industry gradually spread across the United States and 1 2
An excellent summary may be found in Johnson and Kaplan (1987, Chap. 2). For a critical review of textbook treatment of Frederick Taylor's principles and the Hawthorne experiments by Elton Mayo and others, see Whitehead (1938) and Olson et al. (2004).
4 throughout the world during almost the next two decades.3 The focus of the 1980s on behavioral consequences of the formulistic approach to business decisions lasted about a decade; by the 1990s, though, business was back to using formulas and models, along with new continuous improvement methodologies (Dearlove and Crainer) in order to regain ground lost to international competitors.4 This movement no doubt was inspired and certainly facilitated by consulting firms who found ingenious ways to convince management their assistance was required (Stewart, 2009).
Accounting's Response to a 20th Century Changing Environment Management accounting, for most companies, barely noticed the changes occurring in business due to their general absorption with other accounting areas (e.g., financial, tax, auditing) and most especially GAAP accounting for external reporting (Johnson and Kaplan, 1987, 2–14, 125). However, it became obvious during the 1980s that traditional accounting and accounting reports had lost their relevance for internal decisions (Johnson and Kaplan, 1987). Fully absorbed manufacturing costs, including variable and fixed costs of production (whether actual or standard costs), accumulated for external reporting purposes typically do not provide information needed by managers for operating decisions. Some solutions to the irrelevance of management accounting information have been known for a number of years, but have not been widely accepted and practiced. In addition, newer solutions recently have been proposed (Johnson and Broms, 2000; Kaplan and Norton, 1992; Smith, 2000; Cunningham and Fiume, 2003; Oliver, 2004; Van Veen-Dirks and Molenaar, 2009). The most well-known proposed accounting solutions are discussed in the following sections.
Direct or Variable Costing Income Statement Direct or variable costing5 (where all costs are divided into fixed and variable components that are then recorded in separate accounts), however, has been included in textbooks since at least the 1960s (Dopuch and Birnberg, 1969, Chapter 15) and has been covered in virtually every cost and management accounting textbook since that time (Garrison, Noreen, and Brewer, 2010, Chapter 7; Hilton, 2009, Chapter 8). The basic format begins with revenues earned, then subtracts all variable costs to provide contribution margin (sometimes called gross margin). From contribution margin, all fixed costs (both manufacturing and general, selling, and administrative) are deducted to arrive at operating income. This method is not acceptable for external financial statements, however, and has not been broadly accepted. Direct or variable costing is presented in all cost and managerial accounting textbooks as a method of periodic reporting and for providing information for decision makers. The basic idea is that revenue, minus all variable costs, is subtotaled as contribution margin. Fixed costs are then subtracted from contribution margin to find operating income. While contribution margin may be used to find a contribution margin 3
A long-time acquaintance, a senior partner in an international audit firm who had majored in accounting during his undergraduate years, confessed to the author that he would recommend that his children major in finance, not accounting. 4 See Peters and Waterman (1982, 34–39) for a discussion of this situation and relevant references. 5 Also sometimes called "margin" costing or "contribution margin" costing since the first subtotal on this type of statement is called "contribution margin" or "gross margin."
5 per constraining unit (discussed later), this topic is treated independent of the direct costing income statement. In addition, many accountants were taught that direct labor, the cost of workers actually transforming a company's product ("hands-on" work) is a variable cost, as was true when cost accounting was developed at the start of the 20th century. Because TA follows the same basic format as direct or variable costing accounting for periodic reporting, however, the following discussion is important.
Advantages of Direct Costing Advocates for direct costing base their interest on internal flows (Dopuch and Birnberg, 1969, Chapter 15)6 and providing information for internal decisions. They claim that direct costing: • Focuses attention on those costs that most closely approximate the marginal (incremental) costs of production; • Relates profit to sales, rather than to sales and production, as does traditional accounting; • Treats fixed costs as a period expense since these amounts must be expended in order to be in position to produce and must be incurred each period without regard to production quantity (that is, certain costs must be incurred even when production is at or near zero). The advantages and disadvantages of direct costing are discussed in every cost or management accounting textbook when the methodology is introduced. While supporters and distracters at one time were passionate in their support or opposition, most authors now just list the advantages and disadvantages.
Disadvantages of Direct Costing Opponents of direct costing do not accept the benefits claimed for direct costing and point out its theoretical weaknesses. They claim, as support for their stance, that direct costing: • Violates the matching concept of accounting where the total unit cost of production (variable and fixed) must be recognized in the period when units are sold and not match the period in which they were incurred; • Does not account for the total costs of producing a product on a recurring basis and that full (totally absorbed) costing, as in traditional accounting, is a better measure of the incremental cost of production; • Is only applicable over a specified output range and variable costs may change outside the originally assumed range. While it is difficult to know what proportion of companies regularly record variable and fixed costs in separate journal accounts (companies are not required to disclose this information), the author's experience is that most companies do not. Since the separation of costs into fixed and variable components is required for virtually all internal decisions, this information must be accumulated in special studies. Unfortunately, most accounting/finance departments have little time to devote to special projects when relevant
6
Dopuch and Birnberg (1969, 472) relate the original internal flow concern to a 1936 article (Harris, 1936).
6 information is not readily available.
Activity-Based Cost Accounting Activity-based cost (ABC) accounting might be considered accounting's attempt to "return to the basics" with several new twists. First, overhead is assigned to many pools, not to departments. Second, since all overhead costs can be changed over time, they are assumed to be variable. Third, the selection of allocation bases (drivers) used to allocate pool costs depends on whether costs are incurred at the unit, batch, product line, or facility level. (Facility-level costs include general manufacturing costs common to all production.) In practice, companies implementing ABC accounting allocate manufacturing costs as originally proposed by Church (1908, 1917), but rather than assigning overhead costs to departments, they are allocated to activity pools. Activity pools are holding accounts where costs for a particular activity, such as material movement, can be accumulated prior to being charged to users of the activity. Thus, if one product or product line requires more movement than other products, it would receive more of the material movement costs (Cooper et al., 1992).
Advantages of ABC Accounting/Management Besides appearing more precise than traditional accounting, ABC accounting offered several advantages. ABC accounting: • Gave companies (and accounting departments) hope that they could do something to reverse their poor business performance; • Validated claims by operations people that small runs of "special" products cost more to produce than did long runs of common or commodity-type products; • Silenced, for the most part, "fairness" arguments concerning overhead allocations; • Provided much detailed information that could be analyzed for improvement initiatives, leading to the development of activity-based management (ABM; Cokins, 2001). In addition to these advantages, companies that have taken the first step of charting all flows from purchase of raw materials through production processes to finish goods and shipping prior to implementing ABC have universally reported benefits achieved from their increased knowledge of their systems. Making use of all the data collected and updating it to track frequent changes in the business environment, however, has proven quite difficult and costly.
Disadvantages of ABC Accounting As originally developed, ABC accounting and ABM required tremendous amounts of quantitative data on anticipated and actual driver (allocation base) consumption.7 Complex original implementation efforts and continuing data collection issues resulted in complaints that ABC accounting: • Requires too much detailed data collection efforts by operating employees who did not want or
7
Time-driven allocations later were promoted in an attempt to overcome some of these deficiencies (Everaert and Bruggeman, 2007; Kaplan and Anderson, 2003), but were generally unsuccessful (Cardinaels and Labro, 2009).
7 use the information provided; • Permits subjective selection of pools and drivers; • Lacks an easy way to identify erroneously reported data; • Mixes fixed and variable costs in the same pool (by assuming all costs are variable); • Focuses on reducing costs, not generating revenue; • Generates costs that greatly exceed benefits attained. (Ricketts, 2008, 54; Bragg, 2007a, 207–209; Palmer and Vied, 1998; Geri and Ronen, 2005.) Even though the adoption of ABC accounting or ABM has been low and scattered (Bhimani et al., 2007; Kiani and Sangeladji, 2003; Cohen, Venieris, and Kaimenaki, 2005), academics and consultants continue to support the methodology (Stratton et al., 2009).
Balanced Scorecard Recognizing the importance of appropriate performance measures to motivate employees to coordinate their activities (and later to implement company strategy), a performance scorecard that included nonfinancial metrics was developed by industry leaders.8 "The scorecard measures organizational performance across four balanced perspectives: financial, customers, internal business processes, and learning and growth." (Kaplan and Norton, 1992; Kaplan and Norton, 1996, 2) While the most well-known advocate of the balanced scorecard has not abandoned activity-based costing (Kaplan and Norton, 1996, 55–57), a more balanced set of measures is intended to include the guidance of non-financial metrics and provide a more global perspective. Surveys indicate that balanced scorecard concepts are used in most large companies in the United States and throughout the world. Despite reported successful implementations, however, there is little empirical evidence that implementing a balanced scorecard results in increased earnings (Speckbacher, Bischof, and Pfeiffer, 2003).
Advantages of a Balanced Scorecard Performance Reporting System One of the major benefits of a balanced scorecard system, its ease of understanding, also may be one of its biggest flaws. It is entirely possible that managers, easily accepting the basic idea of balancing metrics across all aspects of a business and therefore prone to implementing balanced scorecards without outside consultants, have not sufficiently customized their balanced scorecard systems. Nevertheless, companies expect that a balanced scorecard performance reporting system will: • Focus all employees on longer-term goals; • Clarify the relationships and importance of various strategic goals; • Align employee behavior with strategic goals; • Provide relevant and timely feedback to managers; • Promote better decisions; 8
While Kaplan and Norton generally are credited with the development of the balanced scorecard, their renowned book states in the preface that a dozen companies met bi-monthly throughout 1990 to develop a new model (Kaplan and Norton, 1996, p. vii).
8 • Improve operating performance. (Buhovac and Slapnicar, 2007; Anonymous, 2008, 80; Lawson, Stratton, and Hatch, 2003.) Unfortunately, most of these expectations are unfulfilled for the majority of adopters.
Disadvantages of Balanced Scorecards It is estimated that up to 70 percent of organizations have adopted balanced scorecards (Angel and Rampersad, 2005). However, even proponents of balanced scorecards admit that up to 90 percent of adopters fail to execute well-planned strategies (Weil, 2007). For whatever reasons,9 balanced scorecard promises have not been delivered. One author came up with a list of "Top 10" problems with most scorecards (Brown, 2007, 9). Most researchers conclude that a balanced scorecard: • Encourages too many measures that divert focus from what is important; • Gives obvious priority to financial measures; bonuses are rarely based on non-financial metrics; • Excludes, too often, appropriate measures for learning and organizational growth; • Provides an unfavorable cost/benefit ratio; • Produces measures from diversified divisions that cannot be aggregated at the corporate level; • Neglects to clearly connect strategy with action at the individual employee level; • Provides lagging metrics that do not produce timely information. (Speckbacher, Bischof, and Pfeiffer, 2003; Weil, 2007; Brown, 2007, 9; Bourne et al., 2002.)
Lean Accounting Borrowing liberally from English translations of Toyota's development of Lean operations, all the way from The Machine that Changed the World (Womack, Jones, and Roos, 1990) to The Toyota Way (Liker, 2004) and The Toyota Way Field Book (Liker and Meier, 2006), Lean accounting intends to adapt to accounting the basic principles of eliminating waste, reducing time and cost, and developing value streams. Lean concepts were developed in the manufacturing industry, but even service industries now are adopting Lean techniques. For example, in an attempt to reinvigorate its operations, Starbucks recently introduced Lean techniques in its coffee shops (Jargon, 2009). An executive search firm (recruiting Lean executives) has begun using Lean concepts (Brandt, 2009), back offices are implementing Lean (Brewton, 2009), and even hospitals are trying it out (Does et al., 2009).
Connection to Value Stream Analysis (Cell Manufacturing Analogy) The traditional accounting approach consists of gathering, by department, division, or segment, direct costs, which include all variable costs of production plus fixed costs benefiting a single unit, and allocating common costs (shared fixed costs) to all units that benefit from the common costs. In contrast, Lean accounting, like Lean operations, focuses on establishing, for a value stream (a production flow for a particular product or family of products), a flow of data that rapidly produces high-quality information (Maskell and Baggaley, 2004, 9–10). For example, if processing accounting transactions individually, one 9
Many dissertations have been based on balanced scorecard concepts. For example, Deem (2009) conducted a study that found a positive relationship of balanced scorecard effectiveness and organizational culture.
9 by one, speeds up the flow of information to operating managers, that methodology is preferred even though batch processing of data may be a more cost-effective process. Most Lean accounting advice, though, applies to operations, not to activities of the accounting department itself.10 Applying Lean accounting concepts to an operation where costs are aggregated by value streams, established for each product line or family of products, requires "dedicated" value stream resources. Each stream is designed to speed the flow of production and minimize arbitrary cost allocations. Dedicating resources to each stream results in some duplication of resources. Duplication of resources, of course, increases costs. Production, however, is speeded up and revenue is earned more rapidly. Lean accounting recognizes the arbitrary nature of allocating common (shared) fixed costs and attempts to avoid this issue either by dedicating resources to individual value streams where allocations are limited to product family members or just not allocating common manufacturing overhead costs such as those for buildings, security, human resource departments, etc. Demonstrating the strong tendency to revert to accountants' extensive traditional accounting education, however, two Lean accounting books (Maskell and Baggaley, 2004; Huntzinger, 2007, Chapter 17, see especially page 259) recommend allocating common fixed resources in order to produce a total cost per unit. A fully allocated cost per unit, though, is of dubious value to managers.
Advantages of Lean Accounting Lean accounting proponents claim that through participating in kaizen events, an attempt to attain continuous improvement and referred to as a kaizen blitz(SM)11 when performed by a focused team over a short period of a few days, the exposed opportunities for improvements can be supported by accounting measures and reports. By understanding and reporting the results of Lean initiatives, Lean accounting supports improvements such as: • Reduction, frequently dramatic, in work-in-progress (WIP) inventory;12 • Elimination of non-value-added processes resulting in decreased total processing times; • Increased company productivity; • Reduced setup and change-over times; • Increased on-time deliveries. (Womack et al., 1990, 81; Liker, 2004, 3-6; Polischuk, 2009; Shipulski, Hockley, and Beck, 2009.) These advantages are the result of applying Lean concepts throughout an organization or a supply chain. Even with accounting support, realizing benefits promised by Lean initiatives is extremely difficult.
Disadvantages of Lean Accounting General lack of success in copying another organization's strategy has been experienced, if not reported, by many firms. Attempting to reproduce improvement results on other than a short-term basis without 10
This is not for lack of improvement opportunities in accounting. Simply reducing the time typically required to close the books would be of great benefit. 11 Kaizen blitz(SM) is a service mark term of the Association of Manufacturing Excellence. 12 An extensive example later in the chapter shows the unintended negative effect of inventory reduction on the income statement.
10 supporting behavioral and cultural changes generally has not been successful. Failures of Lean implementations, and Lean accounting, have pointed to the following deficiencies: • Top management does not actively and continuously support Lean initiatives; • Accounting/finance people are not included in Lean training sessions (a not uncommon situation for all improvement initiatives); • Information flows are not adapted to match new Lean flows (value streams); • Publicizing local "successes" creates competition among various units of an organization; • Appropriate performance metrics are not developed. (Achanga et al., 2006; Pullin, 2009; Shook, 2009; Stuart and Boyle, 2007.) In addition to the new accounting developments discussed previously, some traditional accounting techniques such as standard costs and master budgets have remained powerfully in place.
Traditional Budgeting, Capital Budgets, and Control Mechanisms While some organizations disparage the budgeting process (Nolan, 2005; Weber and Linder, 2005; Anonymous, 2003; Hope and Fraser, 2003), most companies still go through the annual angst of budget preparation with all the pomp, posturing, and political maneuvering of a public sporting event. Even if bad behaviors erupt, there are good reasons, such as detailed planning, company-wide coordination, and synchronization of effort, to undergo this process. Regardless of the particular accounting methodology used to record and report transactions internally, most organizations, including governments, prepare budgets for various time periods, typically for a quarter or annual period, but sometimes for 3- or 5-year periods. Budgets not only can be for differing time periods, but can be very specialized, such as a budget for a new product introduction or another individual project, an operating budget focusing on expected (or hoped for) operating income, a capital budget for asset acquisition, or a budget covering an entire organization, called a "master" budget.13
Master Budgets Comprehensive (master) budgets should follow carefully laid strategic plans (although sometimes they proceed, or evolve into, the strategy). This process forces introspection and consideration of underlying assumptions and intended or possibly unintended consequences. In addition, budgets can project cash flow shortages in time to acquire bank-lending commitments at favorable times—before the cash is needed. For convenience, an annual master budget typically is broken down, somewhat arbitrarily, into monthly or quarterly sub-periods and can require many months of back and forth communications between the finance department or budget committee and affected departments, business units, or segments (Bragg, 2007a, 30). Financial planning includes preparing a projection of what the company hopes to accomplish for the next period. The typical budget process begins with projected sales in units and in currency, on a monthly
13
The vast majority of recent budget research concerns governmental budgeting, which has unique issues (Kelly and Rivenbark, 2008) and will not be addressed here.
11 basis, for a 12-month period.14 Based on expected sales and certain information concerning desired inventory levels, production in units, material acquisition (in units and currency), labor costs, variable overhead elements, and other production fixed overhead amounts to be incurred are estimated for each month of the period. At this point, cost of sales is computed for each month. Next, a schedule of general, selling, and administrative expenses, usually divided into variable and fixed components, is prepared. Using the previous information, along with assumptions concerning collections from customers, payments to suppliers, asset acquisitions, and the timing of other cash inflows and outflows, a statement of changes in cash is prepared. Only then is sufficient information available for projected income statements and balance sheets. (See master budget relationships, in diagrams, in Garrison et al., 2010, 375; Hilton, 2009, 350.)
Capital Budgets One of the largest cash requirements involves acquisition of additional assets. In large, decentralized organizations, capital budget requests are prepared by investment centers that have responsibility for return on assets as well as profit and loss. These centers require additional resources in order to fulfill their stretch goals and do not (and probably cannot) predict the impact of their request on the entire organization. Therefore, executive committees usually schedule marathon sessions where managers come in and present their cases, using projected cash flows and net present values, for additional investment. The committee then must decide which proposals to fund15 based on logical analyses of short, compelling, and often competing presentations. Due to the time required to achieve budget agreement on budgets of all sorts, management frequently is reluctant to revise budget numbers when original assumptions are invalidated. Thus, the data formulated during the Fall for a calendar-year company may be used for the next 12 to 15 months. Once the budget period begins, large organizations typically prepare periodic flexible budgets, which are based on actual results of the critical area of the organization on which a master budget is originated. For example, if a company has excess capacity, the first schedule in a master budget is sales units, followed by projected sales in the organization's currency, followed by production schedules, material schedules, etc. Therefore, once sales are known, expected costs associated with those sales can be prepared. If a company has more demand than it has resources to fulfill, however, the master budget must begin with a production schedule featuring the desired product mix. Then sales, in currency and other supporting schedules can be derived. Later actual production and sales of various products, along with expected costs, can be combined in a flexible budget. Flexible budgets present more meaningful interlocking data once actual critical area performance is known.
Use of Budget Data In addition to their planning role, budgets frequently are used in performance evaluation. Because a master
14
Due to space constraints, most textbooks illustrate quarterly budgets (Garrison et al., 2010, Chapter 9; Hilton, 2009, Chapter 9), but companies need budgets prepared on at least a monthly basis in order to accurately predict cash needs and when it might be possible to invest extra cash. 15 It is the author's experience that marketing people make the most sophisticated presentations.
12 budget contains budgets for each area of an organization, it is easy to engage in performance to budget, where actual results for each area are compared with budgeted predictions and favorable or unfavorable variances computed and reported. Flexible budgets, as reported by every cost and management accounting textbook produced in the last several decades, control some, but not all, of the damage of this type of performance report.
Advantages and Disadvantages of Traditional Budgets Advantages of budget preparation include the following: • Planning for future periods is required. • Budgets facilitate communication throughout an organization. • Goals (expectations) are set. • All areas of the organization have input into the process. • Upcoming creditor covenants can be met or renegotiated. • Resource requirements can be established. (Hilton, 2009, 348–349; Garrison et al., 2010, 369.)
Disadvantages of the budgeting process and its uses are that it: • Sets an upper bound on performance (diminished incentive to "outperform" the budget); • Encourages padding of requests (gaming) in anticipation of forced reductions; • Results in a lack of budget ownership (budget numbers frequently are dictated by upper-level management); • Encourages competition between areas for resources; • Can encourage dysfunctional behavior in order to meet budget amounts; • Is cumbersome and too expensive. (Hope and Fraser, 2003, Chapter 1; Hilton, 2009, 375–376; Cunningham and Fiume, 2003, 133–139.)
TOC Approach to Planning, Control, and Sensitivity Analysis As amazing as it may sound, TOC makes the strong assertion that all the allocation gyrations of traditional and newer accounting methodologies are not necessary and generally serve to confuse and obfuscate rather than enlighten. In fact, implementing TOC (or any other management improvement initiative) without changing the internal accounting and reporting system will send mixed messages to the troops and eventually, by encouraging people to go back to old and out-of-date policies and assumptions upon which previous reporting is based, will undermine the new system.
Planning At its most basic level, planning includes establishing strategy and then implementing the chosen strategy. Because this subject is treated in detail in later chapters in this Handbook (Chapters 15, 18, 19, and 34), treatment of strategy and tactics are deferred until later. The typical starting point for planning in a Throughput environment is recognition of the organization's most binding constraint (Step 1 in TOC's 5 focusing step (5FS) process). If raw materials are in short supply,
13 vendors may occupy this position. Most often, though, an organization's demand from its customers poses the most binding constraint, especially in times of recession in the economy as experienced in the last half of 2008 and in 2009. Because of company policies, however, it is not unusual also to find one or multiple internal constraints.
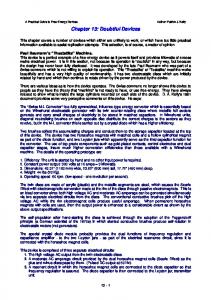
Finding the Best Product Mix Accounting people typically think about capacity in terms of facility capacity, not the capacities of individual resources used to produce a company's products. If demand is greater than any one of an organization's resource capacities, however, products must be prioritized. The traditional approach is to prioritize products based on one of the following: (1) selling price, (2) gross profit, or (3) contribution (gross) margin. An activity-based accounting system prioritizes products based on activity-based gross profit for each product. TA uses explicit recognition of an internal constraint when prioritizing products. One of the most familiar TOC formulas used to determine the best product mix when demand is greater than production capability (an internal constraint exists) is throughput per unit of constraint time. Accountants will have learned this concept under the name contribution margin per unit of constraint, which is recommended to determine product priorities when an organization faces a single constraint.16 This process most easily is illustrated with an example. Figure 13-1 is adapted from the original "P-Q" example developed and presented by Eli Goldratt in numerous workshops all over the world and in one of his books (Goldratt, 1990, Chapter 12). Rather than two products, Fig. 13-1 has three products, but the basic idea of a stable environment with no significant uncertainties is the same. Given Fig. 13-1 and some basic information as shown in Tables 13-1 and 13-2, a TOC-trained person can compute the optimal product mix (Product Z, then Product X, then Product Y) and expected operating income in a matter of minutes.
16
If an organization has more than one constraint, the typical accounting recommendation is to use linear programming to find the best product mix. This material frequently is skipped by accounting professors.
14
RM # 1 $20 / unit
RM # 2 $20 / unit
RM # 3 $20 / unit
Res. 1 , Task 1 5 min
Res. 3, Task 1
Res. 4 Task 1
5 min
10 min
Res. 2, Task 1 10 min
Res. 1 , Task 2
Res. 2, Task 3
5 min
10 min
Res. 4, Task 2 5 min RM # 4 $30 / unit
Product X
Res. 2, Task 2
Res. 3, Task 2
10 min
5 min
Product Y
RM # 7 $5 / unit RM # 5 $20 / unit
RM # 6 $20 / unit
Res. 1, Task 3
Res. 4, Task 2
15 min
10 min
Res. 2, Task 4
Res. 3, Task 3
5 min
10 min
FIGURE 13-1
Product Z
Product Flows Through Resources for a Simple Company
Three elements in Fig. 13-1 have darker outlines because their output is required in more than one product. Resource 1, task 2, and Resource 2, task 3 produce a common component from Raw Material #3 that is used in both Product X and Product Y. Figure 13-1 shows a production view (combining both bills of materials [BOMs] and routings for items flowing through the facility) of the organization's operations where each of the four resources can perform different tasks. A typical accounting view would show the materials flowing through four stationary resources.
15 Table 13-1 Demand, Selling Prices, and Variable Costs Product
Units Demanded per Week
Selling Price
X
90
$300.00
Variable Mfg. Overhead (VMOH) $8.00
Y
50
$260.00
$5.00
$22.00
Z
80
$195.00
$2.00
$15.00
Variable Sales Commission (VSC) $32.00
Table 13-2 Additional Information Item Resources 1, 2, 3, and 4
Availability or Cost per Week Each resource available 2400 min per week (total of 9600 min per week)
Wages (shared among all products)
Cost of $4,800 per week
Fixed (shared) manufacturing overhead
Cost of $7,200 per week
Fixed (shared) general, administrative, and selling overhead
Cost of $5,612 per week
Within 5 minutes, most people familiar with TOC concepts recognize that Resource 2 does not have sufficient capacity to produce all units demanded and therefore would compute the Throughput (contribution margin) per minute required of Resource 2 as follows: Product X: $300 – $60 materials – $8 VMOH – $32 VSC = $200/(20 min of Res. 2) = $10.00/min Product Y: $260 – $50 materials – $5 VMOH – $22 VSC = $183/(20 min of Res. 2) = $9.15/min Product Z: $195 – $45 materials – $2 VMOH – $15 VSC = $133/(5 min of Res. 2) = $26.60/min Therefore, product priority would be Product Z, then Product X, then Product Y. Weekly income would be computed as $12,858 (total throughput—or contribution margin—of $30,470 minus total fixed costs of $17,612), using all 2400 minutes of Resource 2.17 Following reasonable assumptions,18 the traditional gross profit or gross margin approach would result in first priority going to Product Y, then X, then Z. (See a complete list of 13 assumptions, some of which we will not need for the examples in this chapter, in a spreadsheet, "Throughput_Example,"19 Similarly,
17
The 80 units of Product Z would require 400 minutes on Resource 2, the 90 units of Product X would use 1800 minutes, and 10 units of Product Y would use the final 200 minutes. In reality, capacity usage would not be scheduled at 100 percent, but a lower capacity availability for all resources would not change the essential results presented here. 18 For example, labor allocated according to minutes spent on each product; fixed manufacturing overhead allocated based on total variable manufacturing costs, only whole units may be sold. 19 Located as a supplement to this chapter.
16 ABC20 would result in gross profit priorities of Product X, then Y, then Z. Table 13-3 compares the operating income (for simplicity, taxes are ignored) for four methods (Throughput, traditional, traditional contribution margin, and ABC). Table 13-3 Operating Profit Resulting from Various Accounting Priorities
Throughput (Z, X, Y)—constraint recognized and exploited
Operating Income $12,858
Traditional Gross Profit (Y, X, Z)—constraint not recognized
$ 5,538
Traditional Contribution Margin (X, Y, Z)—constraint not recognized
$ 5,878
Activity-Based Cost (X, Y, Z)—constraint not recognized
$ 5,878
Method
Once the best product mix is determined, a formal master budget can be prepared.
Preparing a Throughput Budget Throughput budgeting would follow the same general flow as that described in the section on traditional budgeting, but with conscious consideration of a possible internal constraint. The budget preparation process best proceeds when production provides the following data: (1) BOM for each product; (2) routing for each product; (3) prioritized expected sales of each product; (4) required inventory sizes; (5) available resource capacities, and (6) proposed acquisition of land, buildings, or equipment during the period. With an internal constraint, the budget process would begin with the estimated production of the most profitable product mix (in units), and consideration of constraint availability. Then estimated sales (in units and in total revenues), production costs, and all other elements of a traditional budget would be prepared. Following preparation of the cash budget, the income statement would be prepared in two formats: the direct costing format used by Throughput accounting21,22 and the traditional GAAP format (revenues minus cost of sales, subtotaled into gross profit, minus general, selling, and administrative expenses to find operating profit). [See a complete treatment of throughput budgeting in Bragg (2007b, Chapter 5).] The Throughput budget would be used for planning purposes only, and not for control as traditionally practiced.
Throughput Control TOC maintains that three straightforward metrics—Throughput, sales revenue minus all variable costs (manufacturing and general, selling, and administrative), Inventory (or Investment), the funds an organization has expended to be in position to produce, and Operating Expenses, the repetitive expenditures a company must incur each period in order keep the company operating—are all the measures needed for 20
Three pools, Planning, Processing, and Support, along with individual drivers, are used to allocate all costs to products and arrive at total product profit per unit as shown in cells G128-J135 of the "Throughput_Example" spreadsheet located as a supplement to this chapter. 21 Revenues minus variable cost of sales, minus other variable expenses (general, selling, and administrative), to show Throughput (contribution margin or gross margin), minus Operating Expenses (fixed costs) to arrive at operating income before income tax expense. 22 See a complete illustration of the Throughput format in the second spreadsheet of the file entitled "InventoryReductionExample" located as a supplement to this chapter
17 day-to-day operating decisions (Goldratt and Cox, 1984). These three metrics have occupied space in every cost and management accounting textbook, under slightly different names, since at least the 1960s (Dopuch and Birnberg, 1969). Different definitions of terms undoubtedly have caused much confusion. While it may be impossible, at this late date, to change TOC terminology, people trained in accounting call Throughput by the name contribution margin,23 with the same definition—revenue minus totally variable costs. Inventory is a highly controllable subset of Investment in total assets. Operating Expenses, in accounting terminology, would be fixed costs, including manufacturing fixed costs and general, selling, and administrative fixed costs.
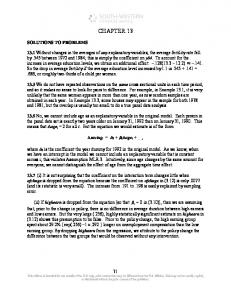
Where to Focus Quality Improvements The same example shown in Fig. 13-1, along with identification of the internal constraint (Resource 2) can be used to focus quality improvements. Assume the company experiences a scrap problem at Resource 4 resulting in 4 percent of units (3.6 units) of Product X being scrapped, 7 percent (0.7 units24) of Product Y, and 8 percent (6.4 units) of Product Z (see Fig. 13-2). The quality team can correct the problem on only one product at a time, the cost being approximately equal for each product. Which product should they work on first? Product and Planned Production RM # 1 $20 / unit
Res. 1, Task 1
4% Scrap
5 min
Res. 3, Task 1
Res. 4 Task 1
6 min
10 min
3.6 units
RM # 2 $20 / unit
Res. 2, Task 1
RM # 3 $20 / unit
Res. 1 , Task 2
Res. 2, Task 3
4 min
10 min
10 min
7% Scrap Res. 4, Task 2 6 min
RM # 4 $30 / unit
Res. 2, Task 2
Res. 3, Task 2
10 min
6 min
RM # 7 $5 / unit RM # 5 $20 / unit
Product X 90 units
Product Y 10 units
0.7 units
8% Scrap
Res. 1, Task 3
Res. 4, Task 3
15 min
10 min
Product Z 80 units
6.4 units RM # 6 $20 / unit
Res. 2, Task 4
Res. 3, Task 3
5 min
10 min
FIGURE 13-2
23 24
Scrap problem at Resource 4
See the section on direct or variable costing income statements, which contain all the elements of a Throughput income statement. Only 10 units of Product Y are planned for production, therefore 10 x .07 = 0.7.
18 Provided the quality problem data shown in Fig. 13-2, most people immediately select Product Z for first attention because (1) it has the highest percentage of scrap, (2) it has the most units being scrapped, or (3) it is the company's most profitable product. With traditional accounting, even if the cost of the time lost (45, 35, and 40 min, respectively, for Products X, Y, and Z), at $0.50 per minute25 is included in the analysis, along with the cost of materials ($60, $50, and $45 for Products X, Y, and Z, respectively) and variable manufacturing overhead ($8, $5, and $2 for Products X, Y, and Z, respectively), the priorities remain Product Z (with a total cost of $428.80), then Product X (total cost of $325.80), and then Product Y (total cost of $50.75). Because there is sufficient time to replace the work lost on Resources 1, 3, and 4, however, the Throughput approach includes lost variable costs (materials and variable manufacturing overhead) plus the cost of lost time only on Resource 2. Units lost of Products Z and X will be replaced, resulting in fewer units of Product Y being produced and sold. First, we safely may ignore the option of fixing the quality problem on Product Y because only 1 unit is lost per week, leaving only Product X and Z for improvement consideration. Since only whole units may be sold, if the quality problem on Product Z is corrected first, Product X's remaining quality problem will result in 4 fewer units of Product Y being produced and sold. Product X production losses will be replaced, but 80 min (4 units × 20 min) on the constraint (Resource 2) will have been lost. Thus, after Resource 2 has been used to produce 80 units of Product Z (still the best product, requiring 400 min) and 90 units of Product X (the next-best product, requiring 1800 min), leaving only 120 min to produce and sell 6 units of Product Y, resulting in operating income of $12,126. However, if the quality problem on Product X is eliminated first, Product Z's remaining quality problem will result in 7 units having to be replaced, at 5 min per unit, meaning 35 min of Resource 2's time will be lost, leaving 2,365 min available. Once again, 80 units of Product X, requiring 400 min on Resource 2, and 90 units of Product Z, requiring 1800 min on Resource 2, leave 165 Resource 2 minutes available for the production and sale of Product Y. With 165 min available, 8 complete units of Product Y [(165 min)/(20 min per unit)] can be produced and sold. With this product mix, operating income will be $12,492, $366 higher than if the quality problem is fixed first on Product Z. While looking only at the relevant minutes lost on each product, multiplied by Product Y's Throughput (contribution margin) per minute of Resource 2 production time, plus the variable costs involved will provide the same answer (fix the quality problem at Product X first, then go to Product Z's problem). This short-cut method (see the Throughput_Example spreadsheet, AR29:AZ48) risks failing to consider all variables. The total effect on operating income (shown in cells AQ50:BB69 in the Throughput_Example spreadsheet) is by far the safer method and the one recommended by experts.
Adding a New Market Segment The Throughput solution often has been compared with a linear programming solution of a one-constraint
25
Total weekly wages of $4,800, divided by 9,600 (40 hr × 60 min × 4 resources) total labor minutes. This is the actual cost of labor per minute; the traditional applied rate of $0.53333 is based on expected production matching demand.
19 problem (Dopuch and Birnberg, 1969) and often has been described as a step-wise linear programming analysis, dealing with one constraint (the worst one) at a time. Unfortunately, the Throughput solution, like a linear programming solution, is extremely sensitive to deviations from an equilibrium solution, one in which a best solution is found using current assumptions concerning resource availabilities, product demand, and so forth. For example, suppose a salesperson returns from China with an order for 30 units a week for each of the three products, X, Y, or Z, or any combination thereof, with agreed selling prices equal to 80 percent of the U.S. prices. Should the company sell any of its products in China? Facing this decision, the company must be very careful not to make the easiest of mistakes: assuming the constraint will not shift to another resource.26 After computing Throughput per minute of Resource 2 for each of the three potential China products, suppose the company decides to sell 30 units of Product Z in China (called China Z in the spreadsheet) with a Throughput per minute of Resource 2 of $18.80 ($156 – $62 = $94 ÷ 5 min on Resource 2), prior to filling orders for Products X and Y, and will not be interested in selling Product X (China X, with a Throughput of $7/min) and Product Y (China Y, with a Throughput of $6.55/min) in China. Following this strategy, however, will cause the company not to make a higher total profit ($14,214), as it expects, but to make $12,448—$1,766 less than expected—and $410 less than its previous best performance with no sales to China. The deterioration in operating income will occur due to Product Z's (and, therefore, China Z's) high usage of Resource 1, causing it to be in tighter supply and resulting in an interactive constraint with Resource 2. (See "Throughput_Example" spreadsheet, cells BD2:BS82.) Controls should be in place to prevent actions that will reduce operating income. The following examples illustrate how traditional accounting can lead to non-optimal decisions.
Purchasing Decisions Even though materials are not often an organization's constraint, rapid expansion in 2007 and 2008 saw raw materials prices skyrocket. Of course, the recession in late 2008 and 2009 brought material costs back in line. When materials prices change, Throughput and Throughput per unit also change. Therefore, product priorities also may change. In a TOC world, any time any Throughput metric input changes, its impact on priorities must be computed. Less obvious purchasing decisions involve opportunities to acquire materials from a lower-cost supplier or to outsource certain portions of the productive effort. Potential acquisition errors can occur based on both accepting and rejecting outsourcing proposals as well as on initial material purchases. Each of the following decisions should be considered independently. That is, the starting point is the current most profitable combination of 80 units of Product Z, 90 units of Product X, and 10 units of Product Y.
Acquisition Decision Purchasing has found a new supplier who is willing to provide Raw Material #7, for $2.50, saving the
26
This problem originally was pointed out in Goldratt (1990, 97-99).
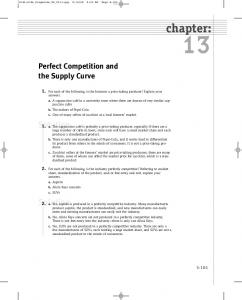
20 company $200 a week. Figure 13-3 illustrates this opportunity. If Purchasing primarily were evaluated based on cost savings, they would like to make the deal. After trying a sample of the new material, however, the production manager states that Resource 4, Task 3 will incur approximately 10 percent scrap. Since Resource 4 has plenty of idle time, Purchasing assures the production manager, they easily can make up the 80 min lost due to scrap. Further attempting to seal the deal, the purchasing person tells the production manager that since Resource 4's utilization will increase, efficiencies may increase, offsetting any scrap. RM # 7 $5 X $2.50/unit RM # 5 $20 / unit
Res. 1, Task 3
Res. 4, Task 3
15 min
10 min
RM # 6 $20 / unit
Res. 2, Task 4
Res. 3, Task 3
5 min
10 min
FIGURE 13-3
Product Z
Proposed acquisition of a cheaper material
The production manager, having been trained in TOC concepts, states (not too patiently) that since the scrap occurs following processing on the constraint (Resource 2), each lost minute on Task 4 means that fewer units of other products can be produced and sold. Additional materials will be processed to make sure all demand for Product Z will be filled, so the lowest priority product, Product Y, will take the hit. Because Resource 2, Task 4 requires 5 min of processing time per unit, 40 min of Resource 2 time (8 units × 5 min) will be lost. Because Product Y requires 20 min per unit on Resource 2, two units of Product Y will be eliminated (at $183 throughput per unit). Therefore, this material cost "savings" of $200 will cost the company $36627 in lost Throughput every week! (See the original "best" operating income versus the operating income if the proposed change were accepted in the Throughput_Examples spreadsheet, cells BV1:CF40.) This "opportunity," if accepted, would result in a decrease in operating profit of $166 ($366 – $200) each week. Fortunately, the production manager rejected this "cost-saving" proposal.
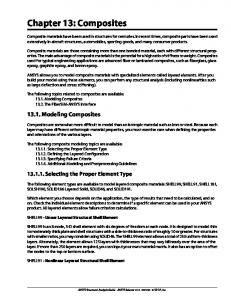
Outsourcing Proposal #1 Suppose another person in purchasing has received an offer from a new supplier to provide a component that will include Raw Material #1 and processing through Resource 1 for a cost of $21.75. No variable overhead is incurred for this operation. Should the offer, shown in Fig. 13-4, parts a (make) and b (buy), be accepted? Traditional accounting would say, "Absolutely." The unit cost through that point in production is $22.67 ($20.00 for the material and $2.67 for 5 min of processing at a cost of $0.5333 per min); resulting
27
[$183 Throughput (contribution margin) for Product Y] × 2 units = $366.
21 in a savings of $82.80 each week ($0.92 a unit times 90 units) or over $4,100 each year.28 Current RM # 1 $20 / unit
Res. 1, Task 1 5 min @$0.5333 = $2.6667
Res. 3, Task 1
Res. 4 Task 1
6 min
10 min
Res. 3, Task 1
Res. 4 Task 1
6 min
10 min
Product X
Proposed Buy: $21.75 / unit
FIGURE 13-4
Product X
Product X, Resource 1, Task 1 – make versus buy decision
However, TA would respond, "No way!" Resource 1 is not a constraint and already has 50 min of unused time each week.29 Accepting this outsourcing offer would result in incurring an additional cost of $1.75 a unit ($21.75 – $20) for the 90 units needed—$157.50 each week;30 about $8,000 a year. Meanwhile, Resource 1 would incur additional idle time of 450 min each week. In addition, the company would lose direct quality control and incur the risk of unavailability of the component when needed. Of course, traditional accounting would respond that Resource 1 should be put on a 4-day workweek since they now have over 8 hours of idle time. Sometimes this makes sense, but not normally. Cutting the pay, effectively, of one worker does not inspire high worker morale and job commitment. In addition, Resource 1 is the most likely constraint candidate should Resource 2 capacity's be elevated. Outsourcing materials and Resource 1 work, in the situation described, would not be a good decision.
Outsourcing Proposal #2 Purchasing also has an offer from a supplier to provide a component that would include Raw Material #3 and processing by Resource 1 and Resource 2 for a cost of $40. Variable manufacturing overhead for the operations involved is $2.50 a unit. Figure 13-5a shows the current arrangement, and Fig. 13-5b shows the "buy" proposal. Should the company accept the offer?
28
Note that many companies using traditional costing also (incorrectly) would include savings in fixed overhead costs that will merely be transferred to other products. 29 See the "Total Time Used/Week" schedule—P27:U33—in the Throughput Example file located as a supplement to this chapter. 30
See Throughput_Examples spreadsheet located as a supplement to this chapter, cells CH1:CO40.
22
Current
RM # 3 $20 / unit
Res. 1, Task 2
Res. 2, Task 3
4 min @ $0.5333
10 min @ $0.5333
Proposed
Res. 4 Task 1
Product X
Res. 4, Task 2
Product Y
Res. 4 Task 1
Product X
Res. 4, Task 2
Product Y
Buy: $40.00 / unit
FIGURE 13-5
Product X and Y, Resource 1, Task 2 and Resource 2, Task 3 – make versus buy
Traditional accounting would say, "No." The cost to make is only $29.97 ($20 for the material, $7.47 for the labor—14 min at $0.5333,31 plus $2.50 variable overhead). Buying the proposed component would increase the company's costs by over $10 per unit and $1,00032 each week. Rather than comparing costs, however, a person who is aware of TA would look at the impact on the company's Throughput. Resource 2, Task 3, requires 10 min. Recall that the constraint in this system is Resource 2. Saving 10 min of Resource 2 time on Product X (90 units) and Product Y (10 units) amounts to 1000 extra minutes. With the extra time, additional units can be produced for the unfilled demand of Product Y. All unfilled demand for 40 units of Product Y can be produced and sold, adding an additional $183 per unit for a total of $7,320 additional Throughput, and adding $4,520 to the bottom line ($7,320 – $2,800—the added cost of outsourcing 140 units33 at $20 incremental cost). Compared to the example company's previous best performance of $12,858, this change represents about a 35 percent increase.34 Even if the company incurs additional overhead to track the supplier's quality and dependability, the outsourcing (buy) offer should be enthusiastically accepted. In addition, everyone in the company should be made aware of the fact that marketing is now the organization's constraint and management should formulate plans to increase the capacity of both Resource 2 and Resource 1 when product demand increases.
Engineering Change Proposals (ECPs) Engineers have been studying production operations and two new engineers have submitted engineering 31
Accountants customarily carry costs to four significant digits to the right of the decimal so that aggregated totals from computing costs for many units will be more precise. For a more in-depth look at this issue, see Eden and Ronen (2007). 32 $40 – $29.97 $10; $10 × 100 units (90 for Product X and +10 for Product Y) = $1,000. 33 90 units for Product X and 50 units for Product Y. 34 See Throughput_Examples spreadsheet located at www.mhprofessional.com/TOCHandbook, cells CQ1:CZ40.
23 change proposals (ECPs).
First Engineer's ECP A young engineer has read about a new process that can reduce the time on Resource 1, Task 3, from 15 to 5 min (see Fig. 13-6). New tooling costing $5,000 would have to be acquired, however. Should the proposal be accepted? Cost: $5,000 RM # 7 $5 / unit
Res. 1, Task 3
RM # 5 $20 / unit
Res. 4, Task 3
15 min 5 minutes
RM # 6 $20 / unit
10 min
Res. 2, Task 4
Res. 3, Task 3
5 min
10 min
FIGURE 13-6
Product Z
First engineer’s engineering change proposal
Traditional accounting typically would value this opportunity as favorable since saving 10 min on 80 units would produce a savings of 800 min. At the applied labor rate of $0.5333 (or the actual rate of $0.50), cost savings would total $426.64 or a minimum of $400 a week. Thus, payback would occur in $5,000/$400 = 12.5 weeks, at the longest. This is a very quick return on investment (ROI). Of course, traditional accounting information provides support for an incorrect decision. Resource 1 is not the constraint and the "cost savings" of $400 or more per week would never occur. Resource 1 would just have more idle time and the company would be out $5,000 for the tooling. TA correctly and immediately would reject this proposal.35 Because Resource 1 might someday become a constraint (it has the highest loading after Resource 2, the current constraint), this proposal might be kept on file for action later, but not now.
Second Engineer's ECP Another engineer has submitted an ECP affecting Product X and Product Y. Figure 13-7 shows three changes: (1) an increase in materials cost from $20 per unit to $30, and (2) a 2-min decrease on Resource 2, Task 3, and (3) an increase from 4 min to 9 min for final processing of Product Y by Resource 4, Task 2. Oh, and the change will require an additional $8,000 investment.
35
Operating income would drop from $12,858 to $7,858, a decrease of $5,000, the cost of the change. See Throughput_Examples spreadsheet, cells BV47:CF82 located as a supplement to this chapter.
24
Cost: $8,000
Res. 4 Task 1 10 min
RM # 3 $20 $30 / U
Res. 1 , Task 2
X
4 min
Res. 2, Task 3 10 min 8 minutes
Res. 4, Task 2 6 min 9 minutes
RM # 4 $30 / unit
Res. 2, Task 2
Res. 3, Task 2
10 min
6 min
FIGURE 13-7
Product X
Product Y
Second engineer’s engineering change proposal
Of course, the accounting department is shocked by the $10 increase in material cost and the 3-min increase in net processing time for Product Y (from 35 to 38 min) that is partially offset by the 2-min decrease in Product X processing time. Considering the additional investment required, accounting might even suggest that this engineer should work for a competitor. By now, you know that since Resource 2 is the company's current constraint, this change should be evaluated further using TA concepts. Saving only 2 min on Resource 2, Task 3, for 100 units (90 for Product X and 10 for Product Y) means an additional 200 min of availability but costs an additional $1,000 in raw material cost ($10 per unit × 100 units for the original quantities) in addition to the $8,000 investment. With this additional time, however, more units of Product Y can be produced and sold. How many additional units are possible? Not 10 (200/20), but 11 (200/18). With an original Throughput per unit of $183, 11 additional sales of Product Y will bring in $2,013 each week. This amount, minus the $1,000 in additional cost for Raw Material #3, means an additional $1,013 in operating profit. Resource 4 has sufficient available time not only to use 9 min of processing time on the 11 additional units, but for the entire market demand of 50 units. The payback period for this investment would be $8,000/$1,013, or less than 7.9 weeks. Assuming the cost of the investment can be amortized over 52 weeks, operating income will increase by $3,986 each week.36 This is a great investment, but it would have been turned down using traditional accounting metrics!
The Problem of Identifying Decision-Relevant Costs and How to Avoid a Disaster Throughput (contribution margin), Inventory (investment), and Operating Expense (fixed costs) changes are always relevant. However, it is extremely difficult to accurately select the relevant costs and revenues (including those associated with lost opportunities) of many, if not most, management decisions. For example, when multiple changes are occurring to more than one element of a process (the second engineering ECP is an example), keeping everything straight for a correct analysis can be difficult. The advice provided throughout the book, Supply Chain Management at Warp Speed (Schragenheim, Dettmer, and Patterson, 2009), is to consider any change (product mix, investment, make versus buy, special orders, rationalization of product lines, etc.) in terms of its impact on total amounts of Throughput, Inventory, and 36See
Throughput_Examples spreadsheet, cells CH47:CP82 located as a supplement to this chapter.
25 Operating Expenses (contribution margin, investment, and fixed costs, in accounting terminology). This same advice, couched in terms of the dangers of allocating fixed costs, is included in virtually every cost and management accounting textbook (see, for example, Garrison et al., 2010, 588–589; Hilton, 2009, 600–601, 612), and should be followed without exception to avoid costly errors.37
Inventory Changes and GAAP Accounting Basic goals of TOC are for Throughput to increase, Inventory to decrease, and Operating Expense to decrease. Throughput increases and expense decreases will be reflected favorably on external reports that conform to GAAP. Inventory reductions, however, will be reflected unfavorably on GAAP statements by reducing both assets and operating income. Therefore, inventory reductions should be handled with special care. Because some accounting and other people have trouble understanding exactly how reducing inventory results in decreased income, I have developed several examples over the years to validate this result. For example, assume a company that has no beginning inventories of WIP or finished goods, produces 20,000 units and sells 15,000 units for $20 each. There is no ending WIP inventory. Budgeted costs (as traditionally prepared) include the following: Cost Item Direct materials Direct labor Var. mfg. OH Fixed mfg. OH Total product cost per unit Var. sell. and admin. Fixed sell. and admin. Total costs incurred
Details Total 40,000 units @ $1 $ 40,000 2,500 hours @ $10 25,000 4,000 machine hours @ $5 20,000 4,000 machine hours @ $20 80,000 30,000 75,000 $270,000
Per Unit $ 2.00* 1.25* 1.00* 4.00* $ 8.25 2.00** 5.00**
*Based on 20,000 units produced **Based on 15,000 units sold
A traditional (absorption costing) income statement and a Throughput (variable or direct costing) income statement (both assuming costs are the same as those projected) are shown in Fig. 13-8.
37
While recent cost and management accounting texts acknowledge TOC, attempt to define it, and recognize its connection to the contributionmargin-per-unit-of-constraint decision, they do not address the impact of a constraint on numerous other operating decisions such as make versus buy, adding or dropping product lines, or special orders.
26 Throughput Income Statement
Traditional Income Statement Revenues (15,000 units @ $20)
$ 300,000
Revenues (15,000 units @ $20)
$300,000
Variable costs
Cost of Goods Sold Beginning finished goods Direct material used Direct labor (all variable) Variable mfg. overhead Fixed mfg. overhead Total cost of goods mfg.d Ending finished goods*
– 0– $40,000 25,000 20,000 80,000 $165,000 41,250
Gross margin
123,750 $ 176,250
Selling and Administrative Expense Variable Fixed
$30,000 75,000
Net operating income
Beginning finished goods –0– Direct materials $ 40,000 Direct labor (all variable) 25,000 Variable mfg. overhead 20,000 Var. cost of goods mfg.d $ 85,000 Ending finished goods∗∗ 21,250 Variable sell. and admin. Total variable costs
$ 93,750
Throughput (Contribution Margin) 105,000 $ 71,250
$ 63,750 30,000
$ 206,250
Fixed costs Manufacturing Labor?
$ 80,000
(if fixed, the $25,000 would be here)
Selling and Administrative
75,000
$155,000
Net operating income
∗ 5,000 units @ $8.25 (variable and fixed manufacturing costs)
FIGURE 13-8
$ 51,250
∗∗ 5,000 units @ $4.25 (only variable manufacturing costs)
Traditional and Throughput income statements
As shown in Fig. 13-8, the traditional income statement shows net operating income of $71,250, while the Throughput income statement produces net operating income of only $51,250. The difference of $20,000 ($72,250 – $51,250) can be reconciled solely by the change in inventory fixed costs. That is, the increase of 5,000 units in finished goods times the fixed manufacturing cost of $4.00 per unit equals the $20,000 increase in traditional (GAAP) income over the Throughput income of $51,250. A more detailed example involving materials and WIP changes, as well as changes in finished goods, can be found in a spreadsheet entitled "InventoryReductionExample" located as a supplement to this chapter. C:\Users\Charli\Documents\TOC\Jim Cox\Accounting Material\www.mhprofessional.com\Cox,Schleier\Chapter14 In this example, everything other than WIP inventory and finished goods (FG) inventory are held constant over a 4-year period. Year 1 sets up a baseline performance, the resulting income, and balance sheet. With no changes in inventories (Year 1), both methods (traditional and Throughput) produce the same net income before income taxes. WIP and FG inventories then are reduced by 50 percent in Year 2. Three spreadsheets are included in this file: "GAAP Accounting," "Throughput(Variable) Accounting," and "Reconciliation of GAAP & T. Inc". In the example, a normal year (Year 1) GAAP income is $200,000 and return on sales is 10 percent. The 50 percent WIP and FG inventory reductions occur in the second year (Year 2) and GAAP income drops to $66,667 and return on sales drops to 3.33 percent. (See the "GAAP Accounting" spreadsheet, cells A48:Y80.) The third year, following the reduction, GAAP return on sales recovers to 6.67 percent (cells A83:Y114) with income of $133,333, but is not back to the full 10 percent (income of $200,000) until Year 4 (A116:Y147).
27 The reduced income occurs because, with traditional (GAAP) accounting, WIP contains a portion of fixed manufacturing costs, depending on the percent complete, and FG contains its fair portion (100%) of full fixed manufacturing costs. In the environment established in this example, the only way to reduce inventory is to cease entry of raw materials into the system.38 The decrease in production activity required to lower inventories means that all fixed costs of the current period, plus the fixed costs in units in beginning FG and WIP, are charged to cost of sales in the inventory reduction year. The TA approach, shown on the second spreadsheet of the "InventoryReductionExample" shows that income and return on sales for the entire 4-year period remain constant at $200,000 and 10 percent, respectively. The third spreadsheet in the example file reconciles GAAP and Throughput income for the year of the inventory reduction and suggests general journal entries to adjust from internal Throughput reporting to external GAAP statements. Table 13-4 shows the reconciliation followed by the general journal entries. Because the inventory reduction is permanent, other things remaining equal, reported GAAP income would remain $200,000 less than that reported under TA.39 Given that this inventory reduction permits the opportunity to increase future earnings (lower WIP means faster processing that permits additional production with no increase in fixed costs), the potential "sacrifice" in reported earnings is necessary and must be undertaken. Careful planning and communication with relevant stakeholders, especially employees, creditors, and owners, can minimize potential negative effects. Table 13-4 illustrates how the difference between GAAP income of $66,667 and Throughput income of $200,000 in Year 2 (a difference of negative $133,333) may be explained totally by the change (reduction) in fixed costs in beginning and ending WIP of $53,333 plus the change (reduction) in fixed costs in beginning and ending FG of $80,000. Following Table 13-4 are all the year-end adjusting general journal entries to convert all income and balance sheet accounts from Throughput to GAAP. This example clearly indicates that keeping accounting records using Throughput concepts during a period quite easily can be converted to GAAP accounts at the end of a period.
38 39
Boeing has used this approach upon occasion to clean up its WIP inventory (Henkoff, 1998; Skapinker, 1998). Since it is merely a timing issue, if inventory ever increases back to original amounts the income discrepancy will disappear.
28
Table 13-4 Reconciliation of Traditional (GAAP) Costing Operating Income and Throughput (Variable) Costing Operating Income for Year of Inventory Reduction Traditional Costing (GAAP) Income, Year of Inventory Reduction: $ 66,667 Throughput (Direct or Variable) Costing Income, Year of Inventory Reduction Total difference to be explained
200,000 $(133,333)
Difference explained by change in fixed costs in inventories: Beginning WIP Materials Labor Manufacturing overhead
Ending WIP Materials Labor Manufacturing overhead
Variable Costs
Fixed Costs
Totals
$240,000 $4,000
$16,000
$240,000 $20,000
$16,000
$144,000
$160,000
$260,000
$160,000
$420,000
Variable Costs
Fixed Costs
Totals
$120,000 $2,000 $8,000
$10,667 $96,000
$120,000 $12,667 $104,000
$130,000
$106,667
$236,667
Change in fixed costs in WIP Inventory ($160,000 – $106,667) Beginning FG Materials Labor Manufacturing overhead
Ending FG Materials Labor Manufacturing overhead
Variable Costs
Fixed Costs
= $53,333 Totals
$180,000 $6,000 $24,000
$24,000 $216,000
$180,000 $30,000 $240,000
$210,000
$240,000
$450,000
Variable Costs
Fixed Costs
Totals
$90,000 $3,000 $12,000
$16,000 $144,000
$90,000 $19,000 $156,000
$105,000
$160,000
$265,000
Change in fixed costs in FG Inventory ($240,000 – $160,000) Total Change in Beginning and Ending Inventory Fixed Costs (Income differences fully explained)
= $80,000
$133,333
29 End of period adjusting entries to convert from throughput to GAAP accounting: WIP
106,667
FG
160,000
Fixed selling, general, and administrative expenses and production fixed costs
266,667
to adjust WIP and FG balances to their GAAP, fully absorbed, amounts Selling, general, and administrative expense
264,000
Fixed selling, general, administrative expenses and production fixed costs
264,000
to move fixed S, G, and A expense to its GAAP period account
Cost of sales Fixed Selling, general, and administrative expenses and production fixed costs
533,333 533,333
to remove remaining manufacturing fixed costs from the "periodic" expense account to cost of sales
Cost of sales
400,000
Deferred fixed manufacturing costs
400,000
to adjust cost of sales and close the deferred fixed manufacturing costs account
Value Metric Used to Track Performance To provide timely feedback to managers and operations personnel, TOC has some unique metrics that reveal both what should be done and what should not be done. These metrics support standard TOC policies and are designed to encourage appropriate behavior. Many use a TOC concept called value days that aggregates the value of amounts invested or delayed using the following formula: Vn = Vn-1 + Σ Value where
Vn = the value for a current time period (e.g., day or week) Vn-1 = the value for the previous time period
Σ Value = the total net value ($ in the US) invested or realized in the current period (e.g., days, weeks, months). This formula basically says that every amount of currency invested for a day results in a lost opportunity to use that amount for some other purpose, and every day the amount is not recovered repeats the lost opportunity. Therefore, the value is not fully recovered until sufficient amounts have been received to cover the entire deficit. The basic idea is to age investments analogous to the aging of accounts receivable.
Inventory Value Days For example, if $100 is invested in inventory on Day 1 and the inventory is not sold until Day 10, inventory value days would equal $100 × 10 days or $1,000. In this way, slow moving inventory is highlighted and the information provided encourages the quick sale of older inventory. It also provides a way to project demand
30 saturation so that additional units are not manufactured or acquired. With thousands of products, the process becomes more complex, but can be accomplished either with enterprise software or with spreadsheets. A one-product example that includes acquisitions and sales over a period of 33 days ("VALUE-FORMULAandEXAMPLES.xlsx," second spreadsheet, "Inventory Example") may be found as a supplement to this chapter. Figure 13-9, based on the spreadsheet example, shows the difference between the absolute amounts invested, as traditionally recorded (dark color) and inventory value days (lighter color). The rapid growth in inventory value days beginning on Day 23 signals management that inventory is building too rapidly and gives advance warning to cut acquisition of this item, which happened on Day 29. While the increase also is signaled by the traditional inventory values, upon close inspection, it is not nearly as noticeable and dramatic. $90,000 $80,000 $70,000 $60,000 $50,000 $40,000 $30,000 $20,000 $10,000 $0 1 2 3 4 5 6 7 8 9 10 11 12 13 14 15 16 17 18 19 20 21 22 23 24 25 26 27 28 29 30 31 32 33 34 Traditional Inven. Value
FIGURE 13-9
Inventory Value Days
Traditional inventory value versus inventory value days
Throughput Value Days The same file ("VALUE-FORMULAandEXAMPLES.xlsx") has a third spreadsheet, "Throughput Example," that illustrates how the same formula may be used to track orders that are delayed (missing from the critical area of a buffer for quality or other reasons or returned by the customer due to a quality problem).
Transfer Pricing Organizations regularly go through restructuring programs where they go from a centralized organizational structure, where divisions are cost centers and major decisions such as product selection, pricing, and investments are made at headquarters, to a decentralized structure, where divisions are profit centers or investment centers. As their names imply, a cost center is responsible only for controlling costs; a profit center has responsibility for generating revenues and controlling costs, and investment centers are encouraged to behave as entrepreneurs and are responsible for making investments, generating revenues,
31 and controlling costs. Organizations also regularly go through the process in a reverse direction: from decentralized profit and investment centers to centrally controlled cost centers. Top management would like to control all decisions (a centralized structure), but they realize that they are too far from the action to act sufficiently quickly to compete in a meaningful way. However, when organizations are decentralized, incorrigible transfer-pricing issues arise if any products are transferred from one division to another, which they usually are. Additional complications arise because division managers usually are in competition with each other. The selling division wants a higher price; the purchasing division wants a lower price. Transfers between divisions in different countries bring complex tax issues into the mix. Addressing transfer pricing in detail is beyond the scope of this chapter. However, if you are interested in a nice treatment of transfer pricing in a TOC context, without international transfers, I recommend, "The 'Transfer Prices' Problem,” in Approximately Right, Not Precisely Wrong (Eden and Ronen, 2007, 241–258).
Other TOC Metrics An ideal TOC operation has minimal fire fighting and expediting, no chaos or brutal overtime, and sufficient orders with reliable promise dates entering the system. In order to accomplish this desirable environment, it is critical that sufficient raw materials are on hand,40 minimal (but sufficient) WIP and FG inventories are held, orders are delivered on time, appropriate buffers are established, buffer penetration (consumption) is tracked, and performance is continuously improving. In addition to the previous metrics, some general measures that organizations have found useful include the following: • On-time deliveries—1 minus the ratio of late orders, weighted by days late, divided by total orders. • Throughput per employee—Throughput (revenue minus variable costs) divided by number of employees. • Inventory turns—Variable cost of sales divided by average Inventory held during the period.41 • Throughput per unit of Operating Expense—Throughput divided by Operating (fixed) Expenses. Of course, specialized industries have developed many other TOC metrics to provide feedback and control information in real time, or close to real time.
Sensitivity Analysis The same metrics used for Throughput control can be used to perform "What if?" types of calculations. Sometimes decisions must be made quickly without time for submission to another person or department for analysis. In order for operating people to be able to analyze a situation quickly, they need a simple-to40Quantities
of materials held should be a function of (1) frequency of supplier delivery, (2) company ability to reliably predict
consumption levels during supplier lead time, and (3) vendor reliability in meeting promised shipment dates and in meeting specified quality (Goldratt, 1990, p. 108). 41 Many TOC practitioners simply use Throughput/ Inventory, but the above formula more correctly matches the traditional definition of inventory turns.
32 understand method. For example, the same "value days" formula illustrated earlier for Inventory and Throughput control can be used to compare various possible investments. Four examples of $60,000 investment opportunities, each with different cash flows, are shown in the "Investment Examples" spreadsheet of the file "VALUE-FORMULAandEXAMPLES" (located as a supplement to this chapter). A "flush" point, where all value days' cash investments have been recovered, follows Goldratt's (1997, 246) development and is contrasted with payback period. For comparison purposes, net present value (NPV) calculations are shown alongside the value-days calculations. For short-term (less than one year) decisions, NPV does not change significantly when using discount rates ranging between 10 and 20 percent. While the decisions indicated by NPV match those of the value-days calculations for three of the investment opportunities, although with much less clear discrimination, in one example, NPV indicates an acceptable investment and the value-days analysis shows it is unacceptable. The rationale behind using value days rather than NPV is that investment amounts are constrained by availability, not interest rates.42
Throughput Accounting Approach to Performance Evaluation TOC is very much a team sport. Therefore, evaluation should be on a team basis. Individual evaluation should be in the form of mentor feedback for improvement, as indicated by a request from the individual involved or a supervisor. In the absence of a clear need, feedback provided to individuals should not be used to evaluate performance. If a team is downgraded due to performance of one or more individuals, the team is expected to correct the problem. One company in Austin, Texas, hires all employees on a temporary basis for three months. At the end of the trial period, the team meets and decides whether a permanent position is offered.
Possible Explanations for the Lack of TOC Literature in Accounting and Finance Three major reasons account for a dearth of TOC literature in accounting and finance. First, accounting students generally are not well trained in internal reporting and operations management. I believe that this may be because the Certified Public Accounting (CPA) professional examination has contained only about 10 percent of internal reporting material for a number of years. A new Content Specification Outline (CSO)43 for the CPA exam, effective January 1, 2011, contains updated requirements that include increased emphasis on management accounting and operations, including TOC.44 PhD students typically are not exposed to TOC, while MBA students at least are required to read The Goal (Goldratt and Cox, 1984). Second, there is no incentive for accounting and finance professors to spend time becoming proficient 42
Unavailability of credit was experienced by many businesses during the recession of late 2008, 2009, and the first part of 2010.
43Find
at http://www.nasba.org/nasbaweb/NASBAWeb.nsf/FNAL/CandidateBulletin?opendocument. Business Environment and
Content requirements begin on page 29. Accessed August 29, 2009. (Section VI, C, 5, page 33, states that candidate responsibilities include "Management philosophies and techniques for performance improvement such as Just in Time (JIT), Quality, Lean, Demand Flow, Theory of Constraints, and Six Sigma.") 44
The Certified Management Accountant examination sponsored by the Institute of Management Accountants also has updated its Content Specification Outline to include TOC and TA, effective May 1, 2010.
33 in TOC concepts because primarily they are evaluated and promoted based on their research publications in the recognized top quality (mostly theoretical) journals where, at least in the United States, "applied" articles generally are not welcomed.45 Bill Ferrar, recipient of the Lifetime Contribution to Management Accounting Award, has called for the teaching of TOC, but he suggests it could only occur by team teaching with a manufacturing engineering professor (Ferrara, 2007, 172). Third, there is little or no demand from business school constituencies that TOC concepts be taught to students. Auditing firms frequently make accounting departments aware of their desire to hire students schooled in certain topics, such as XBRL (eXtensible Business Reporting Language) and IFRS (International Financial Reporting Standards), but as yet there is little or no push from industry for accountants who have been trained in either TA or TOC. This should not be surprising since even firms that have adopted TOC typically do not include accounting and finance people in their training classes until improvement initiatives become accounting and finance targets for cost reduction.
Future TOC Accounting/Finance Research Needs There have been relatively few publications by accounting or finance writers relating their research and conclusions on the subject of TOC. The field is entirely open.
Case Studies and Simulations There is a desperate need for practitioners of TOC to partner with accounting or finance academics and publish case studies of their experiences, both good and bad, from a finance or accounting perspective, along with analysis of major factors that contributed to the success or failure of the initiative. It also would be most interesting to read a case of an accounting or finance area applying TOC concepts to their own operations. The quality and efficiency of accounting reporting systems also could be examined.
Information and Decision Making Accountants have a broad perspective of an organization. To provide increased value to an organization, accountants need to establish internal information systems that aid decision makers. There is a need for research on the decision-making process, the behavioral aspects of decisions, single versus multiple decision makers and the quality of decisions, and supply chain information and accounting.
Decision-Making Processes While accounting and finance personnel usually do not make operating decisions, they do guard the treasury and must approve acquisitions. Therefore, they must understand legitimate investment needs. It would be enlightening to see a rigorous study of short-term decisions, generally defined as decisions where the impact is experienced in one year or less and decisions must be made quickly, and long-term decisions where the decision time frame is longer and the impact is felt perhaps years later. What about the assumption that short-term decisions can affect (or become) the long term? Who typically receives credit
45
Numerous threads to this effect can be found in the archives of the AECM Web site (Jenson et al., 2009).
34 for long-term decisions where the cost is incurred much earlier? What really is needed is a TOC conceptual framework for management accounting similar to Concepts Statements46 provided by the Financial Accounting Standards Board (FASB) for financial accounting. That is, a TOC conceptual framework establishing desired information concepts would encourage an entire, internally consistent, reporting system including information objectives, decision support criteria, and periodic income statement reporting in a format that facilitates quick decisions by line managers as well as executive managers. A TOC conceptual framework would guide possible courses of action under various circumstances and promote the inclusion of the impact of decisions on external financial statements as well as on cash flows. Such a conceptual framework would guide the development of policies, procedures, and metrics to support a TOC environment.
Behavioral Aspects of Decisions Several aspects of the behavior of decision makers can be influenced by the motivation and reward structure established by an organization's performance evaluation system. A study of the unintended effects of performance evaluation and how to structure a system that does not encourage dysfunctional behavior47 such as that reported by Austin (1996) in Measuring and Managing Performance in Organization would be a significant contribution. Because TOC requires teamwork, should evaluation be made only on the team's performance? How can a team address conflicts in local measures early in a change process? Should a team evaluate individual team members? Are team decisions superior to ones made by individuals? Always? Are certain decisions best made by an individual? How should decisions be evaluated?
Supply Chain Accounting With all the changes being made in the structure and behavior of supply chains, it would be most interesting to see an accounting/finance solution to the problem of risk- and profit-sharing among all supply chain partners. Other issues, such as required quality, speed, and who benefits from reduced costs or other improvements, also need to be addressed. Part of the charge for management accounting includes providing a comprehensive internal information system. During the recent global recession, supply chain partners several steps away from the final customer were shocked when markets suddenly dried up with no warning. Sometimes a supply chain member did not even know the final use of their component (Dvorak, 2009). The communication and presentation of information, both frequency and mode, merits further study.
Summary and Introduction of Remaining Chapters in This Section Chapter Summary To explain our current accounting and finance environment, the first part of Chapter 13 describes a short 46
The seven FASB Concepts Statements may be found at the following web site: http://www.fasb.org/jsp/FASB/Page/SectionPage&cid=1176156317989, accessed March 20, 2010. 47
See Chapter 14 in reference to dysfunctional behavior caused by local measures.
35 history of cost accounting and the massive changes in the business environment during the 20th century. Management accounting's response, while lagging changes in business, includes the development of direct (variable or contribution margin) income statements to more closely tie income to sales, activity-based costing to more "accurately" trace all costs to cost objects (products), balanced scorecards to stress the importance of non-financial metrics, Lean accounting to match the value stream flows in manufacturing, and updated budgeting concepts that permeate all of these methodologies. Both the advantages and disadvantages of these approaches are reviewed. The remainder of the chapter covers TOC concepts of planning, control, and sensitivity analysis. Figure 13-1 establishes a simple example that is used to demonstrate both planning and control concepts. The negative impact of inventory reduction on GAAP accounting income is demonstrated and compared with TA results. Throughput value days is discussed and applied to inventory control, delayed Throughput, and potential investments. Additional TOC metrics are mentioned. Three files containing multiple spreadsheets, available online, provide supporting data for examples used in the chapter. Finally, the chapter addresses possible reasons for the lack of TOC literature in accounting and finance and issues a call for further research.
Other Chapters Dealing with Performance Measures In Chapter 14, Debra Smith and Jeffrey Herman further describe desirable logistic measurements and demonstrate a framework to pull required information from an operation. They use TOC TP tools to defuse conflicts and deal with potential negative outcomes before they occur. A nice case study shows the application of these elements. In Chapter 15, Alan Barnard establishes a framework for designing and implementing a continuous improvement process, along with an auditing process to focus improvements where they are most needed. Alan describes the use of strategy and tactics trees both in implementing an improvement and in auditing the progress of the implementation. Chapter 16 provides a historical perspective on the need for a holistic approach to implementing Theory of Constraints (TOC) concepts. Two well-know TOC experts, Dr. Alan Barnard and Mr. Ray Immelman, present implementation case studies, one involving a public sector company and the other a private company.
References Achanga, P., Shehab, E., Roy, R., and Nelder, G. 2006. "Critical success factors for lean implementation within SMEs," Journal of Manufacturing Technology Management 17(4):460. Angel, R. and Rampersad, H. 2005. "Do scorecards ADD UP?" CA Magazine 138(4)(May):30. Anonymous. 2008. "Linking strategy to operations," Journal of Accountancy 206,(4)(Oct):80. Anonymous. 2003.How alhsell discarded its budgeting process. IOMA's Report on Financial Analysis, Planning & Reporting 03(8)(Aug 2003):11. Antonelli, V., Boyns, T., and Cerbioni, F. 2006. "Multiple origins of accounting—an early Italian example of the development of accounting for managerial purposes," European Accounting Review 15(3):367. Austin, R.D. 1996. Measuring and Managing Performance in Organizations. New York: Dorset House Publishing. Bhimani, A., Gosselin, M., Ncube, M., and Okano, H. 2007. "Activity-based costing: How far have we come internationally?" Cost Management 21(3)(May/Jun):12.
36 Bourne, M., Neely, A., Platts, K., and Mills, J. 2002. "The success and failure of performance measurement initiatives: Perceptions of participating managers," International Journal of Operations & Production Management 22 (11):1288. Bragg, S.M. 2007a. Management Accounting Best Practices: A Guide For The Professional Accountant. Hoboken, NJ: John Wiley & Sons. Bragg, S.M.2007b. Throughput Accounting: A Guide to Constraint Management. Hoboken, NJ: John Wiley & Sons. Brandt, D. 2009. "Searching for lean with lean," Industrial Engineer 41 (5)(May):50. Brewton, J. 2009. "The lean office: Develop lean administrative procedures," Cost Management 23(2)(Mar/Apr):40. Brown, M. G. 2007. Beyond the Balanced Scorecard: Improving Business Intelligence with Analytics. New York: Productivity Press. Buhovac, A.R. and Slapnicar, S. 2007. "The role of balanced, strategic, cascaded and aligned performance measurement in enhancing firm performance," Economic and Business Review for Central and South-Eastern Europe 9 (1)(Feb):47. Cardinaels, E. and Labro, E. 2009. "Costing systems," Financial Management (Dec 2008/Jan):42. Church, A.H. 1908. The Proper Distribution of Expense Burden. Baltimore, MD: Waverly Press. Church, A.H. 1917. Manufacturing Costs and Accounts. New York: McGraw-Hill Book. Cohen, S., Venieris, G., and Kaimenaki, E. 2005. "ABC: Adopters, supporters, deniers and unawares," Managerial Auditing Journal 20 (8/9):981. Cokins, G. 2001. Activity-Based Cost Management: An Executive's Guide. New York: John Wiley & Sons. Cooper, R. 2000. "Viewpoint: 21st century cost management–cost management: From Frederick Taylor to the present," Cost Management 14,(5)(Sep/Oct):4. Cooper, R., Kaplan, R.S., Maisel, L.S., Morrissey, E., and Oehm, R.M. 1992. Implementing Activity-Based Cost Management: Moving From Analysis to Action. Montvale, NJ: Institute of Management Accountants. Cruikshank, J. L. 1987. A Delicate Experiment: The Harvard Business School 1909-1945. Boston, MA: Harvard Business School Press. Cunningham, J. E. and Fiume, O. J. 2003. Real Numbers: Management Accounting in a Lean Organization. Durham, NC: Managing Times Press. Dearlove, D. and Crainer, S. "Whatever happened to yesterday's bright ideas?" In The Conference Board Review [database online]. New York [cited July 25 2009]. Available from http://www.conferenceboard.org/articles/articlehtml.cfm?ID=346. Deem, J. 2009. The relationship of organizational culture to balanced scorecard effectiveness. D.B.A., Davie, FL: Nova Southeastern University. Does, R., Vermaat, T., Verver, J., Bisgaard, S., and Van Den Heuvel, J. 2009. "Reducing start time delays in operating rooms," Journal of Quality Technology 41 (1)(Jan):95. Dopuch, N. and Birnberg, J G. 1969. Cost Accounting: Accounting Data for Management Decisions. New York: Harcourt, Brace & World, Inc. Dvorak, P. 2009. "Clarity is missing link in supply chain," The Wall Street Journal, May 18, sec A. Eden, Y. and Ronen, B. 2007. Approximately Right, Not Precisely Wrong: Cost Accounting, Pricing & Decision Making. Great Barrington, MA: North River Press. Edwards, R. and Boyns, T. 2009. The History of Cost and Management Accounting: The Experience of the United Kingdom. Oxford, UK: Routledge. Everaert, P. and Bruggeman, W. 2007. "Time-driven activity-based costing: Exploring the underlying model," Cost Management 21 (2)(Mar/Apr):16. Ferrara, W. L. 2007. "Topics worthy of continued discussion and effort—Even after forty years of trying," Journal of Management Accounting Research 19:171–179. Fleischman, R. K. and Parker, L. D. 1990. "Managerial accounting early in the British industrial revolution: The Carron Company, a case study," Accounting and Business Research 20(79)(Summer):211. Fleischman, R. K. and Parker, L. D. 1997. What is Past is Prologue. London: Garland Publishing, Inc. Follett, M. P. and Sheldon, O. 2003. Dynamic Administration, the Collected Papers of Mary Parker Follett: Early Sociology of Management and Organizations. London: Routledge. Garrison, R. H., Noreen, E. W., and Brewer, P. C. 2010. Managerial Accounting. 13th ed. New York: McGraw-Hill. Geri, N. and Ronen, B. 2005. "Relevance lost: The rise and fall of activity-based costing," Human Systems Management 24 (2):133. Goldratt, E. M. 1990. The Haystack Syndrome: Sifting Information Out of the Data Ocean. Croton-on-Hudson, NY: North River Press, Inc. Goldratt, E. M. 1997. Critical Chain. Great Barrington, MA: North River Press.
37 Goldratt, E. M. and Cox, J. 1984. The Goal: A Process of Ongoing Improvement. Croton-on-Hudson, NY: North River Press. Grudens, R. 1997. Henry Ford: Helped lead American World War II production efforts. In HistoryNet.com [online database] [cited July 20, 2009]. Available from http://www.historynet.com/henry-ford-helped-lead-americanworld-war-ii-production-efforts.htm. Harris, N. J. 1936. "What did we earn last month?" National Association of Comptrollers and Accounting Officers Bulletin XVII (5)(January 15, 1936):501-502. Hayes, R. H. and Abernathy, W. J. 1980. "Managing our way to economic decline," Harvard Business Review 58 (4)(July-August 1980):67. Henkoff, R. 1998. "Boeing's big problem," Fortune 137 (1)(Jan 12):96. Hilton, R. W. 2009. Managerial Accounting: Creating Value in a Dynamic Business Environment. 8th ed. New York: McGraw-Hill. Hope, J. and Fraser, R. 2003. Beyond Budgeting: How Managers Can Break Free From the Annual Performance Trap. Boston, MA: Harvard Business School Press. Huntzinger, J. R. 2007. Lean Cost Management: Accounting for Lean by Establishing Flow. Ft. Lauderdale, FL: J. Ross Publishing. Jargon, J. 2009. "Latest Starbucks buzzword: 'lean' Japanese techniques," The Wall Street Journal, August 4, sec A. Jelinek, M. 1980. "Toward systematic management: Alexander Hamilton Church," Business History Review 54 (000001)(Spring 1980):63–79. Jenson, B., Albrecht, D., Walters, P. et al. "Accounting education using computers & multimedia." Available from http://pacioli.loyola.edu/aecm/ (accessed August 29, 2009). Johnson, H. T. and Broms, A. 2000. Profit Beyond Measure. New York: The Free Press. Johnson, H. T. and Kaplan, R. S. 1987. Relevance Lost: The Rise and Fall of Management Accounting. Boston, MA: Harvard Business School Press. Kanigel, R. 1997. The One Best Way: Frederick Winslow Taylor and the Enigma of Efficiency. New York: Viking Penguin. Kaplan, R. S. 1984. "The evolution of management accounting," The Accounting Review 59(3)(Jul):390. Kaplan, R. S. and Anderson, S. R. 2003. Time-Driven Activity-Based Costing, working paper # 04-045. Boston, MA: Harvard Business School, http://www.hbs.edu/research/facpubs/workingpapers/papers2/0304/04-045.pdf (accessed August 1, 2009). Kaplan, R. S. and Norton, D. P. 1992. "The balanced scorecard—measures that drive performance," Harvard Business Review 70 (1)(Jan/Feb 1992):71–79. Kaplan, R. S. and Norton, D. P. 1996. The Balanced Scorecard. Boston, MA: Harvard Business School Press. Kelly, J. and Rivenbark, W. 2008. "Budget theory in local government: The process-outcome conundrum," Journal of Public Budgeting, Accounting & Financial Management 20 (4)(Winter):457. Kiani, R. and Sangeladji, M. 2003. "An empirical study about the use of the ABC/ABM models by some of the fortune 500 largest industrial corporations in the USA," Journal of American Academy of Business, Cambridge 3 (1/2)(Sep):174. Lawson, R., Stratton, W., and Hatch, T. 2003. "The benefits of a scorecard system: A new North American study explains how balanced scorecard users get their money's worth," CMA Management 77 (4)(Jun/Jul):24. Liker, J. K. 2004. The Toyota Way: 14 Management Principles from the World's Greatest Manufacturer. New York: McGraw-Hill. Liker, J. K. and Meier, D. 2006. The Toyota Way Field Book: A Practical Guide for Implementing Toyota's 4Ps. New York: McGraw-Hill. Litterer, J. A. 1961. "Alexander Hamilton Church and the development of modern management," Business History Review 35 (Summer 1961):211–225. Maskell, B. and Baggaley, B. 2004. Practical Lean Accounting: A Proven System for Measuring and Managing the Lean Enterprise. New York.: Productivity Press. McFarland, W. B. 1950. "How standard costs are being used today for control, budgeting, pricing: A survey," Journal of Accountancy (Pre-1986) 89 (000002)(Feb):125. McLean, T. 2006. "Continuity and change in British cost accounting development: The case of Hawthorn Leslie, shipbuilders and engineers, 1886-1914. The British Accounting Review 38 (1)(Mar):95. Nolan, G. J. 2005. "The end of traditional budgeting," Journal of Performance Management 18 (1):27–39. Oliver, L. 2004. Designing Strategic Cost Systems. Hoboken, NJ: John Wiley & Sons. Olson, R., Verley, J., Santos, L., and Salas, C. 2004. "What we teach students about the hawthorne studies: A review of content within a sample of introductory I-O and OB textbooks," The Industrial-Organizational Psychologist
38 41 (3)(January 2004):23–39. Palmer, R. J. and Vied, M. 1998. "ABC: Could ABC threaten the survival of your company?" Management Accounting 80 (5)(Nov):33. Peters, T. J. and Waterman, R. H. Jr. 1982. In Search of Excellence: Lessons From America's Best-Run Companies. New York: Harper & Row. Polischuk, T. 2009. "What's lean mean? . . . " PackagePrinting 56 (2)(Feb):30. Pullin, J. 2009. "The learning factory," Professional Engineering 22 (11)(Jun 24):31. Ricketts, J. A. 2008. Reaching the Goal: How Managers Improve a Services Business Using Goldratt's Theory of Constraints. Boston MA: IBM Press and Pearson Education, Inc. Schragenheim, E., Dettmer, H. W., and Patterson, J. W. 2009. Supply Chain Management at Warp Speed. Boca Raton, FL: Auerbach Publications, Taylor & Francis Group. Shewhart, W. E. 1931, 1980. Economic Control of Quality of Manufactured Product. New York: D. Van Nostrand Company, Inc.; Milwaukee, WI: American Society for Quality Control. Shipulski, M., Hockley, R., and Beck, R. 2009. "Resurrecting manufacturing," Industrial Engineer 41 (7)(Jul):24. Shook, J. 2009. "Toyota's secret," MIT Sloan Management Review 50 (4)(Summer):30. Skapinker, M. 1998. "Boeing, boeing, bong: Michael skapinker on the production woes that have spoiled what should have been a bumper period for the US aircraft maker," Financial Times, Feb 6, 1998. Smith, D. 2000. The Measurement Nightmare. Boca Raton, FL: St. Lucie Press. Speckbacher, G., Bischof, J., and Pfeiffer, T. 2003. "A descriptive analysis on the implementation of balanced scorecards in German-speaking countries," Management Accounting Research 14 (4)(Dec):361. Stewart, M. 2009. The Management Myth: Why the Experts Keep Getting it Wrong. New York: W. W. Norton & Company, Inc. Stratton, W., Desroches, D., Lawson, R., and Hatch, T. 2009. "Activity-based costing: Is it still relevant?" Management Accounting Quarterly 10 (3)(Spring):31. Stuart, I. and Boyle, T. 2007. "Advancing the adoption of 'lean' in Canadian SMES," Ivey Business Journal Online (Jan/Feb). Taylor, F. W. 1911, 1967. The Principles of Scientific Management. New York: Harper & Row; W.W. Norton & Company, Inc. Tyson, T. 1993. "Keeping the record straight: Foucauldian revisionism and nineteenth century US cost accounting history," Accounting, Auditing & Accountability Journal 6(2):4. Van Veen-Dirks, P. and Molenaar, R. 2009. "Customer profitability pricing," Cost Management 23 (3)(May/Jun):32. Vangermeersch, R. and Schwarzback, H. R. 2005. "The historical development of management accounting." In Weil, R. L. and Maher, M. W., eds., Handbook of Cost Management. 2nd ed. Hoboken, NJ: John Wiley & Sons. Weber, J. and Linder, S. 2005. "Budgeting, better budgeting, or beyond budgeting," Cost Management 19 (2)(Mar/Apr):20. Weil, N. 2007. "A legacy of failure; researchers cite a 90 percent failure rate among companies trying to execute their strategies. What's up with that?" CIO 20 (19)(Jul 15):1. Whitehead, T. N. 1938. The Industrial Worker: A Statistical Study of Human Relations in a Group of Manual Workers, Volume I & II. Cambridge, MA: Harvard University Press. Womack, J. P., Jones, D.T. and Roos, D. 1990. The Machine that Changed the World. New York: Rawson Associates.
About the Author Charlene Spoede Budd is a Professor Emeritus from Baylor University, having taught management accounting and project management classes for a number of years. She received her undergraduate degree (accounting major, Summa Cum Laude), and MBA degree from Baylor University (1972 and 1973, respectively) and her PhD from The University of Texas at Austin (1982), where she specialized in the fields of accounting, economics, and finance. She holds the following active professional designations: CPA; CMA, CFM, PMP. In addition, she is certified in all areas of the Theory of Constraints by the Theory of Constraints International Certification Organization (TOC-ICO). Her research has been published primarily in practitioner journals and she has been awarded three Certificates of Merit for articles published in Strategic Finance. She also has singly or co-authored publications in Industrial Marketing Management
39 (special issue on projects), Human Systems Management Journal, Today’s CPA, The Counselor, and other journals and many conference proceedings. Dr. Budd has co-authored two accounting textbooks and she and current co-author, Charles Budd, have published A Practical Guide to Earned Value Project Management (Management Concepts, 2005 and 2010) and Internal Control and Improvement Initiatives (BNA, 2007). She is active in several professional organizations, including the American Accounting Association, Financial Executives Institute, and Project Management Institute. In addition, she has been a member of the AICPA’s Content Committee and was chair of the Business Environment and Content subcommittee of the AICPA from 2004 until 2008. Currently she is chair of the Finance and Metrics Committee of the TOC-ICO. Most of her time now is devoted to research, but she also has served as the chair of the audit committee and a member of the Board of Directors of a public company. Figure 13-1 Product flows through resources for a simple company. Figure 13-2 Scrap problem at Resource 4. Figure 13-3 Proposed acquisition of a cheaper material. Figure 13-4 Product X, Resource 1, Task 1—make versus buy decision. Figure 13-5 Product X and Y, Resource 1, Task 2 and Resource 2, Task 3—make versus buy decision. Figure 13-6 First engineer’s engineering change proposal. Figure 13-7 Second engineer’s engineering change proposal. Figure 13-8 Traditional and Throughput income statements. Figure 13-9 Traditional inventory value versus inventory value days.