but we can also regard it as an illustration that the effect of age is different for .... of an interaction parameter into an effect modification is an important step in the ...
Chapter 18 Effect modification and interactions
80 60 50
50
60
70
weight 70 80
90 100
Modeling effect modification 90 100
18.1
30
40
50 dose
female
male
40
40
male
70
30
Figure 18.1: Data from an experimental study investigating the effect of the vitamin B intake on the weight of mice.
40
50 dose
female 70
Figure 18.2: The data of Figure 18.1 with regression lines for male and female mice.
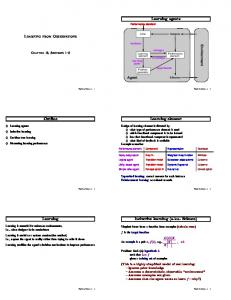
In some applications one is interested in the question how one covariate may affect the effect of another covariate. Figure 18.1 illustrates a typical situation of this type, in which the effect of the vitamin B intake on the weight of mice seems to differ between male and female mice. If we fit regression lines separately for male and female mice (Figure 18.2), it looks like that the vitamin B has only a small effect in female mice, but a large effect in male mice. Fitting two regression lines, however, does not directly allow to compare the two lines in the sense of assessing the statistical significance of the difference between the two lines. This can 247
248
CHAPTER 18. EFFECT MODIFICATION AND INTERACTIONS
be approached by considering a joint model across the two groups. Introducing the random variables X1 = Vitamin B intake (in mg) and X2 =
(
1 if mouse is male 0 if mouse is female
we can describe the situation by two separate regression models: ( A β0 + β1A x1 if x2 = 1 µ(x1 , x2 ) = β0B + β1B x1 if x2 = 0
(∗)
with β1A denoting the slope in male mice and β1B denoting the slope in female mice as the main parameter of interest. However, this description does not have the usual form of a regression model still. This can be approached by regarding X1 as actually two different covariates, one defined in the male and one defined in the female mice: ( X1 if x2 = 1 A X1 = 0 if x2 = 0 ( 0 if x2 = 1 X1B = X1 if x2 = 0 We can now consider a regression model with the covariates X1A , X1B and X2 which reads µ(x ˜ 1A , x1B , x2 ) = β˜ 0 + β˜ 1A x1A + β˜ 1B x1B + β˜ 2 x2 . Here β˜ 1A denotes the effect of changing X1 in the male mice, and β˜ 1B describes the effect of changing X1 in the female mice, and hence it is not surprising that β˜ 1A = β1A and β˜ 1B = β1B . Indeed, this model is equivalent to the “double” model (*) with the relations β˜ 0 = β0A , β˜ 1A = β1A , β˜ 1B = β1B , and β˜ 2 = β0B − β0A because in the case x2 = 0 we have ˜ 1A , 0, 0) = β˜ 0 + β˜ 1A x1A = β˜ 0 + β˜ 1A x1 µ(x1 , 0) = β0A + β1A x1 and µ(x and in the case x2 = 1 we have ˜ x1B , 1) = β˜ 0 + β˜ 1B x1B + β˜ 2 = β˜ 0 + β˜ 2 + β˜ 1B x1 µ(x1 , 1) = β0B + β1B x1 and µ(0, Consequently, if fitting a regression model with the three covariates X1A , X1B and X2 to the data of Figure 18.1, we obtain an output like variable intercept dosemale dosefemale sex
beta 47.714 0.589 0.143 2.829
SE 7.845 0.158 0.158 11.094
95%CI [25.933,69.495] [0.151,1.026] [-0.295,0.581] [-27.974,33.631]
p-value 0.004 0.020 0.416 0.811
18.1. MODELING EFFECT MODIFICATION
249
logit (rel. frequency) −1 −.5 0 .5 1
and we obtain βˆ 1A = 0.589 and βˆ 1B = 0.143 as the slope parameter estimates in males and females, respectively. To assess the degree of effect modification, we will look at the difference between the slopes, i.e. γ = β1B − β1A and we obtain γˆ = βˆ 1B − βˆ 1A = 0.589 − 0.143 = 0.446. By further steps we can obtain a confidence interval of [−0.173, 1.065] and a p-value of 0.116. So the evidence we have in favor for a true difference between male and female mice with respect to the effect of vitamin B intake is limited. However, the large confidence interval suggests that the difference may be substantial. Note that it does not make great sense to look at the p-values of βˆ 1B and βˆ 1A , since it is not the aim of our analysis to assess the question, whether there is an effect in each subgroup, but to assess whether there is a difference in the effect.
placebo female
treatment male
female male placebo treatment placebo treatment number of patients 67 62 71 67 patients with decrease in BP 22 23 27 45 fraction of patients with decrease in BP 32.8% 37.1% 38% 67.2% .489 .59 .614 2.045 odds = fraction/(100-fraction) logit=log(odds) -.715 -.528 -.488 .715 Figure 18.3: Data from a clinical trial on an antihypertensive treatment and a visualisation of this data Figure 18.3 illustrates a second example in which the effect of an antihypertensive treatment is considered to be dependent on sex. We can see that in females the treatment difference can be 0.590 expressed as an empirical odds ratio of 1.207 = 0.489 , whereas in the males we obtain an odds 2.045 ratio of 3.331 = 0.614 , i.e. the treatment effect is much bigger in males, as we can also see in the graph of Figure 18.3. We can now use logistic regression to obtain a confidence interval and a p-value for the ratio between these two odds ratios, which describes to which degree sex alters the treatment effect. Introducing the two covariates ( 1 if treatment is given to the patient X1 = 0 if placebo is given to the patient
CHAPTER 18. EFFECT MODIFICATION AND INTERACTIONS
250 and
X2 =
(
1 if patient is male 0 if patient is female
we can describe the situation again by a double regression model ( A β0 + β1A if x2 = 1 logit π(x1 , x2 ) = β0B + β1B if x2 = 0 A
B
and eβ1 is identical with the odds ratio in males, and eβ1 is identical with the odds ratio in females. Consequently, eγ for γ = β1B − β1A satisfies B
γ
e =e
β1B −β1A
=
e β1
A
e β1
i.e. it is the ratio of the odds ratio in males and females. As above it is equivalent to consider a regression model in the three covariates X1A , X1B and X2 and in fitting this model we obtain an output like variable intercept treatmale treatfemale sex
beta -0.716 1.204 0.188 0.227
SE 0.260 0.357 0.370 0.357
95%CI [-1.226,-0.206] [0.504,1.904] [-0.537,0.912] [-0.472,0.927]
p-value 0.006 0.001 0.612 0.524
The difference γˆ = βˆ 1B − βˆ 1A = 1.204 − 0.188 = 1.016 corresponds to the difference we see in Figure 18.3, and by further steps we can obtain a confidence interval of [0.009, 2.024]. By exponentiating the estimate and the confidence interval we obtain 2.763 with a confidence interval of [1.009, 7.568]. Note that 2.763 is exactly the ratio between the two empirical odds ratios 3.331 and 1.207 we have computed above. The considerations above can be easily extended to categorical covariates. If, for example, a categorical covariate X2 with three categories A, B, and C modifies the effect of another covariate X1 , we have just to construct for each category a covariate: ( X1 if x2 =A A X1 = 0 if x2 , A ( X1 if x2 =B X1B = 0 if x2 , B ( X1 if x2 =C X1C = 0 if x2 , C and we proceed as above.
18.1. MODELING EFFECT MODIFICATION
10
relative frequency 20 30 40 50
60
251
30−39
40−49
non smokers
smokers
50−59 60−69 age classes
70−79
Figure 18.4: The relative frequency of hypertension in dependence on the smoking status and age in an observational study with 1332 subjects. Age is available in years and only grouped into categories for this graph.
It remains to consider the case, in which we are interested in modeling the modifying effect of a continuous covariate on the effect of another covariate. Figure 18.4 illustrates such a situation with the two covariates ( 1 subject is a smoker X1 = 0 subject is no smoker and X2 = age of subject (in years) , and we are interested in how age changes the effect of smoking. Since X2 is a continuous covariate, we cannot apply the approach defining a version of X1 for any value of X2 . Instead, we have to consider directly the model we are interested in, i.e. a model allowing the effect of X1 to depend on X2 . We can write such a model as logit π(x1 , x2 ) = β0 + β1 (x2 )x1 + β2 x2 , i.e. we allow the regression coefficient of X1 to depend on the value of X2 . The most simple type of dependence is a linear relation, i.e. we specify the dependence as β1 (x2 ) = α0 + α1 x2 such that α0 is the effect of X1 if x2 = 0 and α1 describes the increase of the effect of X1 if we increase X2 by 1.0. If we now insert this in the model above, we obtain logit π(x1 , x2 ) = β0 + (α0 + α1 x2 )x1 + β2 x2 , which we can rewrite as logit π(x1 , x2 ) = β0 + α0 x1 + α1 x1 x2 + β2 x2 . This is a model we can fit directly to our data. We have just to introduce a new covariate X3 = X1 × X2
(∗∗)
252
CHAPTER 18. EFFECT MODIFICATION AND INTERACTIONS
and we fit a linear model in the three covariates X1 , X2 and X3 . If we do this for the data of Figure 18.4, we obtain an output like variable intercept smoking age agesmoking
beta -3.906 2.955 0.051 -0.033
SE 0.385 0.506 0.006 0.009
95%CI [-4.660,-3.152] [1.963,3.947] [0.039,0.064] [-0.050,-0.016]
p-value F R-squared Adj R-squared Root MSE
= = = = = =
8 22.57 0.0057 0.9442 0.9024 4.6645
-----------------------------------------------------------------------------weight | Coef. Std. Err. t P>|t| [95% Conf. Interval] -------------+---------------------------------------------------------------dose | .1428571 .1576874 0.91 0.416 -.2949532 .5806675 sex | 2.828571 11.09429 0.25 0.811 -27.97412 33.63126 dosesex | .4457143 .2230036 2.00 0.116 -.173443 1.064872 _cons | 47.71429 7.844848 6.08 0.004 25.9335 69.49507 ------------------------------------------------------------------------------
Note that the results for dosesex agree with those of the first lincom command above.
To obtain the slope estimates within the two sex groups we have just to realize that within the females (sex==0) our model reads µ(x1 , 0) = β˜ 0 + β˜ 1 x1 such that the effect of the vitamin B intake in females is equal to the effect of dose in the output above. Within males (sex==1) the model reads µ(x1 , 1) = β˜ 0 + β˜ 1 x1 + β˜ 2 + β˜ 12 x1 = β˜ 0 + β˜ 2 + (β˜ 1 + β˜ 12 )x1 .
(18.1) (18.2)
18.10. HOW TO ANALYSE EFFECT MODIFICATION AND INTERACTIONS WITH STATA271 such that the slope estimate for the males (sex==1) can be computed as . lincom dose+dosesex ( 1)
dose + dosesex = 0
-----------------------------------------------------------------------------weight | Coef. Std. Err. t P>|t| [95% Conf. Interval] -------------+---------------------------------------------------------------(1) | .5885714 .1576874 3.73 0.020 .1507611 1.026382 ------------------------------------------------------------------------------
The tests about any effect of the vitamin B intake can be performed by . lincom 0.5*dose + 0.5*(dose+dosesex) ( 1)
dose + .5*dosesex = 0
-----------------------------------------------------------------------------weight | Coef. Std. Err. t P>|t| [95% Conf. Interval] -------------+---------------------------------------------------------------(1) | .3657143 .1115018 3.28 0.031 .0561356 .6752929 ------------------------------------------------------------------------------
and by . test dose dosesex ( 1) ( 2)
dose = 0 dosesex = 0 F(
2, 4) = Prob > F =
7.38 0.0455
One can also use Stata’s xi: construct to add the product of the covariates to the regression model: . xi: regress weight i.sex*dose i.sex _Isex_0-1 i.sex*dose _IsexXdose_# Source |
SS
df
(naturally coded; _Isex_0 omitted) (coded as above) MS
Number of obs =
8
CHAPTER 18. EFFECT MODIFICATION AND INTERACTIONS
272
-------------+-----------------------------Model | 1472.97143 3 490.990476 Residual | 87.0285714 4 21.7571429 -------------+-----------------------------Total | 1560 7 222.857143
F( 3, 4) Prob > F R-squared Adj R-squared Root MSE
= = = = =
22.57 0.0057 0.9442 0.9024 4.6645
-----------------------------------------------------------------------------weight | Coef. Std. Err. t P>|t| [95% Conf. Interval] -------------+---------------------------------------------------------------_Isex_1 | 2.828571 11.09429 0.25 0.811 -27.97412 33.63126 dose | .1428571 .1576874 0.91 0.416 -.2949532 .5806675 _IsexXdose_1 | .4457143 .2230036 2.00 0.116 -.173443 1.064872 _cons | 47.71429 7.844848 6.08 0.004 25.9335 69.49507 ------------------------------------------------------------------------------
Note however that this does not work if both covariates are continuous.
We now consider the example of Figure 18.4. . use hyper . list in 1/10
1. 2. 3. 4. 5. 6. 7. 8. 9. 10.
+----------------------------+ | id age smoking hyper | |----------------------------| | 1 47 0 0 | | 2 53 1 1 | | 3 50 1 1 | | 4 40 1 1 | | 5 33 1 0 | |----------------------------| | 6 47 0 0 | | 7 54 1 1 | | 8 38 0 0 | | 9 59 0 1 | | 10 67 0 1 | +----------------------------+
and would like to investigate the effect of smoking as a function of age. Since age is a continuous covariate, we have to follow the interaction approach:
18.10. HOW TO ANALYSE EFFECT MODIFICATION AND INTERACTIONS WITH STATA273 . gen agesmoking=age*smoking . logit hyper age smoking agesmoking Iteration Iteration Iteration Iteration Iteration
0: 1: 2: 3: 4:
log log log log log
likelihood likelihood likelihood likelihood likelihood
= = = = =
Logistic regression
Log likelihood = -793.22413
-877.28077 -795.08929 -793.22769 -793.22413 -793.22413 Number of obs LR chi2(3) Prob > chi2 Pseudo R2
= = = =
1332 168.11 0.0000 0.0958
-----------------------------------------------------------------------------hyper | Coef. Std. Err. z P>|z| [95% Conf. Interval] -------------+---------------------------------------------------------------age | .0512461 .0064305 7.97 0.000 .0386426 .0638497 smoking | 2.955036 .5061917 5.84 0.000 1.962918 3.947153 agesmoking | -.0326584 .0087536 -3.73 0.000 -.0498152 -.0155016 _cons | -3.905869 .3847093 -10.15 0.000 -4.659885 -3.151852 ------------------------------------------------------------------------------
Now we can assess the change of the effect of smoking over 10 years . lincom agesmoking*10 ( 1)
10*[hyper]agesmoking = 0
-----------------------------------------------------------------------------hyper | Coef. Std. Err. z P>|z| [95% Conf. Interval] -------------+---------------------------------------------------------------(1) | -.3265839 .0875364 -3.73 0.000 -.4981521 -.1550156 ------------------------------------------------------------------------------
and we can use lincom’s or option to obtain the result as the factor corresponding to the increase of the odds ratio: . lincom agesmoking*10, or ( 1)
10*[hyper]agesmoking = 0
------------------------------------------------------------------------------
CHAPTER 18. EFFECT MODIFICATION AND INTERACTIONS
274
hyper | Odds Ratio Std. Err. z P>|z| [95% Conf. Interval] -------------+---------------------------------------------------------------(1) | .7213839 .0631474 -3.73 0.000 .6076525 .8564018 ------------------------------------------------------------------------------
Now we look at the effect of smoking at age 35 and age 75: . lincom _b[smoking] + 75 * _b[agesmoking] ( 1)
[hyper]smoking + 75*[hyper]agesmoking = 0
-----------------------------------------------------------------------------hyper | Coef. Std. Err. z P>|z| [95% Conf. Interval] -------------+---------------------------------------------------------------(1) | .5056565 .2059231 2.46 0.014 .1020546 .9092584 -----------------------------------------------------------------------------. lincom _b[smoking] + 35 * _b[agesmoking] ( 1)
[hyper]smoking + 35*[hyper]agesmoking = 0
-----------------------------------------------------------------------------hyper | Coef. Std. Err. z P>|z| [95% Conf. Interval] -------------+---------------------------------------------------------------(1) | 1.811992 .2217385 8.17 0.000 1.377393 2.246591 ------------------------------------------------------------------------------
Finally, we take a look at how to perform likelihood ratio tests. (Which are again slightly more powerful.) First we test the null hypothesis of no interaction by comparing the model above with a model without an interaction: . estimates store A . logit hyper age smoking Iteration Iteration Iteration Iteration
0: 1: 2: 3:
log log log log
Logistic regression
likelihood likelihood likelihood likelihood
= -877.28077 = -801.10435 = -800.2788 = -800.27872 Number of obs LR chi2(2) Prob > chi2
= = =
1332 154.00 0.0000
18.10. HOW TO ANALYSE EFFECT MODIFICATION AND INTERACTIONS WITH STATA275 Log likelihood = -800.27872
Pseudo R2
=
0.0878
-----------------------------------------------------------------------------hyper | Coef. Std. Err. z P>|z| [95% Conf. Interval] -------------+---------------------------------------------------------------age | .0344195 .0043207 7.97 0.000 .0259511 .0428878 smoking | 1.139242 .1214511 9.38 0.000 .901202 1.377281 _cons | -2.936872 .2597851 -11.31 0.000 -3.446042 -2.427703 -----------------------------------------------------------------------------. lrtest A Likelihood-ratio test (Assumption: . nested in A)
LR chi2(1) = Prob > chi2 =
14.11 0.0002
Next we test the null hypothesis of “no effect of smoking at all” by comparing the full model with the model in which all terms involving smoking are omitted:
. logit hyper age Iteration Iteration Iteration Iteration
0: 1: 2: 3:
log log log log
likelihood likelihood likelihood likelihood
Logistic regression
Log likelihood = -846.07002
= = = =
-877.28077 -846.18595 -846.07003 -846.07002 Number of obs LR chi2(1) Prob > chi2 Pseudo R2
= = = =
1332 62.42 0.0000 0.0356
-----------------------------------------------------------------------------hyper | Coef. Std. Err. z P>|z| [95% Conf. Interval] -------------+---------------------------------------------------------------age | .0320192 .0041419 7.73 0.000 .0239012 .0401373 _cons | -2.278813 .2361742 -9.65 0.000 -2.741706 -1.81592 -----------------------------------------------------------------------------. lrtest A Likelihood-ratio test (Assumption: . nested in A)
LR chi2(2) = Prob > chi2 =
105.69 0.0000
276
18.11
CHAPTER 18. EFFECT MODIFICATION AND INTERACTIONS
Exercise Treatment interactions in a randomised clinical trial for the treatment of malignant glioma
The dataset gliom includes data from a randomised clinical trial comparing a mono chemotherapy (BCNU) with a combination therapy (BCNU + VW 26) for the treatment of malignant glioma in adult patients. The variable time includes the survival time (in days) after chemotherapy (if died==1), or the time until the last contact with the patient (if died==0). a) It has been claimed that the benefit from the combination therapy depends on the performance status of the patient. The variable ps divides the subjects into those with poor performance status (ps==0) and those with good performance status (ps==1). Try to clarify the claim based on the available data. Try to support the results of your analysis by appropriate Kaplan Meier curves. b) Some people have even raised doubt about that the combination therapy is of any benefit for the patients. Try to clarify this question based on the available data. c) It has been claimed that the benefit from the combination therapy depends on the age of the patient. Try to clarify this claim based on the available data. Try to support the results of your analysis by appropriate Kaplan Meier curves. d) The dataset includes besides the variable ps also a variable karnindex, which divides the subjects into three groups according to their Karnofsky index, a more detailed measurement of the performance status. Try to reanalyse a) again using this variable. Try to support the results of your analysis by appropriate Kaplan Meier curves.