current AASHTO Standard Specifications ... Standard Specifications, Seismic
Design Methods and the new LRFD ... Specifications for Highway Bridges, 16 th.
Chapter 2 Background Information
2.1.
Comparison between the new Recommended LRFD Guidelines and the current AASHTO Standard Specifications
This section describes some of the major changes between the current AASHTO Standard Specifications, Seismic Design Methods and the new LRFD Guidelines. The major differences between the new Recommended LRFD Guidelines and the current AASHTO Standard Specification are as follows: •
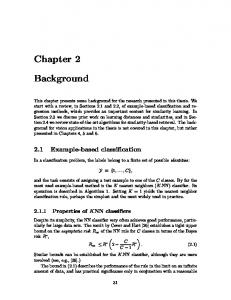
New USGS (United States Geological Survey) Maps The AASHTO Standard Specifications currently use a probabilistic map of peak ground acceleration (PGA) on rock, which is shown in Figure 2.1. The map
Figure 2.1. The Peak Ground Acceleration map currently used by the AASHTO Specifications. Accelerations are presented as % of g (acceleration due to gravity). The maximum peak ground acceleration for Virginia is 13%, located at the + sign on the map [MCEER/ATC, 2002].
3
was made by the USGS and published in 1990 [“USGS”, 2002]. The map shows the contours of PGA with a probability of exceedance of 10% in 50 years. On the other hand, the new LRFD Guidelines illustrate an updating of the ground motion maps, and give elastic response spectral accelerations for different periods of vibration. The two maps used by the new LRFD Guidelines are the 0.2-second and 1.0-second spectral acceleration maps, which both have 2% probability of exceedance in 50 years. The maps are shown in Figures 2.2 and 2.3.
Figure 2.2. The 0.2-second spectral acceleration map with 2% probability of exceedance in 50 years [Frankel and others, US Geological Survey, 1997]
•
New Spectral Shapes The response spectrum curve in the current AASHTO Specifications has a maximum spectral acceleration for short periods, which are less than approximately 0.33 second, and decays at a rate of 1/T2/3 for longer periods, with T as the period of vibration in seconds. The AASHTO Specifications response spectrum curve is shown in Figure 2.4. The response spectrum curve in the new LRFD Guidelines decays at a rate of 1/T and has smaller spectral accelerations for very short periods, as shown in Figure 2.5.
4
Figure 2.3. The 1.0-second spectral acceleration map with 2% probability of exceedance in 50 years [Frankel and others, US Geological Survey, 1997].
Cs = 2.0A or 2.5A*
2/3
Cs (%g)
Cs = (1.2AS) / T
Period (T) (seconds) * Depends on the soil profile type and A (acceleration coefficient from Figure 2.1) Figure 2.4. The response spectrum curve in the current AASHTO Specifications. From Standard Specifications for Highway Bridges, 16th Edition, Copyright 1996, by the American Association of State Highway and Transportation Officials, Washington, D.C. Used by permission.
5
Figure 2.5. The response spectrum curve in the new LRFD Guidelines [MCEER/ATC, 2002].
•
New Design Earthquakes and Performance Objectives The current AASHTO Specifications have one maximum design earthquake and two importance classifications for bridges (essential bridges and other bridges). The importance classification is used together with the acceleration coefficient to determine the Seismic Performance Category (SPC) for a given bridge. This is executed differently in the new LRFD Guidelines, as shown in Table 2.1. Table 2.1. New Design Earthquakes and Performance Objectives in the new LRFD Guidelines [MCEER/ATC, 2002]. Performance Level Probability of Exceedance For Design Earthquake Ground Motions Maximum Considered Earthquake (MCE) 3% PE in 75 years Expected Earthquake 50% PE in 75 years
Service Damage Service Damage
6
Life Safety Significant Disruption Significant Immediate Minimal
Operational Immediate Minimal Immediate Minimal to None
The new LRFD Guidelines have two design earthquakes: the expected earthquake with a probability of exceedance of 50% in 75 years, and the maximum considered earthquake with a probability of exceedance of 3% in 75 years. In combination with each of these earthquake events, the designer also has to select a performance objective, which determines the acceptable level of service and level of damage for a bridge that has been subjected to a design earthquake. The two levels are “Life Safety” and “Operational”. For the expected earthquake, all bridges classified in both performance levels are expected to return to immediate service and suffer only minimal damage. For the maximum considered earthquake, the “Life Safety” level bridges are expected to undergo significant service disruptions, such as partial or complete closure of the bridge, and significant structural damage. The “Operational” level bridges are expected to return to immediate service and suffer only minimal damage. •
New Soil Factors The current AASHTO Specifications have four soil classifications, and each classification corresponds to a soil factor, which is then used to determine the seismic response coefficients. The new LRFD Guidelines have six soil classifications, which are used with the spectral acceleration, design earthquake and performance objective to determine the allowable seismic design and analysis procedure (SDAP) and the seismic design requirements (SDR).
•
New Seismic Design and Analysis Procedures The current AASHTO Specifications have five different seismic design and analysis procedures, which depend on the seismic performance category. These seismic analysis procedures vary from no analysis required to a simple single degree of freedom system analysis to a more complex multi-degree of freedom analysis to a time history analysis. The new LRFD Guidelines have six seismic design and analysis procedures and six seismic design requirements. One of the two new methods is the Capacity Spectrum Design Procedure, which is a relatively simple procedure that falls between the “no-analysis” method and the
7
“uniform load” method effort wise. It is recommended for very regular structures in low seismic risk regions. The other new method is an elastic response spectrum analysis plus a displacement capacity verification. After the displacement capacity verification is executed, the member forces produced in the elastic response analysis can be reduced by a larger R factor, which then can produce more costeffective designs.
2.2.
Primary Changes for Virginia
2.2.1. Spectral Acceleration
Figures 2.6 and 2.7 illustrate a comparison between the design response spectrum curves of to the old AASHTO Specifications and the new LRFD Guidelines for the Richmond and Bristol areas, respectively. It is important to note that the design response spectrum curves of the old AASHTO Specifications were constructed by using the peak ground acceleration map, which had a probability of exceedance of 10% in 50 years, while the design response spectrum curves of the new LRFD Guidelines were drawn by using the 0.2-second and 1-second period spectral acceleration maps, which had a probability of exceedance of 2% in 50 years. These two different probabilities of exceedance are not equivalent, because they have significantly different return periods. Return period is the average frequency of an exceedance of the peak ground accelerations or spectral accelerations given on the corresponding maps. The formula to compute the return period is given by equation 2-1:
RP =
−T ln(1 − P )
(2-1)
RP = return period (years) T = the number of years of the probability of exceedance P = the probability of exceedance (number, not percentage)
8
For a probability of exceedance of 10% in 50 years, the return period is RP =
− 50 = 475 years ln(1 − 0.10 )
For a probability of exceedance of 2% in 50 years, the return period is RP =
− 50 = 2475 years ln(1 − 0.02 )
[Charney, 2001]
The difference in the probabilities of exceedance between the maps means that Figures 2.6 and 2.7 could only be used to compare the shapes of the design response spectrum curves of the old AASHTO Specifications and those of the new LRFD Guidelines, but not to compare the values of the spectral accelerations using the old AASHTO Specifications and those using the new LRFD Guidelines.
0.45
0.4
0.35
old AASHTO Specifications
Sa (g)
0.3
0.25
0.2
0.15
new LRFD Guidelines 0.1
0.05
0 0
0.2
0.4
0.6
0.8
1
1.2
1.4
Period (T) (sec.) Figure 2.6. The comparison between the response spectrum curves using the old AASHTO Specifications and the new LRFD Guidelines for the Richmond area, which has good soil (soil class B).
9
0.45 the new LRFD Guidelines 0.4
0.35
Sa (g)
0.3
0.25
the old AASHTO Specification
0.2
0.15
0.1
0.05
0 0
0.2
0.4
0.6
0.8
1
1.2
1.4
Period (T) (sec.) Figure 2.7. The comparison between the response spectrum curves using the old AASHTO Specifications and the new LRFD Guidelines for the Bristol area, which has good soil (soil class B).
2.2.2. Typical Seismic Design Procedure for Virginia Bridges
From the soil profile type and the location of the bridge, the Seismic Hazard Level can be determined by using Table 3.8 of this report on page 36. Then with an expected level of performance (life safety or operational), the Seismic Design and Analysis Procedure (SDAP) can be determined. The six different SDAPs are: 1. SDAP A1 and A2, for which no dynamic analysis is required. 2. SDAP B, which doesn’t require a seismic demand analysis but requires capacity design principles and minimum design details 3. SDAP C, which combines a demand and capacity analysis, including the effect of inelastic behavior of ductile earthquake resisting elements. This SDAP can only be applied to bridges that behave essentially as a single degree-of-freedom system. 4. SDAP D, which is a one step design procedure using an elastic (cracked section properties) analysis. 10
5. SDAP E, which requires an elastic (cracked section properties) response spectrum analysis for the governing design spectra (50% Probability of Exceedance in 75year or 3% Probability of Exceedance in 75-year/1.5 mean deterministic) and P-∆ design check. [MCEER/ATC, 2002].
For Virginia, the area with the highest seismic spectral accelerations is the southwestern part of the state, where Bristol is located. In a worst-case scenario, bridges located in the Bristol area that sit on poor soil are typically classified as Seismic Hazard Level III. Therefore the bridges with an operational level of performance in the Bristol area can use SDAP C, D or E. The two bridges analyzed in this study use SDAP D. The steps taken in this method are summarized as follows: 1. Calculate the material and section properties of the bridge and model it in RISA 3D (or similar three-dimensional frame solver). 2. Apply the dead and live loads to get the axial forces in the columns. 3. Calculate the cracked section properties of the columns. 4. Calculate the cracked section properties of the pier cap beam. 5. Calculate the period of vibration of the bridge using the uniform load method or the single mode spectral analysis method. 6. Calculate the equivalent earthquake forces for the bridge using the uniform load method or the single mode spectral analysis method. 7. Apply the equivalent earthquake forces obtained from either method and calculate the effects of earthquake forces using the appropriate R factors. 8. Combine the effects of the earthquake, dead and live loads. 9. Draw the interaction diagram for the columns and pier cap beam, and see if they have enough flexural and shear strength to carry the combined effects of the earthquake, dead and live loads. 10. Compare the bridge details with the detailing requirements of the new Recommended LRFD guidelines.
11
As stated later in one of the conclusions in Chapter 6, this type of rigorous design procedures will require approximately two weeks of normal workdays, compared to merely a few hours to perform the calculations of the design criteria required by the old AASHTO Specifications.
2.3.
Summary
It is apparent that the new seismic guidelines represent many changes for Virginia. The level of design effort will be increased in areas of relatively high seismic risk. It is also possible that some aspects of typical bridge designs will require modifications to meet the new seismic design requirements. Chapters 3 and 4 present the analysis of two typical bridges to evaluate the types of detailing changes which can be expected.
12