GSH homologues can be obtained from Bachem (St Helens,. Merseyside, UK). Aliquots of standard solutions can be shock- frozen in liquid nitrogen and stored ...
Chapter 20 Analyses of Reactive Oxygen Species and Antioxidants in Relation to Seed Longevity and Germination Christophe Bailly and Ilse Kranner Abstract Evidence is emerging that reactive oxygen species (ROS) and antioxidants, together with plant hormones and other reactive species, such as reactive nitrogen species, are part of signalling networks pertinent to plant stress responses, cell division, and cell death. Consequently, they play pivotal roles in the regulation of seed development and maturation, germination and dormancy, seedling establishment, and seed ageing. Importantly, ROS, although essentially required at low concentrations, must be kept under stringent control by antioxidants. If the balance between pro- and antioxidative processes is lost and ROS production prevails, oxidative stress is the result, which can induce cell death and ultimately seed death. This chapter offers a variety of protocols for the determination of ROS, antioxidants, and stress markers aimed at enabling the reader to quantify these compounds. Protocols are also described to visualize ROS and localize the sites of ROS production, hoping to stimulate more research into ROS signalling and antioxidant control in key physiological and biochemical processes in seeds. Key words: Antioxidants, Ascorbate, Seed germination, Glutathione, Hydrogen peroxide, Reactive oxygen species, Superoxide, Tocopherol
1. Introduction Reactive oxygen species (ROS) include the superoxide anion (O2s¯), hydrogen peroxide (H2O2), and the hydroxyl radical (sOH) and are continuously produced in plants as by-products of various metabolic pathways. In seeds, ROS are involved in deterioration during storage (1). However, evidence is now accumulating that ROS also play important roles in signalling associated with germination and dormancy alleviation (1). In order to obtain a comprehensive view of ROS metabolism in seeds, both the changes in ROS production and their regulation by antioxidants must be considered. ROS can be scavenged through the action of detoxifying Allison R. Kermode (ed.), Seed Dormancy: Methods and Protocols, Methods in Molecular Biology, vol. 773, DOI 10.1007/978-1-61779-231-1_20, © Springer Science+Business Media, LLC 2011
343
344
C. Bailly and I. Kranner
enzymatic cascades that include enzymes, such as superoxide dismutase (SOD), catalase (CAT), ascorbate peroxidase (APX), or glutathione reductase (GR), and by low-molecular-weight antioxidants among which ascorbate (AA), tocopherol, and glutathione (GSH) are the most abundant (2). Phenolic compounds often present in seed coats also have strong antioxidant properties, but are not considered in this chapter. We outline biochemical methods for assessing the balance between ROS and antioxidant mechanisms in seeds as well as techniques for determining ROS production sites in situ. Such methods can be complemented by classical molecular biology tools (not described here) to study the expression of genes regulated by ROS (3). Moreover, ROS also react with essential biomolecules, including lipids, proteins, and nucleic acids, which can lead to changes in cellular signalling or to damage if ROS scavenging pathways succumb under increasing stress and ROS production prevails. For example, proteins are very susceptible to oxidation, which can result in protein carbonylation. Methods to study protein carbonylation are described in Chapter 14. Lipids are also one of the major targets of ROS and estimation of their peroxidation described here can be used as a marker of oxidative stress.
2. Materials
2.1. Determination of ROS
1. Perchloric acid 0.2N.
2.1.1. Hydrogen Peroxide Determination: 3-Methyl2-benzothiazolinone hydrazone Method
3. 3-Dimethylaminobenzoic acid (DMAB): 12 mM in 0.375 M phosphate buffer, pH 6.5. DMAB must be first dissolved in ~200 ML ethanol.
2. Potassium hydroxide 4N.
4. 3-Methyl-2-benzothiazolinone hydrazone (MBTH), 1.3 mM. 5. Horseradish peroxidase (HRP) type VI: Stock solution of 12.5 U/mL. 6. Spectrophotometer and appropriate consumables, such as cuvettes.
2.1.2. Hydrogen Peroxide Determination: Luminol Method
1. Trichloroacetic acid 5% (w/v). 2. Ammonium hydroxide, 0.2 M. 3. Ion exchange resin Dowex 1X8 (Cl¯ form). 4. Luminol, 0.05 mM. 5. Potassium ferricyanide, 0.05 mM. 6. Hydrogen peroxide solutions: 1 MM to 1 mM in TCA 5% (for preparing standard curve). Prepare fresh daily.
20
Analyses of Reactive Oxygen Species and Antioxidants in Relation…
345
7. Luminometer and appropriate consumables, such as glass test tubes. 8. Spectrophotometer and appropriate consumables, such as cuvettes. 2.1.3. Analysis of Extracellular Hydrogen Peroxide Production: Xylenol Orange Assay
1. Reagent A: 25 mM FeSO4, 25 mM (NH4)2SO4, and 2.5 M H2SO4. 2. Reagent B: 125 MM xylenol orange and 100 mM sorbitol. 3. The “working reagent”: 0.1 mL of reagent A and 10 mL of reagent B. Incubate for 15 min (or until no further colour change occurs) before use. 4. Commercially available (Sigma-Aldrich) stock solutions of CAT and H2O2. 5. Spectrophotometer and appropriate consumables, such as cuvettes.
2.1.4. Superoxide Determination: Hydroxylamine Method
1. Sodium phosphate buffer: 50 mM, pH 7.8. 2. 1 mM hydroxylamine hydrochloride in 50 mM sodium phosphate buffer, pH 7.8. 3. Sulphanilamide, 17 mM. 4. 2-Naphtylamine, 7 mM. 5. Solutions of sodium nitrite in sodium phosphate buffer (pH 7.8, 50 mM) ranging from 0.1 MM to 1 mM for standard curve. 6. Spectrophotometer and appropriate consumables, such as cuvettes.
2.1.5. Analysis of Extracellular Superoxide Production: Epinephrine and XTT Assays
1. Epinephrine: 1 mM, pH 7.0. 2. Sodium 3c[-1-(phenylamino-carbonyl-carbon)-3,4-tetrazolium]bis (4-methoxy-6-nitro) benzene-sulphonic acid hydrate (XTT): 0.5 mM. 3. NADH: 0.2 mM. Prepare fresh. 4. SOD: 250 U/mL. 5. Spectrophotometer and appropriate consumables, such as cuvettes.
2.2. ROS Localization 2.2.1. Hydrogen Peroxide Localization with Cerium Chloride
All chemicals used should be of analytical grade quality. All aqueous solutions should be made with double-distilled H2O. 1. Cerium chloride: 5 mM CeCl 3 in 50 mM MOPS buffer, pH 7.2. 2. Glutaraldehyde: 6% (v/v) glutaraldehyde in 25 mM sodium phosphate buffer, pH 7.2.
346
C. Bailly and I. Kranner
3. Osmium tetroxide: 1% (v/v) OsO4 in 25 mM sodium phosphate buffer, pH 7.2. 4. Graded series of ethanol: 25, 50, 75, 95, and 100% (v/v). 5. Propylene oxide. 6. Araldite®. 7. Standard equipment for transmission electron microscopy, including ultra-microtome. 2.2.2. Tissue Localization of Hydrogen Peroxide with TMB
2.2.3. Hydrogen Peroxide Localization with Amplex® Red
1. McIlvaine buffer, pH 6.0: For 100 mL, mix 36.85 mL of 0.1 M citric acid with 63.15 ml of 0.2 M Na2HPO4. 2. 3,5,3c,5c-tetramethylbenzidine (TMB): 1% (w/v) TMB in McIlvaine buffer. 1. Stock solution of Amplex® Red: 20 mM in dimethyl sulfoxide (DMSO). 2. Potassium phosphate buffer: 20 mM, pH 6.0. 3. HRP type VI: Prepare a stock solution of 10 U/mL. 4. Standard equipment for fluorescence microscopy or confocal laser scanning microscope.
2.2.4. Superoxide Localization with NBT
1. Nitroblue tetrazolium chloride (NBT): 6 mM NBT in 10 mM Tris–HCl buffer, pH 7.4. 2. Standard equipment for light microscopy.
2.2.5. ROS Localization with DCFH-DA
1. Stock solution of 5-(and-6)-chloromethyl-2c,7c-dichlorofluorescein diacetate (DCFH-DA): 25 mM DCFH-DA in acetone. 2. Working solution of DCFH-DA: 100 MM DCFH-DA in 20 mM potassium phosphate buffer, pH 6.0. 3. Standard equipment for fluorescence microscopy or confocal laser scanning microscope.
2.3. Antioxidant Systems 2.3.1. Enzyme Extraction
1. Extraction buffer: 0.1 M potassium phosphate buffer, pH 7.8, containing 2 mM dithiothreitol (DDT), 0.1 mM ethylenediaminetetraacetic acid (EDTA), and 1.25 mM polyethylene glycol 4000 (PEG 4000). 2. Polyvinylpolypyrrolidone (PVPP). 3. Sephadex G25 column (i.e., disposable PD10 desalting columns, GE Healthcare).
2.3.2. Enzyme Analysis: CAT
1. Potassium phosphate buffer: 50 mM potassium phosphate, pH 7.0. Ensure that the solution has equilibrated to room temperature before starting the measurements. 2. Hydrogen peroxide: 37.5 mM. Prepare fresh daily.
20
Analyses of Reactive Oxygen Species and Antioxidants in Relation…
347
3. Spectrophotometer and appropriate consumables, such as cuvettes. 2.3.3. Enzyme Analysis: Superoxide Dismutase
1. Potassium phosphate buffer: 0.1 M potassium phosphate, pH 7.8. Ensure that the solution is in equilibrium with room temperature before starting measurements. 2. Riboflavin, 15.6 MM. 3. Methionine, 0.15 M. 4. NBT, 756 MM. 5. Glass test tubes, temperature-controlled water bath, fluorescent lamp (500 W min) (see Note 1). 6. Spectrophotometer and appropriate consumables, such as cuvettes.
2.3.4. Enzyme Analysis: Glutathione Reductase
1. Potassium phosphate buffer: 0.1 M potassium phosphate, pH 7.8. Ensure that the solution is at room temperature before starting measurements. 2. Glutathione disulphide (GSSG), 160 mM. 3. NADPH, 8 mM. 4. MgCl2, 24 mM. 5. Spectrophotometer and appropriate consumables, such as cuvettes.
2.3.5. Enzyme Analysis: Ascorbate Peroxidase
1. Potassium phosphate buffer: 50 mM potassium phosphate, pH 7.0. Ensure that the solution is at room temperature before starting measurements. 2. Ascorbate, 5 mM. 3. Hydrogen peroxide 20 mM. Prepare fresh daily. 4. Spectrophotometer and appropriate consumables, such as cuvettes.
2.3.6. Analysis of Lipid-Soluble Antioxidants: Tocopherols and Carotenoids
All chemicals used should be of analytical grade quality. 1. Extraction medium: DMSO, ice-cold ethanol, acetone, or acetone containing 0.1% N-ethyldiisopropylamine (see Note 2). 2. CaCO3 or MgCO3 (carotenoids only). 3. HPLC solvent for tocopherols: Methanol, HPLC grade. 4. HPLC solvents for carotenoids: Solvent A: acetonitrile: water: methanol = 100:10:5 (v/v/v); solvent B: acetone:ethyl acetate = 2:1 (v/v). 5. Pigments for preparation of standards: These are available from Sigma-Aldrich and DHI – Water & Environment (Denmark). 6. Freeze drier (optional; see Note 3).
348
C. Bailly and I. Kranner
7. For freeze-dried samples: Laboratory ball mill with Teflon grinding vessels and agate balls (e.g. Retsch MM200 or Braun Dismembrator). Alternatively, mortar and pestle; both grinding techniques (see Note 4) require liquid nitrogen. 8. HPLC system consisting of two high-pressure pumps (for carotenoids) or one pump (for tocopherols), a sample injector with a 20-ML dosing loop, or (optional) an auto-sampler preferably with cooling option; RP-18 column (250 × 4.6 mm i.d., 5-Mm particle size); for carotenoids, a UV/Vis variable wavelength detector or photodiode array detector (optional) and for tocopherols, a fluorescence detector (see Note 5) and data collection and integration software. 2.3.7. Analysis of Water-Soluble Antioxidants and Their Redox State: GSH and GSSG
All chemicals used should be of analytical grade quality; all aqueous solutions should be made up with double-distilled H2O. 1. Extraction medium: 0.1 M HCl containing 0.5% Nonidet or Triton X-100 (the addition of detergents is optional, but can enhance the extraction efficiency). 2. 3 mM DL-DTT. Prepare fresh daily. 3. PVPP. 4. 2-(N-cyclohexylamino)ethanesulfonic acid (CHES) buffer: 200 mM CHES buffer containing 1 mM EDTA (optional, to remove any redox-active metals that may be present). Adjust to pH 9.3 with 10 M NaOH. Note that the mixture of 400 ML sample extract and 600 ML CHES buffer must have a pH between 8 and 8.3, which is the optimal pH range at which monobromobimane (mBBr) binds to thiols. If the pH of the mixture lies outside of this range, adjust the pH of the CHES buffer accordingly. 5. 50 mM N-ethylmaleimide (NEM) dissolved in 2-propanol (see Note 6). 6. 15 mM mBBr dissolved in acetonitrile (see Note 6). 7. 0.25% (v/v) methanesulphonic acid (MSA). 8. Thiol standards: Stock solutions of 1 mM GSH, 0.1 mM cysteine, 0.1 mM G-glutamyl-cysteine, and 0.1 mM cysteinylglycine prepared in 0.1 M HCl. In addition to GSH, some plant families contain GSH homologues. For example, the Poaceae and Leguminosae, respectively, contain hydroxylmethyl glutathione (G-glutamyl-cysteinyl-serine) and homoglutathione (G-glutamyl-cysteinyl-B-alanine). Standards of GSH homologues can be obtained from Bachem (St Helens, Merseyside, UK). Aliquots of standard solutions can be shockfrozen in liquid nitrogen and stored at −80°C, but thaw only once and discard the remainder. 9. HPLC solvent A: 0.25% (v/v) acetic acid. Make up with doubledistilled water, adjust to pH 3.9 with 10 M NaOH, and filter
20
Analyses of Reactive Oxygen Species and Antioxidants in Relation…
349
through a 0.2-Mm Millipore filter before use. Solvent B: HPLCgrade methanol. 10. HPLC system consisting of two high-pressure pumps (see Note 7), a sample injector with a 20-ML dosing loop, or (optional) an auto-sampler with cooling option; an RP-18 column (250 × 4.6 mm i.d., 5-Mm particle size; for example, an HiQsil C18V column from KyaTech, Japan); a fluorescence detector (see Note 5); and data collection and integration software. 2.3.8. Analysis of Water-Soluble Antioxidants and Their Redox State: Ascorbate and Dehydroascorbate
All chemicals used should be of analytical grade quality; all aqueous solutions should be made with double-distilled H2O. 1. Extraction medium: 1 mL 1.5% (w/v) metaphosphoric acid containing 1 mM EDTA disodium salt dihydrate. 2. 1,2-phenylenediamine dichloride (1 mg per 1 mL water). 3. 0.2 M aqueous Tris. 4. HPLC solvent: Methanol:water (1:3; v/v; HPLC grade) containing 1 mM hexadecyltrimethylammonium bromide and 0.05% (w/v) sodium dihydrogen phosphate monohydrate. Adjust pH to 3.6 by the addition of 85% (w/v) ortho-phosphoric acid. 5. HPLC system consisting of a pump, a sample injector with a 20-ML dosing loop, or (optional) an auto-sampler with cooling option; RP-18 column (250 × 4.6 mm i.d., 5-Mm particle size); photodiode array detector (alternatively, the analyte can be injected twice using different wavelengths for data collection); and data collection and integration software.
2.4. Markers of Oxidative Stress 2.4.1. Marker of Lipid Peroxidation: Malondialdehyde 2.4.2. Marker of Lipid Peroxidation: Conjugated Dienes
1. Thiobarbituric acid (TBA)–trichloroacetic acid (TCA) solution: 0.5% (w/v)–20% (w/v). 2. Temperature-controlled water bath, spectrophotometer, and appropriate consumables, such as cuvettes.
1. Chloroform, ethanol, gaseous nitrogen. 2. EDTA: 5 mM EDTA stabilized with NaCl 1% (w/v). 3. Spectrophotometer and appropriate consumables, such as cuvettes.
3. Methods We first offer several methods for the assessment of intracellular ROS so that the users can choose the most appropriate one for their experimental system or according to the availability of equipment
350
C. Bailly and I. Kranner
and chemicals. Many different methods exist to assess the contents of H2O2 and O2s¯ in plant tissues, but the ones we outline here have been successfully used in seeds of various plant species and are reliable. Nonetheless, it must be noted that accurate ROS measurements require careful attention, caution, and practice because of their reactivity with other compounds, which may alter their accurate estimation (4). The methods described here are either spectophotometric for H2O2 (the DMAB-MBTH method; 5) and O2s¯ [the hydroxylamine method; 6) or based on light emission for H2O2 [the chemiluminescence method, 7). Moreover, ROS can also be produced extracellularly by cell wall-bound enzymes and released into the apoplast, where they play important roles in cell-to-cell signalling. Evidence is emerging that the relatively long-lived O2s¯ and H2O2 are likely candidate ROS involved in extracellular signalling. Methods for the assessment of extracellular H2O2 production (8) and O2s¯ (9–11) are included. Attention is also given to the localization of ROS either at the tissue or at the cellular level. This can be particularly useful for studying the involvement of ROS in germination or in other seedspecific processes, such as endosperm weakening. Specific methods for localization of H2O2 (12–14) and O2s¯ (15) are provided, but we also describe a method for general ROS localization with DCFHDA (16), a compound that can be oxidized by various oxidative species (17) and may be used to give an indication of oxidative stress. The next section of this chapter describes methods for the analyses of antioxidant enzymes and low-molecular-weight antioxidants that can scavenge ROS individually or in cooperation, where they are intricately involved in complex ROS-processing and ROSscavenging biochemical cascades. Assays for enzyme activity are included for the ROS-processing enzymes, SOD (18), CAT (19), GR (20), and APX (21). The regulation of most of these enzymes in seeds is mainly transcriptional, and the estimation of activities can also give insights into gene expression (22). For low-molecularweight antioxidants, particular attention is given to the determination of the antioxidant redox state, concentrating on the redox couples of the most abundant intracellular water-soluble antioxidants, GSH/GSSG (23, 24) and AA/DHAA (25). In addition, protocols for the determination of lipid-soluble antioxidants (tocopherols and carotenoids) are included (26). Most carotenoids have antioxidant properties; they can quench ROS or dissipate excess light energy, but their importance goes beyond photosynthesis and participating in oxidative stress responses. For example, they are required for abscisic acid synthesis. Hence, this protocol may be useful for studies into the hormonal control of seed longevity, dormancy, and germination. In addition, some seeds may also contain chlorophyll or chlorophyllids in their cotyledons or the seed coat which can be co-identified with carotenoids. Please note that the
20
Analyses of Reactive Oxygen Species and Antioxidants in Relation…
351
procedures for seed handling (freeze drying, storage, and grinding) are only described once in the protocol for extraction of lipid-soluble antioxidants, but also apply to the protocols for water-soluble antioxidants. Finally, methods for the analyses of markers of oxidative stress are given with a focus on lipid peroxidation, as lipids are among the major targets of ROS attack in cells (determination of protein oxidation is dealt with in Chapter 14). We provide methods for the detection of lipid peroxidation by-products, such as malondialdehyde (MDA) (27) and conjugated dienes (28). We generally recommend using all chemicals of the highest purity available, in particular for HPLC analyses. For the latter, all aqueous solutions must be made up with double-distilled water. Unless indicated otherwise, all required chemicals can be purchased from Sigma-Aldrich or Fisher. 3.1. Determination of ROS 3.1.1. Hydrogen Peroxide Determination: DMAB/ MBTH Method
1. Seeds (see Note 8) are ground in an ice-cold mortar and homogenized with 0.2 M perchloric acid (approximately 0.1 g dry weight (DW)/mL). 2. After 15 min of centrifugation at 13,000 × g at 4°C, the resulting supernatant is neutralized to pH 7.5 with 4 M KOH (see Note 9) and then centrifuged at 1,000 × g for 3 min at the same temperature. 3. The supernatant is immediately used for spectrophotometric determination of H2O2 at 590 nm using a peroxidase-based assay. Mix 950 ML H2O, 400 ML of 12 mM DMAB, and 80 ML of 1.3 mM MBTH in a spectrophotometer cuvette and then make the blank at 590 nm. Fifty microlitres of the extract are then added, the absorbance of the mixture is noted, and the reaction is initiated by the addition of 20 ML of HRP. The increase in absorbance at 590 nm is monitored after 5–10 min at 25°C and compared with the absorbance obtained with known amounts of H2O2 (to be introduced in the reaction mixture instead of the extract). The relationship between absorbance and H2O2 concentration should be linear between 1 MM and 0.5 mM and allow calculation of the amount of H2O2.
3.1.2. Hydrogen Peroxide Determination: Luminol Method
1. Grind seeds in liquid nitrogen and homogenize in TCA (0.1 g DW/mL TCA) and then centrifuge for 15 min at 14,000 × g and 4°C. 2. Mix 0.5 mL of the supernatant with 0.5 ml of TCA and 0.5 g of Dowex previously equilibrated for 5 min with TCA. After 5 min of gentle agitation, centrifuge the mixture for 15 min at 14,000 × g and 4°C. 3. Mix 100 ML of the supernatant with 700 ML of NaOH and 100 ML of luminol in a glass test tube. Record light emission using a luminometer for 10 s and then inject 50 ML FeCN into
352
C. Bailly and I. Kranner
the tube. Light emissions of seed samples are typically measured during 60 s and compared to those obtained using solutions of various concentrations of H2O2 in TCA to produce a standard curve. 3.1.3. Analysis of Extracellular Hydrogen Peroxide Production: Xylenol Orange Assay
1. Shake seeds in distilled water for 30 min (or longer, depending on the experiment and species used). If isolated embryonic axes are used, note that axis excision induces an oxidative burst that may include H2O2. The number of seeds and the water volume need to be altered for each plant species. For pea-sized seeds, ten seeds incubated in 15 ml of distilled water may produce conveniently measurable H2O2 concentrations. For isolated axes, five axes incubated in 5 ml may provide suitable readings. 2. After 30 min, add a 0.6-mL aliquot of the leachate to 3 mL of working reagent and incubate for 15–20 min at room temperature. To measure H2O2 spectrophotometrically, record the absorbance of the resulting solution against a blank (3 mL of working reagent and 0.6 mL of water) at A560 and calculate the concentration using a calibration curve. 3. To test the specificity of the assay, H2O2 in seed leachates should be measured in the presence of 250 U/mL of CAT. Also include CAT in blanks.
3.1.4. Superoxide Determination: Hydroxylamine Method
1. Grind seeds (~0.2 g DW) in 4 mL of sodium phosphate buffer (pH 7.8, 50 mM) at 4°C. Centrifuge the extract at 16,000 × g for 15 min and use the resulting supernatant for O2s¯ determination. 2. Incubate 1 mL of the supernatant at 25°C for 30 min in the presence of 1 mM hydroxylamine hydrochloride. Then, incubate 0.5 mL of this reaction mixture with 0.5 mL of 17 mM sulphanilamide and 0.5 mL of 7 mM 2-naphtylamine at 25°C for 30 min. Measure the absorbance at 540 nm after centrifugation at 13,000 × g for 10 min, and calculate O2s¯ concentrations using a calibration curve obtained with solutions of various concentrations of sodium nitrite as described above.
3.1.5. Analysis of Extracellular Superoxide Production
1. For the epinephrine assay, shake seeds at 45 revolutions per minute in 15 mL of 1 mM epinephrine, pH 7.0 (if required, adjust pH with a pinch of NaHCO3), for 30 min at 25°C. For seed numbers and incubation volumes, follow the advice given in Subheading 3.1.3. 2. Using an aliquot of the incubation solution, record the O2s¯dependent oxidation of epinephrine to adrenochrome at A490 using an extinction coefficient (E) of 4.02/mM/cm (9). 3. For the XTT assay, incubate seeds in 15 mL of 0.5 mM XTT for 30 min at 25°C. In this assay, XTT is reduced by O2s¯ to
20
Analyses of Reactive Oxygen Species and Antioxidants in Relation…
353
a soluble formazan. Measure an aliquot of the incubation solution at A470 at pH 7.0 and then calculate O2s¯ concentrations (E = 21.6/mM/cm). If activities are low, reductants, such as 0.2 mM NADH, can be added to stimulate O2s¯ production. 4. To test the specificity of the assays, measure O2s¯ in the leachates in the presence of 250 units/mL SOD (see Note 10). 3.2. ROS Localization 3.2.1. Intracellular Hydrogen Peroxide Localization with Cerium Chloride
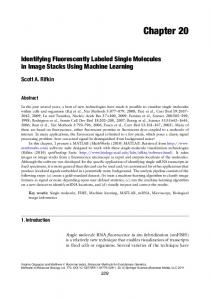
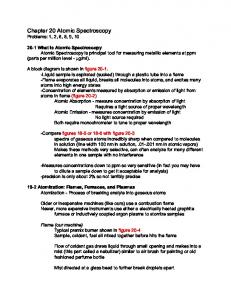
1. Imbibe seed sections (approximately 5 mm3) in 5 mM CeCl3 under vacuum until they are fully infiltrated. 2. Immediately fix CeCl3-treated sections and control sections (without staining) in 6% glutaraldehyde in 25 mM sodium phosphate buffer (pH 7.2) for 24 h at room temperature and then wash in the same buffer and postfix in 1% osmium tetroxide in 25 mM sodium phosphate buffer (pH 7.2) for 18 h at room temperature. 3. After several washes (3–4) in double-distilled water, progressively dehydrate the tissues in ethanol (successively 1 h each in 25, 50, 75, and 95% ethanol and three times 1 h each in 100% ethanol) and soak in propylene oxide/ethanol (v/v) for 1 h and three times (1 h each) in pure propylene oxide. Then, soak samples for 18 h in propylene oxide/Araldite® (3v/1v), 12 h in propylene oxide/Araldite® (v/v), 18 h in propylene oxide/ Araldite® (1v/3v), and 4 h in pure Araldite®. Embed samples in Araldite® at 60°C for 48 h. Section the blocks with a glass knife at 120 nm using a microtome, stain the sections with lead citrate and 2% uranyl acetate, and view with a transmission electron microscope (TEM). Hydrogen peroxide appears as black spots, which correspond to water-insoluble cerium perhydroxide precipitates formed after the reaction of CeCl3 with endogenous H2O2 (Fig. 1a).
3.2.2. Tissue Localization of Hydrogen Peroxide with TMB
1. Incubate seeds at room temperature in the dark for 15 min in 1% TMB in 1/10 McIlvaine buffer.
3.2.3. Hydrogen Peroxide Localization with Amplex® Red
1. Prepare 5 mL working solution of Amplex® Red by mixing 4.85 mL of potassium phosphate buffer, 50 ML Amplex® Red stock solution, and 100 ML HRP (10 units/mL).
2. Blue staining develops at the sites of H2O2 production.
2. Incubate seeds or hand-cut seed sections at room temperature in the dark for 15 min in the working solution. 3. Rinse samples three times for 5 min with potassium phosphate buffer. 4. View samples with a fluorescence microscope or confocal laser scanning microscope (excitation: 530 nm, emission: 590 nm).
354
C. Bailly and I. Kranner
Fig. 1. Localization of ROS in embryo tissues. (a) Sub-cellular localization of H2O2 in sunflower embryonic axes viewed by TEM after CeCl3 staining. H2O2 production is visualized as black spots corresponding to electron-dense cerium perhydroxide precipitates. Cw, cell wall; Lb, lipid body. Bar = 1 Mm. (b) Fluorescence imaging of ROS production sites in embryonic axes of sunflower seeds after treatment with DCFH-DA, visualized by confocal laser scanning microscopy. The intensity of fluorescence is proportional to ROS accumulation. Bar = 1 mm.
3.2.4. Superoxide Localization with NBT
1. Incubate seed material in 6 mM NBT in 10 mM Tris–HCl buffer (pH 7.4) at room temperature for 15–30 min. 2. Rinse with distilled water; O2s¯ is visualized as deposits of dark blue insoluble formazan compounds that can be seen at the tissue level. Intracellular deposits may be viewed using photon microscopy.
3.2.5. ROS Localization with DCFH-DA
1. Incubate seeds or hand-cut seed sections at room temperature in the dark for 15 min with DCFH-DA. 2. Rinse samples three times with buffer for 5 min each. 3. View sections or whole seeds with a fluorescence microscope or confocal laser scanning microscope (excitation: 488 nm, emission: 525 nm) (Fig. 1b).
3.3. Antioxidant Systems 3.3.1. Enzyme Extraction
1. Carry out all extraction steps at 4°C. Homogenize seeds (see Note 11) in a chilled mortar with extraction buffer in the presence of insoluble 20% PVPP (w/v). Vortex the homogenate for 1 min and centrifuge at 11,000 × g for 15 min. 2. Filter the supernatant through Miracloth and desalt on a Sephadex G25 column using 0.1 M potassium phosphate buffer (pH 7.8). The obtained extract is used for determination of enzyme activities. It can be stored at −30°C, but avoid numerous freezing/thawing cycles which lead to a decrease of enzyme activities.
20
Analyses of Reactive Oxygen Species and Antioxidants in Relation…
3.3.2. Enzyme Analysis: CAT
355
1. CAT (EC 1.11.1.6) activity is measured by following the decrease of absorbance of H2O2 at 240 nm. The enzyme assay contains 2.55 mL of 50 mM phosphate buffer (pH 7.0) and 200 ML of enzyme extract. 2. After making the blank, add 250 ML of H2O2 (final concentration 3.125 mM) and follow the decrease in absorption at 240 nm for 1 min. CAT activity is calculated using the molecular extinction coefficient of H2O2 at 240 nm (E = 43.6/mM/cm).
3.3.3. Enzyme Analysis: SOD
1. Activity of SOD (EC 1.15.11) is determined by the inhibition of NBT photo-reduction. The reaction mixture contains 2.2 mL of 0.1 M potassium phosphate buffer (pH 7.8), 0.25 mL riboflavin (final concentration 1.3 MM), 0.25 mL methionine (final concentration 13 mM), 0.25 ML NBT (final concentration 63 MM), and 50 ML of enzyme extract. 2. Immerse glass test tubes containing the reaction mixture in a temperature-controlled water bath at 25°C and illuminate with a fluorescent lamp. Identical tubes, which are not illuminated, serve as blanks. Measure absorbance at 560 nm after 15 min of illumination. One unit of SOD is defined as the amount of enzyme that inhibits NBT photo-reduction to blue formazan by 50% (the formation of blue formazan is evaluated by a reaction carried out without enzyme extract).
3.3.4. Enzyme Analysis: Glutathione Reductase
1. Glutathione reductase (EC 1.6.4.2) activity is estimated by following the rate of NADPH oxidation at 340 nm. The assay mixture contains 25 ML of GSSG (final concentration 10 mM), 50 ML of MgCl2 (final concentration 3 mM), 100 ML of extract, and 200 ML of 0.1 mM potassium phosphate buffer (pH 7.8). 2. Record the absorption of the blank, then start the reaction by adding 25 ML of NADPH (final concentration 0.5 mM), and follow the decrease in absorbance of NADPH at 340 nm for 15 min. Calculate GR activity using the molecular extinction coefficient of NADPH at 340 nm (E = 6.22/mM/cm).
3.3.5. Enzyme Analysis: APX
1. APX (EC 1.11.1.11) activity is measured by following the decrease of ascorbate absorbance at 290 nm. The enzyme assay contains 200 ML of extract in 680 ML of 50 mM potassium phosphate buffer (pH 7.0). 2. After making the blank, add 100 ML of ascorbate (final concentration 0.5 mM) and record the absorbance at 290 nm at 25°C for 5 min. APX activity is calculated using the molecular extinction coefficient of ascorbate at 290 nm (E = 2.8/ mM/cm).
356
C. Bailly and I. Kranner
3.3.6. Analysis of Lipid-Soluble Antioxidants: Tocopherols and Carotenoids
1. Freeze drying (optional): For each replicate of a study-specific treatment, weigh clean seeds and place them into a small paper bag. Put the safely closed paper bag into liquid nitrogen and freeze-dry immediately. Prior to freeze drying, intermediary storage for a few weeks in a deep freezer (preferably −80°C) is possible, but care must be taken that the samples do not thaw. After freeze drying, weigh the samples and record their dry weight. Do not expose freeze-dried seeds to ambient air humidity because humidity can oxidize the analytes (i.e. transport seed samples to a balance in a desiccator over silica gel). 2. At this stage, the seeds can be ground immediately or stored. For storage, put the paper bags with the seeds into a plastic bag with silica gel, remove the air from the plastic bag by applying a vacuum (if available), and seal the plastic bag. Repeat the procedure with a further plastic bag to ensure that the samples are not destroyed if one bag leaks. The samples can now be stored in a deep freezer until grinding. 3. Sample grinding with a ball mill: Large and hard seeds may need to be roughly crushed using mortar and pestle (do not use liquid nitrogen at this stage because this wets the seeds). Small seeds can be put directly into the Teflon grinding vessel together with agate balls. To avoid warming of the sample during grinding, submerge grinding vessel containing the seeds into liquid nitrogen for a few minutes. 4. Homogenize the sample using a ball mill. For most seeds, shaking at the maximum frequency is required. The duration of grinding depends on the seed used. For pea-sized seeds, homogenization is completed within 10–15 min. Before opening, let the grinding vessel adapt to room temperature in a desiccator over silica gel to avoid condensation of air humidity on the freeze-dried powder. 5. Transfer the powder into humidity-proof vials quickly (