Lance Armstrong's era of performance â part III: ... over time and that Armstrong's achievements will ..... (515 m) than the uncorrected heights (M = 1.091.
Chapter 6 : Armstrong's era part III
Chapter 6
Charly Gaul, 1950s
120
Chapter 6 : Armstrong's era part III
Lance Armstrong’s era of per formance — part III: Demonstrating the post hoc fallacy
Hein Lodewijkx
I n press: American Journal of Spor ts Science and Medicine, 4 (6), november 2013. http://mts.sciepub.com/AJSSM
121
Chapter 6 : Armstrong's era part III
Abstract In consequence of USADA’s charges, Lance Armstrong conceded he doped during his cycling career. The logic proposed in the post hoc fallacy entails that Armstrong’s sportive feats are therefore ‘caused’ by his doping use. This fallacy generalizes to the belief put forward in the doping debate that the progress in speed over time in professional cycling is determined by riders’ use of progressively potent doping agents. To examine this fallacy, the current study compared Armstrong’s mountain time trial wins, realized in the Tour de France (2001, 2004), to victories demonstrated by riders in similar trials uphill in the French race (1958–1996, N = 19). The fallacy expects that riders will race faster over time and that Armstrong’s achievements will be far superior to other riders. However, if these expectations are disconfirmed the fallacy will be refuted. We developed a climbing index to evaluate riders’ km/h performances: ClI = (Corrected altitude climb / Distance trial) . 100. Higher values indicate more demanding races. Mediation regression analyses showed that, over time, the trials became less demanding, b = -.0076 (∆R2 = .201, p ≤ .05), and that riders raced b = 0.201 km/h faster per year (∆R2 = .234, p ≤ .05). The index had a robust influence on riders’ speed (r = -.97) and they raced b = -2.302 km/h slower per unit of the index (∆R2 = .932, p ≤ .0001). The significant mediating influence of the index, b = 0.175 km/h (p ≤ .05), subsequently reduced riders’ progress in speed to a nonsignificant b = 0.026 km/h per year (p = .38, ∆R2 = .003). Furthermore, Armstrong’s performances did not prove to be outliers. Findings invalidate the reasoning employed in the post hoc fallacy, since the CLI and not the year in which riders competed constitutes the main determinant of riders’ mountain time trial performances. They also entail that Armstrong’s modern doping agents may not 123
have given him the proposed advantage over his forerunners who won trials before the 1990s, i.e., the years in which these potent aids were not yet rampant in professional road racing. Keywords Archival records, doping, professional road cycling, mountain time trial performances
Frederico Bahamontes, 1950s
Chapter 6 : Armstrong's era part III
1. Introduction
A
downpour of massive doping schemes has placed the professional cycling world in ill repute the last twenty years [1]. The most recent incident, evoking worldwide commotion, concerns American ex–professional cyclist Lance Armstrong. As a result of USADA’s allegations [2] [3], in January 2013 he acknowledged the use of epo, blood transfusions, and testosterone during his active cycling career. These banned doping agents are proposed to powerfully enhance performance, thereby contributing to, or even determining, the superior cycling feats demonstrated by the disputed American racer in his seven Tour de France victories [2] [3]. However, we doubt the soundness of this assertion, because we argue that it may constitute an instance of the post hoc ergo propter hoc fallacy (translation: after this, therefore because of this [4]). This post hoc fallacy reflects the erroneous belief that because there is a temporal sequence in events, one event is the cause of the other. Thus, Armstrong’s winning performances (“after this”) are assumed to be caused by his doping use (“because of this”). The current study aims to show that this flawed logic might apply when evaluating Armstrong’s winning performances, realized in mountain time trials in the Tour de France in 2001 and 2004. To this end, we compared his wins to victories demonstrated by riders in similar races uphill in the French race between 1958 and 1996. 1.1 Previous research
T
wo previous studies contrasted Armstrong’s time trial wins, demonstrated on flat and rolling terrain, to victories of other riders in comparable races. Surprisingly, they yielded no solid empirical evidence that his performances were significantly faster than his counterparts. Findings of both studies are summarized in Table 1. The first study [5] compared Armstrong’s performances to cyclists
who, from 1934 to 2010, won trials in the three European Grand Tours (Tour de France, Giro d’Italia, and Vuelta a España) and faced distances that were equivalent to Armstrong’s (50–61 km). The second study [6] contrasted his wins to time trial victories demonstrated by all former multiple Grand Tour winners (1949–1995; Coppi, Anquetil, Merckx, Hinault, Indurain) as well as all riders who won trials in the three tours from 2006 to 2011. The variation in trial distances in the latter study was much larger (8.2–137 km) than in the former. Both studies assessed riders’ mean kilometers per hour (km/h) performances as the dependent variable and they yielded practically identical results on this measure. The first row in Table 1 shows that, across time trials, Armstrong’s performances initially were faster than performances of the other riders, explaining 3–6.4% of the variation in speed. Only the first study yielded a significant rider main effect. Importantly, however, after statistically adjusting for the strongly confounding influence of the year in which riders competed, in both studies the speed differences between riders disappeared and the rider main effects explained trivial amounts of 0.1–1.3% of the variation in riders’ achievements. The positive relationship between year of competition and km/h performances accounted for a significant 41.3–57% of the performance differences between riders, indicating that riders progressively race faster over the years. Both studies further revealed that only one of Armstrong’s victories went beyond the very rigorous 68%–CI and none of them surpassed the bandwidth of the 95%–CI. 1.2 Research question: Demonstrating the post hoc fallacy
T
he latter findings imply that the wins of the American ex–cyclist cannot be regarded atypical or ‘abnormal.’ Besides, the slight amounts of variation explained by the (un)adjusted rider main effects in the two studies suggest that the time trial achievements 124
Chapter 6 : Armstrong's era part III American Journal of Sports Science and Medicine
Table 1.Summary of Findings of Studies Comparing Armstrong’s Time Trial Performances to Other Cyclists
Performance
this measure. The first row in Table 1 shows that, across time trials, Armstrong’s performances initially were faster than performances of the other riders, explaining 3–6.4% of the variation in speed. Only the first study yielded a significant rider main effect. Importantly, however, after statistically adjusting for the strongly confounding influence of the year in which riders competed, in both studies the speed differences between riders disappeared and the rider main effects explained trivial amounts of 0.1–1.3% of the variation in riders’ achievements. The positive relationship between year of competition and km/h performances accounted for a significant 41.3–57% of the performance differences between riders, indicating that riders progressively race faster over the years. Both studies further revealed that only one of Armstrong’s victories went beyond the very rigorous 68%–CI and none of them surpassed the bandwidth of the 95%–CI.
125
The latter findings imply that the wins of the American ex–cyclist cannot be regarded atypical or ‘abnormal.’ Besides, the slight amounts of variation explained by the (un)adjusted rider main effects in the two studies suggest that the time trial achievements of all riders are quite comparable and that, therefore, Armstrong did not strongly benefit from his doping use.
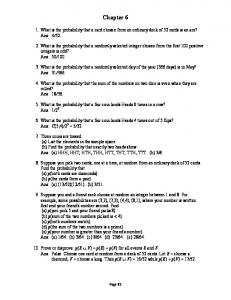
However, this conclusion may be criticized, since both studies revealed a significant yearly progress in riders’ speed. Armstrong won his trials between 1999 and 2005. Hence, the linear relationships could lead one to conclude that Armstrong indeed raced faster than his predecessors and that the doping agents he resorted to might have strongly contributed to these achievements [2, 3]. Although we rebutted this criticism extensively in foregoing papers [5-8], in the current study we will comment once more on this way of circular reasoning, because it might reflect the logic underlying the post hoc fallacy. The fallacy is illustrated in Figure 1. Armstrong’s victories can be seen as winning performances (WP) in Figure 1. He also used modern, ergogenic doping aids, labeled doping use in a certain year (DY) in Figure 1. The WP post hoc fallacy implies that WP (“after this”) is caused by Doping-induced winning perforDY DY (“because of this”). This reasoning generalizes to the mances and assoMore potent often heard opinion in discussions about effects of doping, ciated progress in and advanced riders' speed over suggesting that the progress in speed over the years in doping aids time. DY over time, be attributed to the use professional racing (WP) can over 1. Illustration postArmstrong's hoc fallacy to account for riders’ road winning performances time. determining of the(i.e., YearFigure of of progressively powerful and advanced banned doping-induced riders' wincompetition. substances (DY) [5-10]. The current study purports to mountain time trial ning perfor(i.e., riders' wins in 2001 and mances and show that this reasoning may be false by examining the trial wins in 2004) gains in 1934) relationship between the year in which riders’ competed speed. (DY) and their winning performances in mountain time trials (WP). If the relationship between DY and WP proves Competition year (1934 – 2004)
Chapter 6 : Armstrong's era part III
of all riders are quite comparable and that, therefore, Armstrong did not strongly benefit from his doping use. However, this conclusion may be criticized, since both studies revealed a significant yearly progress in riders’ speed. Armstrong won his trials between 1999 and 2005. Hence, the linear relationships we found, could lead one to conclude that Armstrong indeed raced faster than his predecessors and that the doping agents he resorted to might have strongly contributed to these achievements [2] [3]. Although we rebutted this criticism extensively in foregoing papers [5]-[8], in the current study we will comment once more on this way of circular reasoning, because it might reflect the logic underlying the post hoc fallacy. The fallacy is illustrated in Figure 1. Armstrong’s victories can be seen as winning performances (WP) in Figure 1. He also used modern, ergogenic doping aids, labeled doping use in a certain year (DY ) in Figure 1. The post hoc fallacy implies that WP (“after this”) is caused by DY (“because of this”). This reasoning generalizes to the often heard opinion in discussions about effects of doping, suggesting that the progress in speed over the years in professional road racing (WP) can be attributed to the use of progressively powerful and advanced banned substances (DY ) [5]-[10]. The current study purports to show that this reasoning may be false by examining the relationship between the year in which riders’ competed (DY ) and their winning performances in mountain time trials (WP). If the relationship between DY and WP proves to be nonexistent, than the logic employed in the post hoc fallacy is refuted. The foregoing Armstrong studies deliberately assessed his individual time trial achievements as the criterion to appraise his performances over the years, rather than focusing on his final km/h achievements in the seven Tours he won (1999–2005). Several historic studies [7] [8], which examined all first– ranking performances of riders in the Tour, Giro, and Vuelta from 1903 to 2011(N = 256), indicated once more that the accomplishments of the American
racer were not exceptional. However, these studies may suffer from a methodological flaw. Cyclists’ ultimate km/h performances, realized after three weeks of competition in multi–stage cycling races, cannot be considered individual performances, because they may be strongly affected by the (often inestimable) athletic efforts exerted by the group of riders participating in the races (the bunch or ‘peloton’). In individual time trials, riders’ efforts are not influenced by these confounding, coordinated peloton forces. In a time trial riders individually race for the fastest time, making it impossible to benefit from the joint labors of cooperating riders in the race through drafting (profiting from the slipstream other riders). Thus, in a time trial riders can only rely on their own athletic capabilities [5] [6] [11]. Therefore, we maintain that an assessment of these individual performances will increase chances to (indirectly) explore the impact of ergogenic doping agents on Armstrong’s cycling feats. Time trial racing constitutes one of the most demanding disciplines in professional road racing and, within this discipline, mountain time trials are a class on their own [11]. To critically evaluate findings and conclusions pertaining to the two previous Armstrong studies and to investigate the post hoc fallacy, the present research contrasted Armstrong’s winning performances in these demanding races to victories of other riders. The logic of the fallacy suggests an increase in riders’ speed over time. Moreover, given the proposed powerful ergogenic effects of Armstrong’s doping aids [2] [3], it further assumes that his km/h performances will be far superior to achievements of the other winners.
2. Method
2.1 Design and sample
M
ountain time trials are rarely scheduled in the three tours [11] [12] and the archival records of Magnier and co–workers [12] revealed that all in 126
127 Bahamontes Bahamontes Gimondi van Impe Zoetemelk Hinault Hinault Arroyo van Impe Fignon Bernard Delgado Rooks Breukink Ugrumov Berzin Armstrong Armstrong
-
1959 1962 1965 1977 1978 1979 1979 1983 1983 1984 1987 1988 1989 1990 1994 1996 2001 2004
(SD)
-
A. d’Huez
Ch.rousse (s)
V.d’Isère
Avoriaz
C. d’Engins
Orc.-Merl.
C. d’Engins
M. Ventoux
Ruchère
Avoriaz
P. de Dome
Avoriaz
S.bagnères
P. de Dome
Avoriaz
Revard (n)
S.bagnères
P. de Dome
M. Ventoux
Climb
28.85
(13.14)
14
(4)
15.5
32
30.5
47.5
33.5
39
38
36.5
22
15
15.6
54.2
23
52.5
14
26.9
18.5
12.5
21.5
16
11
8
19
12
15
13
18
16
19
15
15
2
14
15
18
13
15
18
Stage Distance
1.606
(0.349)
1.845
1.721
1.810
1.833
0.857
1.840
0.857
1.909
1.042
1.833
1.415
1.833
1.804
1.415
1.833
1.538
1.804
1.415
1.909
1.019
(0.292)
1.127
1.311
0.970
0.873
0.652
0.709
0.652
1.582
0.544
0.873
1.033
0.873
1.179
1.033
0.873
1.292
1.179
1.033
1.582
Cor. Altitude
6.0
(1.37)
7.8
6.5
4.2
6
3.3
5.1
3.3
7.1
4.5
6
7.5
6
6.3
7.5
6
6
6.3
7.5
7.1
Mean Slope
4.36
(2.26)
7.27
4.10
3.18
1.84
1.95
1.82
1.72
4.33
2.47
6.62
5.82
1.61
5.13
1.97
6.21
4.80
6.37
8.26
7.36
ClI
28.87
(5.56)
23.44
28.47
35.27
34.34
35.35
33.01
36.54
27.47
31.29
22.99
25.60
34.75
26.56
36.69
24.84
26.97
23.43
20.69
20.76
Mean Km/h
0:58:01
(0:18:20)
0:39:41
1:07:27
0:51:53
1:22:59
0:56:52
1:10:42
1:02:24
1:19:44
0:42:11
0:40:43
0:35:09
1:33:35
0:53:59
1:25:51
0:33:49
0:59:50
0:47:23
0:36:15
1:02:09
Mean Time
Notes: Distance and (corrected) altitudes are in kilometers. a Performances beyond ±68%-CI. b Performances beyond ±95%-CI.
M
Gaul
Rider
1958
Year
Altitude
28.87
(5.37)
22.75
29.98
31.95
34.99
34.64
34.91
35.11
29.06
33.27
23.69
25.54
35.12
27.03
34.27
24.49
27.41
23.71
19.28
21.34
Pred. Km/h
0
(1.41)
0.69
-1.51a
3.32b
-0.65
0.71
-1.81a
1.42
-1.60a
-1.98a
-0.70
0.07
-0.37
-0.47
2.42a
0.35
-0.43
-0.29
1.41
-0.59
Res. Km/h
Table 2. Descriptive Statistics of Riders’ Performances in Mountain Time Trials in the Tour de France (N = 19)
Chapter 6 : Armstrong's era part III
Chapter 6 : Armstrong's era part III all nineteen of these trials occurred in the Tour de France in the years following WW II (1958–2004). Records relating to the Giro and Vuelta supplied by [12] were incomplete, forcing us to restrict the examination of our research questions to riders’ performances in these nineteen trials. Magnier et al. [12] provided information concerning the winners of the trials, their mean km/h and time performances, as well as the names of the mountains and their altitudes, but they did not give details relating to the slopes of the climbs. We succeeded to retrieve this information from Codifava [13] and cross–checked it with data provided by Van Lonkhuyzen [14] and Ejnes et al. [15]. Table 2 presents descriptive statistics of the variables we measured. 2.2 Measurements
W
e took notice of the day at which the trials were scheduled during the Tours. The mean stage number indicates that, on average, the trials took place at the end of the second week of the three–week races (M = 14, SD = 4). The years of competition ranged from 1958 to 2004. In 1958, famous climber Charly Gaul won the first trial to the top of Mont Ventoux in the Provence. As Table 2 shows, Armstrong won the last two races uphill in 2001 and 2004. The mean distances of the trials amounted to M = 28.85 km. Note that there is a large between–trial variation in these distances (SD = 13.14 km) of which we come to speak below. French five–time Tour winner Bernard Hinault faced the longest and Spanish climber Frederico Bahamontes the shortest trial. The altitudes of the climbs varied between 0.857 km (Cote d’Engins) and 1.909 km (Mont Ventoux) with M = 1.606 km (SD = 0.349). However, reckoning our research questions, we doubted the validity of these altitudes, because cyclists faced less high elevations. Most of the trials are located at high mountains in the French Alps or Pyrenees, meaning that the riders did not start their races at sea level. However, the altitudes of the climbs are measured from sea level [14]. For instance, it is documented [15]
that Charly Gaul in his 1958–trial to Mont Ventoux started his race at Bédoin, a village located at the foot of the climb with an elevation of 327 m. The altitude of Gaul’s trial thus amounted to1.582 km and not 1.909 km. To validly evaluate riders’ achievements, we therefore accounted for the elevation at which riders began their trial. After scrutinizing various sources relating to the history of climbs in professional road racing [12]-[15], we estimated the corrected altitudes of the climbs. They were operationalized as the difference in km between the documented base of the climb (where riders started the race) and the top (where the finish line was drawn). Table 2 indicates that the corrected altitudes are substantially lower (515 m) than the uncorrected heights (M = 1.091 km, SD = 0.292). The average slope of the climbs is defined as the rise over the run: (rise of the climb / horizontal distance) . 100. The mean slopes amounted to M = 6% (SD = 1.37). Spanish rider and former Tour winner Pedro Delgado as well as Dutch time trial specialist Eric Breukink faced the ‘easiest’ climbs (Cote d’Engins, M = 3.3%). In 2004, Armstrong faced the steepest climb to the top of l’Alpe d’Huez (M = 7.8%). As regards the dependent variable, across the sample riders’ mean km/h performances amounted to M = 28.87 (SD = 5.56). On average, it took riders approximately one hour to finish the trials, i.e., 58 minutes and 1 second, or M = 00:58:01 (SD = 00:18:20). Note that both performance measures show a large variability, owing to the variation in the distances of the time trials to which we will attend to in the next section. 2.2.1 Climbing index
S
urprisingly, preliminary analyses revealed that larger distances of the trials are strongly associated with faster km/h performances, r = .83 (p ≤ .001). This can be explained by the fact that longer races may involve extended stretches of relatively flat roads, enabling riders to maintain higher speeds compared to trials in which riders instantly have to 128
Chapter 6 : Armstrong's era part III climb. Moreover, the correlation between the corrected altitude and riders’ km/h performances was significant, r = -.56 (p = .01), whilst the correlation with the uncorrected altitudes was not, r = -.38 (p = .11). The corrected altitudes thus appear to have better discriminatory value. Additionally, the strong distance–km/h performance relationship entails that we should control for this variable in order to validly address our research questions. Inspired by the research of El Helou and co–workers [9], we therefore developed a climbing index, also operationalized as the rise over the run. The rise concerns the corrected altitude in km and the run the total distance of the trial in km and it is expressed in percentages: ClI = (Corrected altitude / Distance trial) .100
Since longer trials involve less climbing kilometers, they are (relatively) less difficult for riders to maintain higher speeds. Therefore, we assume that higher values of the ClI designate more demanding trials in terms of riders’ instant climbing efforts. Table 2 presents descriptive statistics of the index: M = 4.36%, SD = 2.26. The strong interrelationships of the index with other variables make clear that the ClI accounts for the influence of the variation in distances of the trials on riders’ performances (r = -.85, p ≤ .001) as well as for the influence of the corrected altitudes (r = .54, p ≤ .05) and the slopes of the climbs (r = .64, p ≤ .01). Besides, the index correlates nearly perfectly with riders’ speed (r = -.97, p ≤ .001) explaining 94% of the variation between riders. For these reasons, we chose to attend to our research questions using two variables: The year in which riders competed, permitting an evaluation of Armstrong’s performances in 2001 and 2004, and the ClI. 2.3 Analyses
W
e examined our research questions using a mediation regression model (OLS, [16] [17]) with riders’ mean km/h performances as the criterion and competition year and the CLI as
129
predictor variables. The results of these analyses allow an evaluation of Armstrong’s doping–induced wins: “Are his performances predicted by competition year and the ClI or not, and do they constitute outliers?” If competition year proves to be the main predictor variable and Armstrong’s performances are statistical outliers as well, this will render the reasoning underlying the post hoc fallacy plausible. However, if these expectations are disconfirmed, the logic will be disproved. Consistent with previous studies [5] [6], we further used the stringent 68%– and 95%–CIs (±1SD or ±2SD from the sample mean, respectively) as the criterion to determine outliers. Conventionally, however, performances beyond ±3SD are considered outliers [18]. Last, we assessed whether influential cases biased the regression model. Analyses were conducted using IBM–SPSS (v. 20).
3. Results
3.1 Km/h performances
F
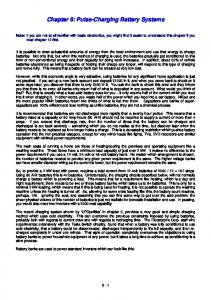
ollowing guidelines for mediation analyses provided by [16] [17] the regression analyses we conducted, involved four steps. Figure 2 summarizes findings of the analyses. The first step showed that the year in which cyclists competed is negatively related to the ClI, b = -0.076 (∆R2 = .201), indicating that the trials became less brutal over time. The second step revealed that competition year is positively related to riders’ mean km/h performances, b = 0.201 km/h (∆R2 = .234). Per year riders race 201 m faster. The third step indicated that the index has a strong negative influence, showing that riders race b = -2.302 km/h (∆R2 = .932) slower per unit of the index. In the fourth step we simultaneously entered competition year and the index in the regression equation. This step not only allows a test of the mediation effect of the index on the competition year–performance relationship, but also permits an estimation of the degree to which the influence of competition year on riders’ achievements is affected by the index. The lower panel in Figure 2 presents the results of the
b = 0.026 (0.030); β =.063 ∆R2 = .003
Mean km/h b (R = 20.026 (0.030); β adj = .927**) ∆R2 = .003
=.063
Mean km/h (centred) e( gemtij | X ) 0 1
2
b = 0.201 (0.088)*; β =. 48 ∆R2 = .234
‡
Mean km/h (R2adj = .927**)
-1
b = 0.201Competition (0.088)*; β =. 48 ∆R2 = year .234
b = -2.302 (0.174)** β = -.94 ∆R2 = .932
-1
Competition year
Climbing index
b = -2.302 (0.174)** β = -.94 ∆R2 = .932
Mean km/h (centred) e( gemtij | X ) 0 1
b = -0.076 (0.037)* β = -.45 ∆R2 = .201
3
riders’ performances, to which the index contributed by far the most. To conclude, as there is no solid evidence that riders race faster over time, our findings put great pressure on the logic underlying post hoc fallacy. b = -0.076the (0.037)* Climbing β = -.45 index ∆R2 = .201
2
4
3
dependent variable, i.e., 0.201 - 0.175 = 0.026 km/h. The American Journal of Sports92.7% Science andof Medicine two variables jointly explained the variation in riders’ performances, to which the index contributed by Figure 3A effect of the index ultimately resultedToin conclude, far the most. as thereera is part no solid Chapterthe6 adjusted, : Armstrong's III evidence nonsignificant influence of the competition year on the that riders race faster over time, our findings put great dependent variable, i.e., 0.201 - 0.175 = 0.026 km/h. The on theoflogic underlying the post hoc fallacy. two variables jointly pressure explained 92.7% the variation in
‡
-2
-2
* p ≤ .05; ** p ≤ .001
Figure 2. Mediation model explaining differences in riders’ km/h performances. Presented are unstandardized regression * p ≤ .05; ** p ≤ .001of variables * p ≤ .05; ** p ≤ .001 -20 -10 0 10 20 30 0 weights (b) and associated standard errors (SEb) in parentheses and standardized (β) weights. Year As to km/h performances, -20 b and SEb-10 are of competition Figure 2. Mediation model of variables explaining differences in riders’ Year of com Figure 2. Mediation model of variables explaining differences in riders’ km/h performances. Presented are unstandardized regression weights (b) kilometers per hour per year, or in kilometers per hour per unit of the climbing index. The unadjusted relationship between year of American Journal of in Sports Science and Medicine km/h Presented are(β) unstandardized regression weights (b) and associated standard errors (SEperformances. standardized b) in parentheses and weights. As to km/h performances, and SEtype are inface. kilometers per(SE hour competition and km/h performances inb bold The broken indicatesand a mediated relationship. b standard andisassociated errors in parentheses standardized (β) b) arrow per year, or in kilometers per hour perAs unit ofkm/h the climbing index. Theb and SE are in kilometers per hour weights. performances, b Figure 3B 3A year to unadjusted relationshipFigure between of competition and km/h per year, or in kilometers per hour per unit of the climbing index. The performances is in bold type face. The broken arrow indicates a mediated unadjusted relationship between year of competition and km/h relationship. performances is in bold type face. The broken arrow indicates a mediated
Figur
6
relationship. 3.2 Outliers and normality
8
8
4
resulted in the adjusted, competition year on the 0.175 = 0.026 km/h. The 92.7% of the variation in he index contributed by ere is no solid evidence , our findings put great he post hoc fallacy.
6
4
4
2
0 -2
-4
Mean km/h (centred)
2
0 -2
-10
-8
-6
-2
-10
-8
-1
-6
-4
Mean km/h (centered) Mean km/h (centred)
8
)
2
4
6
y
information concerning performances, which are umns of Table 2. The ables, r = .00, indicates a model. Residuals give an
2
Mean km/h (centred) e( gemtij | X ) 0 1
Mean km/h (centered)
3
The analyses further yielded information concerning riders’ predicted and3.2 residual performances, are Outliers and which normality presented in the last two columns of Table 2. The The analyses further yielded information concerning correlation between the two variables, r = .00, indicates a very good fit of the regression model. Residuals an riders’ predicted and give residual performances, which are b = -2.302 (0.174)** indication which performances are not‡ predicted by the presented in the last two columns of Table 2. The β = -.94 varriables included in the regression model and, therefore, ∆R2 = .932 between two variables, r = .00, indicates a permit us to evaluate correlation which performances maythe constitute very3Bgood fit regression of the regression model. Residuals give an outliers. Figure 3A and present plots of riders’ predicted performances withwhich 68%– and 95%–CIs. indication performances are not predicted by the Table 2 and the figures show that one of Armstrong’s varriables included in the regression model and, therefore, wins surpassed the 68%–CI and it concerns his 2001 trial β =. 48 permit us to evaluate which performances may constitute‡ to Chamrousse in the French Alps. However, in this trial Mean km/h 3Aslower and than 3B present regression plots of he did not perform outliers. faster, but Figure 1.51 km/h (R2adj = .927**) predicted. In his 2004riders’ trial to l’Alpe d’Huezperformances he raced 690 with 68%– and 95%–CIs. β =.063 predicted ‡ performance did not m faster than predicted. Yet, this Table 2 and the figures show that one of Armstrong’s even surpass the 68%–bandwidth. Hence, regarding our surpassed 68%–CIofand it concerns his 2001 trial research questions, wewins conclude that the the achievements ‡ the American racer doto notChamrousse constitute outliers. in the French Alps. However, in this trial 2 and Figures 3A further indicate that but 1.51 km/h -20Table-10 0 203B perform 30 -3 -2slower -1 0than1 2 3 4 5 he 10 didandnot faster, Year of competitionthe 68%–CI. Three of them four other riders exceeded explaining differences in riders’ Climbing index predicted. In his 2004 trial to l’Alpe d’Huez he raced 690 dardized regression weights (b) performed thanof predicted: French riders Laurent Figure 3A and 3B. Plot of3B: riders’ mean km/h performances Figureslower 3A: Year competition Figure Climbing index (CLI) regressed arentheses and standardized (β) m Bernard faster (1987) than and predicted. Yet, this performance did not Fignon (1984) and Jeff Dutch cyclist on year of competition and the climbing index. Dotted lines indicate the SEb are in kilometers per hour 68%-CI and broken lines the 95%-CI. Steven Rooks (1989).even In 1978, Dutchthe rider68%–bandwidth. and former surpass Hence, regarding ourOpen dots () present Berzin’s nit of the climbing index. The Figure 3B performance beyond the 95%-CI and double daggers (‡) Armstrong’s Tour winner Joop Zoetemelk performed faster than of competition and km/h research questions, we conclude that the achievements of Figure 3A and 3B. Plots of riders’ mean km/h performances regressed on year of competition and thecentred climbing Dotted lines performances. Negative values of the meanindex. km/h indicate oken arrow indicates a mediated predicted on his climb of Puy de Dome in the Massif sloweroutliers. performances. the American racer do not constitute indicate the 68%-CI Central. and broken lines the 95%-CI. Open dots (○) present Berzin’s performance beyond the 95%-CI and double daggers Table Figuresmean 3A km/h and 3B further indicate that -3 -2 -1 (‡) Armstrong’s performances. Negative values2ofand the centered indicate slower performances.
four other riders exceeded the 68%–CI. Three of them performed slower than predicted: French riders Laurent Fignon (1984) and Jeff Bernard (1987) and Dutch cyclist Steven Rooks (1989). In 1978, Dutch rider and former Tour winner Joop Zoetemelk performed faster than
0
Climbin
Figure 3A and 3B. Plot of riders’ me on year of competition and the climbing 130 68%-CI and broken lines the 95%-CI. performance beyond the 95%-CI and
Chapter 6 : Armstrong's era part III
0.75 0.50 0.25 0.00
Expected probability
Expected probabillity
1.00
American Journal of Sports Science and Medicine
0.00
0.25
0.50
0.75
1.00
Observed km/h
Observed km/h
0.00
0.25
0.50
0.75
1.00
Residual km/h
Residual km/h
Figure 4. Normal probability plots of riders’ observed and residual km/h performances.
Figure 4. Normal probability plots of riders’ observed and residual km/h performances.
Only one of the nineteen cyclists went beyond the fourth step. The resulting unstandardized b = 0.026 95%–CI in his performance, it concerns Russian rider 2 km/h (∆R = .003) indicates 26 m Yevgeni Berzin in the 1996 trial tothat Val riders d'Isère raced in the Alps. faster per year. relationship is not (p Although we This utterly realize that thesignificant number of observation far too low estimate in whether = .38) andisexplains 0.3%toofreliably the variation riders’ riders’ predicted residual performances km/hobserved, performances. Theand fourth steptime further revealed depart from normality, we did evaluate that the ClI fully mediated the competition these year– performances. They all appeared to be normally performance relationship (z = 2.10, p ≤ .05) and distributed (Kolmogorov–Smirnov tests, zs ≤ 0.71, ps ≥ accounted forthere a substantive part of the variationfast in .70), indicating are no signs of any ‘abnormal’ relationship, b = 0.175 km/h. the mediating orthis slow performances among theThus, riders, including effect of theTo index the adjusted, Armstrong’s. giveultimately examples,resulted Figure 4inillustrates the normal probability influence plots of riders’ observed and year residual nonsignificant of competition on performances. the dependent variable, i.e., 0.201 - 0.175 = 0.026
km/h. The two variables jointly explain 92.7% of the variation in riders’ performances, to which the index Relative to by thefar other Armstrong’s of theis contributed the riders, most. To conclude,win as there 2004 trial to l’Alpe d’Huez yielded a large leverage value, no solid evidence that riders race faster over time, our h = 0.47, suggesting that this specific performance might findings great pressure logic slope underlying have had anput undue influence onon thethe negative of the the post line, hoc fallacy. regression owing to the fact that his predicted speed
3.3 Influential cases
strongly deviated from the mean predicted speed. This performance can be seen in Figure 3B (bottom right) and, 3.2 Outliers and normality again, it reveals a comparatively ‘slow’ achievement of the American racer. To further check whether his achievements he analyses yielded information biased our findings in any way, we conducted auxiliary concerning riders’ predicted and residual regression analyses and excluded Armstrong’s performances,The which are presented in the previous last two performances. results closely matched columnsThe of influence Table 2. The correlation between two findings. of year of competition (b =the 0.033 km/h, p = .49) and the ClI (b = -2.305 km/h, p ≤ .001) slightly departed from the weights presented earlier. The same is true for the total R2adj = .928 (p ≤ .001). 131 Accordingly, Armstrong’s leverage on the overall regression findings appears to be very small. Moreover,
T
4. Discussion variables, r = .00, indicates a very good fit of the The logic underlying the post hoc fallacy suggested an regression model. increase in speedan in riders’ which mountain time trial Residuals give indication performances performances over the years and, given the are not predicted by the variables included in proposed the repowerful ergogenic effects of Armstrong’s doping aids, it gression model and, therefore, permit us to evaluate further assumed that his performances would be superior which performances outliers. Figure to achievements of themay otherconstitute winners we included in our 3A and 3B of riders’ predictsample. Ourpresent findings,regression however, plots are inconsistent with this logic. After controlling for theand influence of the ClI on ed performances with 68%– 95%–CIs. Table 2 riders’ accomplishments, there is no evidence that riders and the figures show that one of Armstrong’s wins raced significantly over time. Moreover, surpassed the 68%–CIfaster and it concerns his 2001 trial Armstrong’s wins in 2001 and 2004 did not appear to be to Chamrousse in the French Alps. However, in this superior, but rather extremely comparable to the trial he did not perform km/h slowachievements of the other faster, riders. but As a1.51 matter of fact, his er than predicted. his comparatively 2004 trial to l’Alpe d’Huezall performances cameInout slow. What he raced 690 mentail fasterfor than predicted. doping–induced Yet, this perthese findings Armstrong’s wins will be later sections, after a discussion formance didaddressed not eveninsurpass the 68%–bandwidth. of the validity of ourour study. Hence, regarding research questions, we conclude that the achievements of the American racer 4.1 Validity do not constitute outliers. Although our observations our regression Table 2 and Figures 3A revealed and 3B that further indicate model is valid and stable, this does not mean to say that that four other riders exceeded the 68%–CI. Three of there are no factors that may have threatened the internal them performed slower These than predicted: Frenchconcern riders validity of the study. factors mainly Laurent Fignon (1984) and Jeff Bernard and operationalizations and measurements of the (1987) variables we Dutch cyclist Steven Rooksthe (1989). In 1978, Dutch used. We already mentioned problems relating to the altitudes the climbs. one Zoetemelk might not suspect rider andofformer Tour Although winner Joop perthis, there is also disagreement about the of slopes. For formed faster than predicted on his climb Puy de
instance, according to some sources the altitude of l’Alpe d’Huez is1860 m and not 1845 m, and the documented slopes vary between 7.7% and 8.7%. Moreover, there is the additional problem that the corrected altitudes we estimated do not have to agree with the exact spot at which the start and finish lines were drawn in the various
Chapter 6 : Armstrong's era part III
Dome in the Massif Central. Only one of the nineteen cyclists went beyond the 95%–CI in his performance, it concerns Russian rider Yevgeni Berzin in the 1996 trial to Val d’Isère in the Alps. Although we utterly realize that the number of observation is far too low to reliably estimate whether riders’ observed, predicted and residual time performances depart from normality, we did evaluate these performances. They all appeared to be normally distributed (Kolmogorov–Smirnov tests, zs ≤ 0.71, ps ≥ .70), indicating there are no signs of any ‘abnormal’ fast or slow performances among the riders, including Armstrong’s. To give examples, Figure 4 illustrates the normal probability plots of riders’ observed and residual performances. 3.3 Influential cases
R
elative to the other riders, Armstrong’s win of the 2004 trial to l’Alpe d’Huez yielded a large leverage value, h = 0.44, suggesting that this specific performance might have had an undue influence on the negative slope of the regression line, owing to the fact that his predicted speed strongly deviated from the mean predicted speed. This performance can be seen in Figure 3B (bottom right) and, again, it reveals a comparatively ‘slow’ achievement of the American racer. To check whether his achievements biased our findings in any way, we conducted auxiliary regression analyses and excluded Armstrong’s performances. The results closely matched previous findings. The influence of year of competition (b = 0.033 km/h, p = .49) and the ClI (b = -2.305 km/h, p ≤ .001) slightly departed from the weights presented earlier. The same is true for the total R2adj = .928 (p ≤ .001). Accordingly, Armstrong’s leverage on the overall regression findings appears to be very small. Moreover, we note that it involved a relatively slow and not a conspicuous fast performance, which fell within the bandwidth of the 68%–CI. Importantly, Armstrong’s performances did not alter our main
finding concerning the post hoc fallacy. Whether or not we included his wins in the analyses, after controlling for the robust effect of the ClI, competition year turned out to yield an almost negligible influence on riders’ mountain time trial achievements.
T
4. Discussion
he logic presented in the post hoc fallacy suggested an increase in speed in riders’ mountain time trial performances over the years and, given the proposed powerful ergogenic effects of Armstrong’s doping aids, it further assumed that his wins would be superior to achievements of the other winners we included in our sample. Our findings, however, are inconsistent with this logic. After controlling for the influence of the ClI on riders’ accomplishments, there is no evidence that riders raced significantly faster over time. Moreover, Armstrong’s wins in 2001 and 2004 did not appear to be superior, but rather extremely comparable to the achievements of the other riders. As a matter of fact, his performances came out comparatively slow. What all these findings entail for Armstrong’s doping–induced wins will be addressed in later sections, after a discussion of the validity of our study. 4.1 Validity
A
lthough our observations revealed that our regression model is valid and stable, this does not mean to say that there are no factors that may have threatened the internal validity of the study. These factors mainly concern operationalizations and measurements of the variables we used. We already mentioned the problems relating to the altitudes of the climbs. Although one might not suspect this, there is also disagreement about the slopes. For instance, according to some sources the altitude of l’Alpe d’Huez is 1860 m and not 1845 m, and the documented slopes vary between 7.7% and 8.7%. Moreover, there is the additional problem that the 132
Chapter 6 : Armstrong's era part III
corrected altitudes we estimated do not have to agree with the exact spot at which the start and finish lines were drawn in the various time trials. Whenever we encountered such problems, we decided to check at least three different sources [12]-[15]. In cases in which two of the three sources showed agreement on a certain value, we included this value in our measurements. If all three sources disagreed, we decided to include the value in between. Besides, the measurement of the distances of the time trials and the related mean km/h and time performances, recorded in the early years of the French race, might also be unreliable. During these years, time for example was sometimes registered by hand [15] and, obviously, this may have consequences for the computation of riders’ speed. The same argument holds for the distance of the stages. Thus, in some cases our measurements may be unreliable. However, they only constitute sources of random error; they did not introduce systematic errors in our study. Then again, we have seen that the corrected altitudes predicted riders’ km/h performances better than the uncorrected altitudes. Furthermore, the ClI, which we based on the corrected altitudes, had a robust influence on riders’ performances over time. As a single variable, the index explained 94% (r = -.97) of the variation in riders’ speed, adding validity to our findings and conclusions. 4.2 The post hoc fallacy
T
his brings us to critically appraise Armstrong’s doping–induced wins. Our regression findings designated that, in first instance, there is a significant yearly progress in riders’ speed from 1958 to 2004. Since Armstrong won the last two trials in 2001 and 2004, this relationship could lead one to conclude that he indeed raced faster than the other riders did and that the doping agents he used probably contributed to his superior achievements. However, since the ClI fully mediated the relationship between competition 133
year (DY in Figure 1) and riders’ performances (WP), it follows that the (causal?) relationship between the two variables is nonexistent. This means that competition year (and doping use associated with it) is irrelevant as an explanatory variable to account for differences in riders’ speed, at least where it concerns riders’ individual exploits in mountain time trials in the Tour de France. Accordingly, these observations convincingly demonstrate the false way of thinking used in the post hoc fallacy: The main determinant of riders’ performances is the CLI, not the year in which riders won their trial. After controlling for the mediating influence of the index, findings further revealed that competition year accounted for a minor and nonsignificant 26 m improvement in riders’ performances per year, which explained 0.3% of the speed differences between riders. There is the possibility that these minimal improvements may have been influenced by riders’ doping use over the years. However, if this assumption is valid, it would imply that Armstrong’s advanced doping agents did not give him the advantage over the other riders as suggested by [2] [3]. After all, 78% of the riders in our sample demonstrated their feats before the 1990s, that is, in a period in which the use of Hb-augmenting doping aids (epo and blood doping) was not yet rampant in professional road racing [7]-[10]. Most of the riders we investigated thus lacked the assumed benefits of the modern ergogenic doping agents, which were available to Armstrong and the other riders in the years of the ‘epo epidemic’ and thereafter [7] [8]. Additionally, it is also conceivable that the effects of doping can be detected in the unexplained amount of variation in riders’ winning performances (7.3%), which is not accounted for by competition year or the ClI. Yet, we argue that this is not a cogent argument either. The residuals appeared to be normally distributed, Armstrong’s performances came out comparatively slow, and neither of them surpassed the 95%– CI. Moreover, there are numerous variables which
Chapter 6 : Armstrong's era part III may plausibly account for these unexplained differences besides doping use. For example, meteorological conditions (wind, heat, rain) during the trials may have strongly influenced riders’ speed. Furthermore, the profiles and the irregularity of the climbs vary strongly [15] [19]. Compared to l’Alpe d’Huez, Mont Ventoux and Puy de Dome for instance, are known to be much more demanding climbs, characterized by regularly occurring abrupt steep ascents of 12–14% [13]. This impedes riders’ efforts to maintain a steady pace while climbing, which may negatively influence their performances. Then again, improvements in the condition of the roads, and technological innovations in the weight and aerodynamics of the bikes and gearing equipment over the years, may have positively affected riders’ achievements. The same argument holds for the profiles and distances of the Tours in which riders competed, which improved over the years, thereby facilitating riders’ speed [7] [8] [11] [15]. 4.3 Overestimated effects of epo?
A
ll these observations lead us to conclude that the performance–enhancing effects of the doping aids Armstrong resorted to might not be as powerful as assumed. This conclusion does not agree with Lundby and Olsen’s study [20]. They reviewed results of laboratory studies which assessed the relationship between epo administration and participants’ improvements in aerobic exercise capacity, measured by maximum oxygen uptake (VO2max), defined as an estimate of cardio–respiratory, circulatory and muscular fitness that measures the fastest rate at which oxygen can be utilized by the body during intense exercise. They estimated epo effects of 8–12% on exercise capacity. As to blood doping the estimations are 5–10% [21]. Conversely, however, findings of all three Armstrong studies conducted thus far are consistent with other, more critical research which concluded that the effects of Hb-augmenting doping aids on cyclists’ endurance performances
are overestimated [22] [23] and even lack scientific evidence [24]. To critically examine the strength of the epo doping–aerobic performance relationship, Lodewijkx et al. [25] conducted a meta–analysis on findings of seventeen laboratory studies (19912010) that hitherto investigated this relationship. The analysis revealed modest effect sizes of the experimental epo vs. control / placebo treatments: d = 0.41–0.49, r = .19–.44 and r2 = .04–.19. These findings entail that a considerable 81–96% of the differences in performance improvement observed in the studies cannot be explained by epo administration. The largest epo–induced improvement in VO2max found in the analysis equaled an increase in speed of about 1 km/h. Perneger [10] arrives at the same conclusion concerning this increase in speed. However, we emphasize that this slight increase is solely restricted to laboratory situations. It is a well–known fact that such improvements cannot be directly extrapolated to multi–stage cycling races that last three weeks [24]-[26]. All these observations imply that judgments pertaining to the strong ergogenic effects of epo on aerobic exercise capacity might be flawed. In turn, this entails that the relationship between epo doping and performances of cyclists at real contests is strongly overrated too. In our view, this overestimation constitutes the most parsimonious explanation for the null results we obtained regarding Armstrong’s expected superior time trial performances.
P
5. Conclusion
erhaps there remains only one variable which may plausibly explain our observations. It refers to the unique, physical propensities and related time–trial capacities of the very gifted riders we investigated, from Charly Gaul in 1958 to Lance Armstrong in 2004. Our findings illustrate that these capabilities may be underestimated, in particular where it concerns riders who demonstrated their feats in mountain time trials in the early years of the Tour 134
Chapter 6 : Armstrong's era part III de France. These capabilities make the achievements of all riders comparable, not their doping use. Given the profound influence of the CLI, we further argue that our findings leave hardly any room for rival explanations, such as the effect of banned substances, to account for differences in riders’ performances over time. Obviously, we can never be sure about this conclusion, because we will never know how riders would have performed had they not taken refuge in doping. Last, and most importantly, our study demonstrates that false, circular logic, as put forward the post hoc fallacy, may hinder the exchange of arguments in the sometimes animated discussions about the (alleged) effects of doping in professional cycling.
References [1]
[2]
Dilger A., Frick B. and Tolsdorf F., “Are athletes doped? Some theoretical arguments and empirical evidence.” Contemporary Economic Policy, 25 (4): 604–615, 2007. Online available: doi: 10.1111/j.1465-7287.2007.00076 USADA, Statement from USADA CEO Travis T. Tygart regarding the U.S. Postal Service Pro Cycling Team doping conspiracy, 2012. Online available: http:// cyclinginvestigation.usada. org.
[3] USADA, Reasoned decision of the United States Anti-Doping Agency on disqualification and ineligibility, 2012. Online available: http://cyclinginvestigation.usada.org [4] Carroll R. T., The skeptic’s dictionary: A collection of strange beliefs, amusing deceptions, and dangerous delusions. H o b o ken (NJ): John Wiley & Sons, 2003. [5] Lodewijkx H.F.M. and Verboon P., “Armstrong’s era of performance — Part I: Are his time trial performances much different from other winners?” Journal of Athletic Enhancement, 2: 1, 2013. Online available: http://dx.doi. org/10.4172/2324-9080.1000106 [6] Lodewijkx H.F.M. and Bos A.E.R., “Armstrong’s era of performance —Part II: Too often the doping debate involves ‘arguments from ignorance.’” Manuscript submitted for publication. Heerlen (The Netherlands): Open University, 2013.
135
[7] Lodewijkx H.F.M. and Brouwer B., “Some empirical notes on the ‘epo epidemic’ in professional cycling.” Research Quarterly for Exercise and Sport, 82 (4): 593-608, 2011. Online available: http://www.ingentaconnect.com/content/ aahperd/rqes/2011/00000082/00000004/art00017 [8] Lodewijkx H.F.M. and Brouwer B., “Tour, Giro Vuelta: Rapid progress in cycling performance starts in the 1980s.” International Journal of Sports Science, 2(3): 24-31, 2012. Online available: http://article.sapub.org/10.5923.j.spor ts.20120203.02.html [9] El Helou N., Berthelot G., Thibaut V., Tafflet M., Massif H., Campion F. et al., “Tour de France, Giro, Vuelta, and classic European races show a unique progression of road cycling speed in the last 20 years.” Journal of Sports Sciences, 28 (7): 789-796, 2010. Online available: http://www.tandfonline.com/doi/abs/10.1080/02640411003739654 [10] Perneger T. V., “Speed trends of major cycling races: Does slower mean cleaner?” International Journal of Sports Medicine, 31: 261–264, 2010. Online available: http://dx.doi. org/10.1055/s-0030-1247593. [11] Lucia A., Earnest C. and Arribas C., “The Tour de France: a physiological review.” Scandinavian Journal of Medicine and Science in Sports, 13: 275-283, 2003. Online available: http://onlinelibrar y.wiley.com/doi/10.1034/j.16000838.2003.00345.x/ [12] Magnier D., Picq P., Debreilly, M., Zingoni P., Haffreingue H. and Bey J.-L., Cycling remembered [In French: Memoire du cyclisme]. Online available: http://www.memoire-ducyclisme.eu, 2013. [13] Codifava G., Cycling climbs, http:// www.salite.ch, 2012. [14] Lonkhuyzen M. van, Cycling cols, http://www. cyclingcols. com, 2012. [15] Ejnès G., Bouvet P., Brunel P., Dufourq R., Laget S. et al., Tour de France, 100 years. [In French: Tour de France 100 ans. (Vol. I, II, and III)]. Paris: L’Equipe, 2002. [16] Preacher K. J. and Hayes A. F., “Asymptotic and resampling strategies for assessing and comparing indirect effects in multiple mediator models.” Behavior Research Methods, 40: 879-891, 2008. http://link.springer.com/ article/10.3758%2FBRM.40.3.879?LI=true [17] Hayes A. F. “INDIRECT: An SPSS-macro for estimating
Chapter 6 : Armstrong's era part III indirect path coefficients in regression models.” Online available: http://afhayes.com/spss-sas-and-mplus-macrosand-code.html, 2013. [18] Field A., Discovering statistics using SPSS (2nd editition). London: Sage, 2009. [19] Kerckhoffs R. and Janssens R., Triumph and tragedy on the climbs of the Tour (In Dutch: Triomf en tragiek op de Tourcols). The Hague: Uitgeverij BZZtoH, 2003. [20] Lundby C. and Olsen N. V., “Effects of recombinant human erythropoietin in normal humans.” Journal of Physiology, 589: (6),1265–1271, 2011. http://onlinelibrary.wiley.com/ doi/10.1113/jphysiol.2010.195917/full [21] Bytomski J. R., Moorman III, C. T. and MacAuley D., Oxford American handbook of sports medicine. Oxford: Oxford University Press, 2010. [22] Kuipers H., “Putative effects of doping in cycling.” [In Dutch: “Vermeende effecten van doping in de wielersport”]. Nederlands Tijdschrift voor Geneeskunde, 150: 2643–2645, 2006. http://www.cabdirect.org/abstracts/20063235802. [23] Brouwer B., Lodewijkx H. F. M. and Kuipers H., “Doping confessions of cyclists revisited.” [In Dutch: “Dopingbekentenissen langs de meetlat”]. Sportpsychologie Bulletin, 20, 24–37, 2009. [24] Heuberger J. A. A. C., Cohen-Tervaert J. M., Schepers F. M. L., Vliegenthart A. D. B., Rotmans J. I., Daniels J. M. A., Burggraaf J. and Cohen A. F., “Erythropoietin doping in cycling: Lack of evidence for efficacy and a negative risk–benefit.” British Journal of Clinical Pharmacology, 2012, doi:10.1111/bcp.12034. [25] Lodewijkx H.F.M., Brouwer B., Kuipers H. and Van Hezewijk R., “Overestimated effect of epo administration an aerobic exercise capacity: A meta-analysis.” American Journal of Sports Science and Medicine, 1 (2): 17-27, 2013. http://pubs.sciepub.com/ajssm/1/2/2/#.UZN-IqLxq9A [26] Hopkins W. G., Hawley J. A., and Burke L. M., “Design and analysis of research on sport performance enhancement.” Medicine and Science in Sports and Exercise, 31: 472-485, 1999.
Joop Zoetemelk, 1970s
136
Cover Italian cyclist Ottavio Bottechia, winner of the 1924 Tour de France.
Disclaimer • The articles presented in various chapters of this book (On Cycling and Doping, still a work in progress) were published by journals and thus copyrighted to them. The chapters / articles are all Adobe InDesign® versions of the original papers. The book intends to facilitate the accepted practice that authors are allowed to distribute copies of articles to interested parties for personal use. No commercial use may be made of the articles nor is mass production of the articles permitted. • The authors have no competing interests and have no commercial intentions.
Notes for the reader • The data assembled for the historic studies presented in this book are all public domain and can be retrieved from the French website http://www.memoire–du–cyclisme. net (Magnier, D., Picq, P., Debreilly, M., Zingoni, P., Haffreingue, H., & Bey, J.–L., 2013). Simply donate a small sum of money and a wealth of data becomes available to you. • The book is password protected and can be downloaded for personal use, it cannot be printed. To download the original papers, we refer to the websites of the various journals. Follow the links provided with every chapter or check the references. • Enjoy!
i