Based on data in Table B2,. Callister 7e. Composite data based on reinforced epoxy with 60 vol% of aligned carbon (CFRE), aramid (AFRE), or glass (GFRE).
Chapter 6:Mechanical Properties Why mechanical properties? Need to design materials that can withstand applied load… e.g. materials used in building bridges that can hold up automobiles, pedestrians…
materials for skyscrapers in the Windy City…
materials for space exploration…
NASA
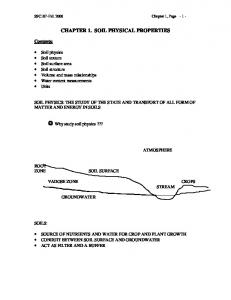
materials for and designing MEMs and NEMs…
Space elevators? Chapter 6 -
1
ISSUES TO ADDRESS...
• Stress and strain: What are they and why are they used instead of load and deformation? • Elastic behavior: When loads are small, how much deformation occurs? What materials deform least? • Plastic behavior: At what point does permanent deformation occur? What materials are most resistant to permanent deformation? • Toughness and ductility: What are they and how do we measure them?
Chapter 6 - 2
Stress and Strain Stress:
Pressure due to applied load. tension, compression, shear, torsion, and their combination.
force stress = σ = area Strain: response of the material to stress (i.e. physical deformation such as elongation due to tension).
Chapter 6 - 3
Tension
Shear
Compression
Torsion Chapter 6 - 4
COMMON STATES OF STRESS
• Simple tension: cable
F
F
Ao = cross sectional Area (when unloaded)
F σ= σ Ao
σ Ski lift
(photo courtesy P.M. Anderson) From Callister 6e resource CD.
Chapter 6 - 5
COMMON STATES OF STRESS • Simple compression:
Ao
Canyon Bridge, Los Alamos, NM (photo courtesy P.M. Anderson)
Balanced Rock, Arches National Park (photo courtesy P.M. Anderson)
F σ= Ao
Note: compressive structure member (σ < 0 here). From Callister 6e resource CD.
Chapter 6 - 6
COMMON STATES OF STRESS • Hydrostatic compression:
Fish under water
σh < 0
(photo courtesy P.M. Anderson)
From Callister 6e resource CD.
Chapter 6 - 7
Tension and Compression Tension
F Engineering stress = σ = Ao li − lo ∆l = Engineering strain = ε = lo lo Ao = original cross sectional area li = instantaneous length lo = original length Note: strain is unitless.
Compression Same as tension but in the opposite direction (stress and strain defined in the same manner). By convention, stress and strain are negative for compression. Chapter 6 - 8
Shear
Pure shear stress =
F τ= Ao
Pure shear strain = γ
= tan θ
Strain is always dimensionless.
Chapter 6 - 9
Elastic Deformation 1. Initial
2. Small load
3. Unload
bonds stretch return to initial
δ F
F
Linearelastic
Elastic means reversible! -a non-permanent deformation where the material completely recovers to its original state upon release of the applied stress.
δ
Non-Linearelastic
Chapter 6 - 10
Plastic Deformation (Metals) 1. Initial
2. Small load bonds stretch & planes shear
δelastic + plastic
3. Unload planes still sheared
δplastic
F F Plastic means permanent!
linear elastic
linear elastic
δplastic
δ
Chapter 6 - 11
Stress-Strain Testing • Typical tensile test machine
extensometer
• Typical tensile specimen
specimen
Adapted from Fig. 6.2, Callister 7e.
gauge length
Adapted from Fig. 6.3, Callister 7e. (Fig. 6.3 is taken from H.W. Hayden, W.G. Moffatt, and J. Wulff, The Structure and Properties of Materials, Vol. III, Mechanical Behavior, p. 2, John Wiley and Sons, New York, 1965.)
Chapter 6 - 12
Linear Elastic Properties
F
• Modulus of Elasticity, E: (also known as Young's modulus)
• Hooke's Law:
σ=Eε stress
σ
F
strain
E
Modulus of elasticity (Young’s modulus)
simple tension test
ε Measure of material’s resistance to elastic deformation (stiffness).
For metals, typically E ~ 45 – 400 GPa
Linearelastic
Chapter 6 - 13
Note: some materials do not have linear elastic region (e.g. cast iron, concrete, many polymers…) Define secant modulus and tangent modulus.
Tangent modulus = slope of the tangent line
σ σ2 σ1
Secant modulus =
ε1
∆σ σ 1 = ∆ε ε 1
ε
Chapter 6 - 14
Silicon (single crystal) Glass (pyrex) SiC (fused or sintered) Graphite (molded) High modulus C-fiber Carbon Nanotubes
120 - 190 (depends on crystallographic direction) 70 207 - 483 ~12 400 ~1000
If we normalize to density: ~20 times that of steel wire Density normalized strength is ~56X that of steel Chapter 6 - 15 wire
Poisson Ratio So far, we’ve considered stress only along one dimension… Along z: tension
∆l εz = lo
Along x: compression
z x
do
lo
lo+∆l do+∆d
Compression
Isotropic x and y:
εx =
∆d do
εy = εx
εy εx =− Poisson ratio = υ = − εz εz Elongation
Relation between elastic and shear moduli: E = 2G(1+ν) Chapter 6 - 16
Poisson Ratio • Poisson Ratio has a range –1 ≤ ν ≤ 1/2 Look at extremes • No change in aspect ratio:
ν =−
∆w /w = ∆l /l
l
w
∆w /w = −1 ∆l /l
• Volume (V = AL) remains constant: ∆V =0 or l∆A = - A ∆l
σ
Hence, ∆V = (l ∆A+A ∆l) = 0. In terms of width, A = w2, and ∆A = w2 - (w+∆w)2 = 2w ∆w + ∆w2 then ∆A/A = 2 ∆w/w + ∆w2/w2 in the limit of small changes ∆A/A = 2 ∆w/w then 2 ∆w/w = -∆l/l
∆w / w (− 12 ∆l / l) ν =− =− = 1/ 2 ∆l / l ∆l / l Chapter 6 - 17
Poisson's ratio, ν • Poisson's ratio, ν:
εL
εL ν=− ε metals: ν ~ 0.33 ceramics: ν ~ 0.25 polymers: ν ~ 0.40
Units: E: [GPa] or [psi] ν: dimensionless
ε -ν
–ν > 0.50 density increases –ν < 0.50 density decreases (voids form) Chapter 6 - 18
Poisson Ratio: materials specific Metals:
Ir 0.26
W 0.29
Ni 0.31
Cu 0.34
Al 0.34
Ag 0.38
Au 0.42
generic value ~ 1/3
Solid Argon: 0.25 Covalent Solids:
Ionic Solids:
MgO
Si 0.27
Ge 0.28
Al2O3 0.23
TiC 0.19
generic value ~ 1/4
0.19
Silica Glass: 0.20 Polymers: Network (Bakelite) 0.49 Elastomer:
Chain (PE) 0.40
Hard Rubber (Ebonite) 0.39
(Natural) 0.49 Chapter 6 - 19
Mechanical Properties • Slope of stress strain plot (which is proportional to the elastic modulus) depends on bond strength of metal
Adapted from Fig. 6.7, Callister 7e.
Chapter 6 - 20
Other Elastic Properties • Elastic Shear modulus, G:
τ
M G γ
τ=Gγ • Elastic Bulk modulus, K:
∆V P = -K Vo
M P
P K
∆V P Vo
• Special relations for isotropic materials: E G= 2(1 + ν)
simple torsion test
E K= 3(1 − 2ν)
P pressure test: Init. vol =Vo. Vol chg. = ∆V
Chapter 6 - 21
Young’s Moduli: Comparison Metals Alloys 1200 1000 800 600 400
E(GPa)
200 100 80 60 40
109 Pa
Graphite Composites Ceramics Polymers /fibers Semicond Diamond
Tungsten Molybdenum Steel, Ni Tantalum Platinum Cu alloys Zinc, Ti Silver, Gold Aluminum Magnesium, Tin
Si carbide Al oxide Si nitride
Carbon fibers only
CFRE(|| fibers)*
Si crystal
Aramid fibers only
AFRE(|| fibers)*
Glass -soda
Glass fibers only
GFRE(|| fibers)* Concrete GFRE*
20 10 8 6 4 2 1 0.8 0.6 0.4 0.2
CFRE* GFRE( fibers)*
Graphite
Polyester PET PS PC
CFRE( fibers) * AFRE( fibers) *
Epoxy only
Based on data in Table B2, Callister 7e. Composite data based on reinforced epoxy with 60 vol% of aligned carbon (CFRE), aramid (AFRE), or glass (GFRE) fibers.
PP HDPE PTFE LDPE
Wood(
grain)
Chapter 6 - 22
Useful Linear Elastic Relationships • Simple tension:
δ = FL o δ = −ν Fw o L EA o EA o F δ/2
Ao
wo
Lo
• Simple torsion:
α=
2ML o πr o4 G M = moment α = angle of twist
Lo
2ro δL /2 • Material, geometric, and loading parameters all contribute to deflection. • Larger elastic moduli minimize elastic deflection. Chapter 6 - 23
Plastic (Permanent) Deformation Adapted from Fig. 6.10 (a), Callister 7e.
• Simple tension test: Elastic+Plastic at larger stress
engineering stress, σ
Elastic initially permanent (plastic) after load is removed
εp
engineering strain, ε plastic strain
•A permanent deformation (usually considered for T>σy(metals) >> σy(polymers) Room T values Based on data in Table B4, Callister 7e. a = annealed hr = hot rolled ag = aged cd = cold drawn cw = cold worked qt = quenched & tempered
Chapter 6 - 27
Tensile Strength, TS • Maximum stress on engineering stress-strain curve. Adapted from Fig. 6.11, Callister 7e.
TS
F = fracture or ultimate strength
engineering stress
σy
Typical response of a metal
Neck – acts as stress concentrator
strain engineering strain • Metals: occurs when noticeable necking starts. • Polymers: occurs when polymer backbone chains are aligned and about to break. Chapter 6 - 28
True stress and strain engineering stress
TS
Notice that past maximum stress point, σ decreases. Does this mean that the material is becoming weaker? Typical response of a metal
Necking leads to smaller cross sectional area!
strain
Recall: Engineering Stress =
True Stress = σ T =
F Ai
li = ln ε True Strain = T lo
σ=
F Ao
Original cross sectional area!
Ai = instantaneous area li = instantaneous length If no net volume change (i.e. Ai li = Ao lo)
σ T = σ (1 + ε ) ε T = ln(1 + ε )
Only true at the onset of necking Chapter 6 - 29
Example problem Calculate/determine the following for a brass specimen that exhibits stress-strain behavior shown on the left. 1) Modulus of elasticity. 2) Yield strength. 3) Maximum load for a cylindrical specimen with d = 12.8mm. 4) Change in length at 345MPa if the initial length is 250mm.
Chapter 6 - 30
Tensile Strength : Comparison Metals/ Alloys
Tensile strength, TS (MPa)
5000 3000 2000 1000
300 200 100 40 30
Graphite/ Ceramics/ Semicond
Polymers
C fibers Aramid fib E-glass fib Steel (4140) qt AFRE(|| fiber) GFRE(|| fiber) CFRE(|| fiber)
Diamond W (pure) Ti (5Al-2.5Sn)aa Steel (4140)cw Si nitride Cu (71500) Cu (71500) hr Al oxide Steel (1020) ag Al (6061) Ti (pure) a Ta (pure) Al (6061) a Si crystal
Glass-soda Concrete
Room Temp. values Nylon 6,6 PC PET PVC PP HDPE
20
Composites/ fibers
Graphite
wood(|| fiber) GFRE( fiber) CFRE( fiber) AFRE( fiber)
LDPE
10
wood (
1
fiber)
Based on data in Table B4, Callister 7e. a = annealed hr = hot rolled ag = aged cd = cold drawn cw = cold worked qt = quenched & tempered AFRE, GFRE, & CFRE = aramid, glass, & carbon fiber-reinforced epoxy composites, with 60 vol% fibers. Chapter 6 - 31
Tensile properties C. Ductility:: measure of degree of plastic deformation that has been sustained at fracture. • Ductile materials can undergo significant plastic deformation before fracture. • Brittle materials can tolerate only very small plastic deformation.
Chapter 6 - 32
Ductility • Plastic tensile strain at failure:
L f − Lo x 100 %EL = Lo
smaller %EL Engineering tensile stress, σ
larger %EL
Lo
Ao
Af
Lf
Adapted from Fig. 6.13, Callister 7e.
Engineering tensile strain, ε
• Another ductility measure:
%RA =
Ao - Af x 100 Ao Chapter 6 - 33
Toughness • Energy to break a unit volume of material • Approximate by the area under the stress-strain curve. Engineering tensile stress, σ
small toughness (ceramics) large toughness (metals) very small toughness (unreinforced polymers)
Adapted from Fig. 6.13, Callister 7e.
Engineering tensile strain,
ε
Brittle fracture: elastic energy Ductile fracture: elastic + plastic energy Chapter 6 - 34
Resilience, Ur • Ability of a material to store energy – Energy stored best in elastic region
Ur = ∫
εy
0
σdε
If we assume a linear stress-strain curve this simplifies to
1 Ur ≅ σy ε y 2 Adapted from Fig. 6.15, Callister 7e.
Chapter 6 - 35
Elastic recovery after plastic deformation
This behavior is exploited to increase yield strengths of metals: strain hardening (also called cold working).
Chapter 6 - 36
Hardness • Resistance to permanently indenting the surface. • Large hardness means: --resistance to plastic deformation or cracking in compression. --better wear properties. apply known force
measure size of indent after removing load
e.g., 10 mm sphere
D most plastics
brasses Al alloys
Smaller indents mean larger hardness.
d easy to machine steels file hard
cutting tools
nitrided steels
diamond
increasing hardness Chapter 6 - 37
Hardness: Measurement • Rockwell – No major sample damage – Each scale runs to 130 but only useful in range 20-100. – Minor load 10 kg – Major load 60 (A), 100 (B) & 150 (C) kg • A = diamond, B = 1/16 in. ball, C = diamond
• HB = Brinell Hardness – TS (psia) = 500 x HB – TS (MPa) = 3.45 x HB Chapter 6 - 38
Hardness scales
Indentation with diamond pyramid tip Indentation with spherical hardened steel and conical diamond (for hardest materials)
Indentation with spherical hardened steel or tungsten carbide tip.
Chapter 6 - 39 Qualitative scale
Hardness: Measurement Table 6.5
Chapter 6 - 40
True Stress & Strain Note: S.A. changes when sample stretched • True stress
σT = F Ai
σT = σ(1 + ε )
• True Strain
εT = ln(l i l o )
εT = ln(1 + ε )
Adapted from Fig. 6.16, Callister 7e.
Chapter 6 - 41
Hardening • An increase in σy due to plastic deformation.
σ
large hardening
σy 1 σy
small hardening
0
ε • Curve fit to the stress-strain response: n
( )
σT = K εT “true” stress (F/A)
hardening exponent: n = 0.15 (some steels) to n = 0.5 (some coppers) “true” strain: ln(L/Lo) Chapter 6 - 42
Variability in Material Properties • Elastic modulus is material property • Critical properties depend largely on sample flaws (defects, etc.). Large sample to sample variability. • Statistics n
– Mean
– Standard Deviation
Σ xn x= n 2 n Σ (x i − x ) s= n −1
1 2
where n is the number of data points Chapter 6 - 43
Design or Safety Factors • Design uncertainties mean we do not push the limit. • Factor of safety, N Often N is
σworking =
σy
between 1.2 and 4
N
• Example: Calculate a diameter, d, to ensure that yield does not occur in the 1045 carbon steel rod below. Use a factor of safety of 5.
σworking = 220,000N π d2 / 4
(
)
5
σy N
d
1045 plain carbon steel: σy = 310 MPa TS = 565 MPa
d = 0.067 m = 6.7 cm
Lo
F = 220,000N Chapter 6 - 44
Summary • Stress and strain: These are size-independent measures of load and displacement, respectively. • Elastic behavior: This reversible behavior often shows a linear relation between stress and strain. To minimize deformation, select a material with a large elastic modulus (E or G). • Plastic behavior: This permanent deformation behavior occurs when the tensile (or compressive) uniaxial stress reaches σy. • Toughness: The energy needed to break a unit volume of material. • Ductility: The plastic strain at failure.
Chapter 6 - 45