Chapter 8. TIMSS 2011 INTERNATIONAL RESULTS IN SCIENCE. CHAPTER 8.
329 ..... tional M a thema tics and S cience Study – TIMSS 2011 ... 9 (0.8). 373 (
9.0). 10.3 (0.08). Quebec, Canada. 52 (1.4). 524 (3.0). 34 (1.0). 511 (3.7). 14 (1.0)
.
Chapter 8
Classroom Instruction Overall, students with positive attitudes toward science have higher achievement, but these attitudes deteriorate over time. Internationally, by the eighth grade, fewer students like learning science and feel confident in their abilities (compared to the fourth grade). In countries teaching science as separate subjects, students like learning chemistry and physics less than biology and earth science, and are less confident in their abilities in them. Engaging instruction, good nutrition, and enough sleep were related to higher achievement. However, by the eighth grade, only one-quarter of the students reported being engaged in their science lessons, and nearly as many reported being not engaged. Also, in the majority of eighth grade classrooms, instruction was limited because students were suffering from lack of sleep.
TIMSS 2011 INTERNATIONAL RESULTS IN SCIENCE CHAPTER 8
329
This chapter considers the learning environment of the classroom itself, because classroom instruction is at the core of student learning. Previous chapters of this report have described how teaching effectiveness can be greatly influenced by students’ home and school environments as well as by teachers’ preparation. However, even though the curricular policies and school resources often set the tone for accomplishment, students’ day-to-day classroom activities are likely to have a considerable direct impact on their science learning. TIMSS routinely presents very powerful evidence showing that within countries students with more positive attitudes toward science have substantially higher achievement, and the results from TIMSS 2011 are consistent with previous assessments. In addition to being motivated to learn, students need the opportunity to learn. Thus, this chapter also provides information about the instructional time devoted to science and the approaches teachers use to engage students in learning. It is difficult, however, for teachers to engage students in learning if students do not have the prerequisite skills or are too sleep deprived or disruptive to pay attention. Finally, an effective classroom environment for science learning involves using a variety of instructional approaches, capitalizing on technology, and at the eighth grade, extending instruction with homework and regularly assessing student progress.
Students’ Attitudes Toward Science Each successive TIMSS assessment has shown a strong positive relationship within countries between student attitudes toward science and their science achievement. Additionally, there is extensive research showing that students with more positive attitudes toward mathematics and science have higher average achievement in mathematics and science. For example, a recent meta-analysis of student attitudes toward school found that attitudes toward mathematics or science were related to mathematics and science achievement across 288 studies (Hattie, 2009). While positive attitudes and high achievement in science go hand in hand, it should be understood that the relationship is bidirectional, with attitudes and achievement mutually influencing each other. Students who are good at science also are more likely to enjoy learning science. Much research about students’ attitudes toward learning has studied the complex phenomenon of motivation. For example, students’ motivation to learn can be affected by whether they find the subject enjoyable and place value on the subject. In addition, students’ motivation can be affected by their selfconfidence in learning the subject. TIMSS 2011 included scales about three
330
TIMSS 2011 INTERNATIONAL RESULTS IN SCIENCE CHAPTER 8
motivational constructs: intrinsic value (interest), utility value, and ability beliefs. Essentially, intrinsic motivation refers to doing an activity because it is interesting or enjoyable, and the Students Like Learning Science scale was developed to measure students’ interest in and liking of learning science. In contrast, extrinsic motivation refers to doing something because it leads to a desirable outcome. There are many types of external motivation from teacher praise, to good grades, to being accepted to a good university, to having a successful career and daily life. In particular, the TIMSS 2011 Students Value Science scale addresses students’ attitudes about the importance of the subject and usefulness of the subject, sometimes called attainment value and utility value (Wigfield & Eccles, 2000). Finally, motivation to learn includes having the feeling that you can succeed. The Student Confidence with Science scale assesses students’ self-confidence or self-concept in their ability to learn science. A strong self-concept encourages students to engage with the instruction and show persistence, effort, and attentiveness. Students Like Learning Science Exhibit 8.1 presents the fourth grade results for the TIMSS 2011 Students Like Learning Science scale. Students were scored according to the degree of their agreement with five statements such as “I enjoy learning science,” “Science is boring” (reverse coded), and “I learn many interesting things in science” (see second page of the exhibit for details). Students in the Like Learning Science category “agreed a lot” with three of the five statements and “agreed a little” with the other two, on average. In contrast, students who Do Not Like Learning Science “disagreed a little” with three of the statements and “agreed a little” with the other two, on average. For each TIMSS 2011 participant, the percentage of students in each category is shown together with the students’ average science achievement. The first page of the exhibit presents the results for countries participating at the fourth grade, and the average results across those countries. The second page of the exhibit presents the results for the sixth grade and benchmarking participants. On average, more than half of the fourth grade students internationally Like Learning Science, substantially more than Do Not Like Learning Science (53% vs. 12%). The remaining fourth grade students (35%, on average) Somewhat Like Learning Science. Most important, however, on average, internationally, and in almost all TIMSS 2011 countries, including the sixth
CLASSROOM INSTRUCTION CHAPTER 8
331
Reported by Students Students were scored according to their degree of agreement with five statements on the Students Like Learning Science scale. Students who Like Learning Science had a score on the scale of at least 9.7, which corresponds to their “agreeing a lot” with three of the five statements and “agreeing a little” with the other two, on average. Students who Do Not Like Learning Science had a score no higher than 7.6, which corresponds to their “disagreeing a little” with three of the five statements and “agreeing a little” with the other two, on average. All other students Somewhat Like Learning Science.
Like Learning Science
Country Turkey Tunisia Iran, Islamic Rep. of Georgia Portugal Lithuania Russian Federation Kazakhstan Armenia Saudi Arabia Romania United Arab Emirates Ireland Chinese Taipei Germany Singapore Poland Kuwait Norway Thailand United States Oman Australia Malta Croatia Bahrain New Zealand Austria Hong Kong SAR Japan Italy Northern Ireland Qatar Slovak Republic Serbia Chile Spain Sweden Hungary Netherlands Czech Republic Denmark Morocco England Belgium (Flemish) Slovenia Yemen Korea, Rep. of Finland Azerbaijan International Avg.
r
Somewhat Like Learning Science
Percent of Students
Average Achievement
Percent of Students
Average Achievement
Percent of Students
Average Achievement
73 (0.9) 72 (1.5) 68 (1.1) 68 (1.1) 66 (1.8) 63 (1.2) 62 (1.2) 62 (1.3) 61 (1.4) 61 (1.5) 61 (1.4) 60 (0.8) 59 (1.5) 58 (1.4) 58 (1.5) 57 (0.7) 57 (0.9) 57 (1.4) 56 (1.7) 56 (1.5) 56 (0.8) 55 (1.1) 55 (1.0) 55 (0.8) 55 (1.2) 55 (1.6) 55 (1.1) 53 (1.1) 52 (1.3) 52 (1.2) 51 (1.2) 51 (1.4) 50 (1.8) 49 (1.2) 48 (1.3) 48 (1.2) 48 (1.3) 48 (1.5) 48 (1.1) 45 (1.7) 45 (1.3) 44 (1.3) 44 (1.8) 44 (1.5) 42 (1.2) 41 (1.1) 39 (2.1) 39 (0.9) 36 (1.2) 33 (1.5) 53 (0.2)
486 (3.3) 376 (5.3) 473 (3.5) 479 (3.1) 533 (3.9) 524 (2.2) 561 (3.6) 509 (5.1) 433 (4.1) 461 (4.9) 530 (5.6) 462 (2.7) 529 (3.2) 564 (2.2) 538 (3.1) 600 (3.4) 516 (2.9) 384 (5.1) 503 (2.5) 498 (5.6) 555 (2.3) 419 (4.1) 529 (2.8) 469 (2.8) 522 (2.2) 484 (3.3) 512 (2.5) 540 (3.0) 551 (3.5) 566 (2.0) 532 (3.0) 533 (2.5) 453 (5.2) 543 (3.5) 525 (3.3) 501 (2.7) 519 (2.8) 537 (3.1) 554 (4.0) 536 (2.8) 544 (2.8) 533 (3.4) 308 (5.9) 535 (4.1) 516 (2.0) 529 (3.2) 257 (8.2) 604 (3.1) 578 (3.2) 477 (6.2) 504 (0.5)
24 (0.8) 24 (1.3) 27 (1.0) 27 (0.9) 31 (1.7) 29 (1.0) 30 (0.9) 34 (1.3) 30 (1.1) 30 (1.1) 32 (1.2) 31 (0.7) 29 (1.0) 30 (0.9) 30 (1.0) 31 (0.6) 33 (0.9) 32 (1.1) 31 (1.4) 38 (1.3) 29 (0.5) 38 (0.9) 31 (0.7) 29 (0.8) 30 (0.8) 33 (1.0) 32 (0.8) 33 (0.9) 35 (0.9) 40 (0.9) 36 (0.9) 36 (1.1) 40 (1.5) 37 (0.9) 41 (0.9) 39 (0.8) 36 (1.0) 38 (1.1) 36 (0.8) 36 (1.1) 37 (1.0) 36 (0.7) 46 (1.4) 35 (1.1) 35 (0.9) 38 (0.8) 49 (1.9) 45 (0.9) 39 (1.0) 62 (1.3) 35 (0.1)
410 (7.0) 278 (6.3) 412 (5.1) 423 (5.6) 502 (4.8) 502 (4.0) 540 (4.1) 474 (6.1) 396 (5.4) 392 (7.9) 477 (7.5) 383 (3.4) 506 (4.4) 537 (3.5) 524 (3.3) 567 (4.3) 494 (3.1) 308 (5.2) 486 (3.7) 444 (6.8) 535 (3.3) 334 (6.1) 506 (3.9) 424 (3.9) 507 (3.0) 422 (4.6) 486 (3.7) 524 (3.4) 523 (4.9) 554 (2.3) 519 (3.8) 509 (3.9) 354 (5.5) 523 (4.6) 507 (3.8) 462 (3.4) 491 (4.1) 536 (3.3) 519 (4.3) 529 (2.8) 530 (3.5) 526 (3.7) 236 (5.2) 528 (4.1) 508 (2.6) 515 (3.4) 193 (6.7) 583 (2.0) 571 (3.2) 441 (5.6) 469 (0.7)
3 (0.3) 4 (0.5) 5 (0.5) 5 (0.5) 4 (0.5) 8 (0.5) 7 (0.5) 4 (0.4) 9 (0.6) 8 (0.8) 8 (0.6) 8 (0.4) 12 (1.0) 11 (0.8) 12 (0.9) 12 (0.5) 10 (0.5) 11 (0.9) 12 (0.9) 6 (0.5) 15 (0.6) 7 (0.4) 14 (0.7) 16 (0.6) 15 (0.9) 12 (1.1) 13 (0.8) 14 (0.8) 14 (0.8) 9 (0.8) 12 (0.7) 13 (0.8) 11 (0.8) 14 (0.8) 11 (0.8) 13 (0.7) 16 (0.9) 13 (0.8) 16 (0.9) 19 (1.2) 18 (0.9) 19 (1.3) 11 (0.9) 21 (1.1) 23 (1.0) 21 (1.0) 12 (1.4) 16 (0.7) 25 (1.1) 5 (0.6) 12 (0.1)
393 (8.6) 262 (11.3) 415 (9.0) 422 (10.6) 489 (7.5) 498 (7.0) 542 (5.6) 488 (13.4) 380 (6.8) 380 (10.5) 459 (16.1) 377 (5.0) 490 (9.1) 533 (5.3) 517 (5.8) 555 (5.4) 487 (6.0) 330 (10.7) 482 (4.9) 420 (9.8) 530 (3.3) 304 (9.5) 496 (5.2) 411 (3.7) 514 (3.5) 412 (7.2) 468 (5.5) 521 (4.8) 507 (6.6) 538 (5.7) 515 (4.4) 483 (5.4) 347 (12.6) 524 (5.5) 511 (7.2) 471 (4.6) 502 (4.4) 523 (4.7) 519 (5.4) 524 (3.7) 532 (4.0) 527 (3.1) 212 (9.0) 518 (3.9) 498 (3.0) 516 (5.1) 153 (12.3) 559 (3.6) 561 (3.4) 415 (14.3) 461 (1.1)
Centerpoint of scale set at 10. ( ) Standard errors appear in parentheses. Because of rounding some results may appear inconsistent. An “r” indicates data are available for at least 70% but less than 85% of the students.
332
Do Not Like Learning Science
TIMSS 2011 INTERNATIONAL RESULTS IN SCIENCE CHAPTER 8
Average Scale Score 10.9 (0.04) 11.0 (0.06) 10.7 (0.04) 10.7 (0.04) 10.5 (0.06) 10.4 (0.05) 10.4 (0.05) 10.4 (0.06) 10.5 (0.05) 10.4 (0.06) 10.3 (0.06) 10.4 (0.03) 10.2 (0.07) 10.1 (0.06) 10.1 (0.07) 10.1 (0.03) 10.1 (0.04) 10.2 (0.06) 10.1 (0.07) 10.1 (0.05) 10.0 (0.04) 10.3 (0.04) 10.0 (0.05) 9.9 (0.04) 10.0 (0.06) 10.1 (0.08) 10.0 (0.05) 9.9 (0.05) 9.9 (0.05) 9.9 (0.05) 9.9 (0.05) 9.8 (0.06) 10.0 (0.07) 9.8 (0.05) 9.8 (0.06) 9.8 (0.05) 9.7 (0.06) 9.8 (0.06) 9.7 (0.06) 9.6 (0.08) 9.6 (0.06) 9.5 (0.07) 9.8 (0.07) 9.4 (0.07) 9.3 (0.05) 9.3 (0.05) 9.6 (0.08) 9.4 (0.04) 9.1 (0.06) 9.6 (0.06)
SOURCE: IEA’s Trends in International Mathematics and Science Study – TIMSS 2011
Exhibit 8.1: Students StudentsLike LikeLearning LearningScience Science
Like Learning Science
Country
Somewhat Like Learning Science
Do Not Like Learning Science
Average Scale Score
Percent of Students
Average Achievement
Percent of Students
Average Achievement
Percent of Students
Average Achievement
53 (1.4) 48 (1.7) 41 (1.8)
436 (5.0) 388 (6.7) 464 (6.2)
37 (1.2) 44 (1.5) 54 (1.9)
306 (4.9) 314 (7.1) 412 (5.8)
10 (0.6) 8 (0.7) 5 (0.4)
249 (8.8) 295 (13.8) 412 (12.9)
10.0 (0.06) 9.9 (0.07) 9.8 (0.06)
66 (1.0) 64 (1.9) 59 (1.6) 58 (1.8) 52 (1.4) 51 (1.7) 48 (1.1)
492 (3.0) 547 (4.0) 550 (2.5) 448 (4.9) 524 (3.0) 556 (4.2) 537 (3.4)
27 (0.8) 26 (1.4) 31 (1.2) 33 (1.5) 34 (1.0) 30 (1.2) 35 (0.8)
420 (4.3) 527 (6.7) 533 (4.1) 364 (5.4) 511 (3.7) 540 (4.1) 525 (3.3)
7 (0.5) 10 (0.9) 10 (0.7) 9 (0.8) 14 (1.0) 18 (1.0) 16 (0.9)
400 (8.3) 520 (8.2) 524 (6.5) 373 (9.0) 502 (4.8) 529 (5.4) 510 (4.4)
10.6 (0.04) 10.4 (0.08) 10.2 (0.07) 10.3 (0.08) 9.9 (0.06) 9.8 (0.07) 9.7 (0.06)
Sixth Grade Participants Botswana Yemen Honduras Benchmarking Participants Dubai, UAE North Carolina, US Alberta, Canada Abu Dhabi, UAE Quebec, Canada Florida, US Ontario, Canada
How much do you agree with these statements about learning science? Agree a lot
1) I enjoy learning science ----------------------------------- A 2) I wish I did not have to study science* --------------- A 3) Science is boring*------------------------------------------- A 4) I learn many interesting things in science ----------- A 5) I like science ------------------------------------------------- A
Agree a little
A A A A A
Disagree a little
A A A A A
Disagree a lot
A A A A A
* Reverse coded Like Learning Science
T5r41130
Somewhat Like Learning Science 9.7 7.6
Do Not Like Learning Science
CLASSROOM INSTRUCTION CHAPTER 8
333
SOURCE: IEA’s Trends in International Mathematics and Science Study – TIMSS 2011
Exhibit 8.1: Students Like Learning Science (Continued)
grade and benchmarking participants, students who liked learning science had higher average science achievement than those who only somewhat or did not like learning science. Exhibit 8.2 presents the corresponding results for the eighth grade on the Students Like Learning Science scale. Because 16 of the TIMSS countries teach science subjects separately (i.e., biology, chemistry, physics, and earth science) at the eighth grade rather than as a general or integrated subject, TIMSS asked students in these countries about their liking for the individual science subjects and the results were scaled separately for each subject. The first page of Exhibit 8.2 presents the results for general or integrated science for the eighth grade countries, and also for the ninth grade and benchmarking participants, as all of these teach science as a general or integrated subject. The second and third pages of the exhibit present the results for biology (second page) and chemistry, physics, and earth science (third page) in separate panels. Looking first at general or integrated science and comparing to the fourth grade, substantially fewer eighth grade students reported positive attitudes toward learning science. At the eighth grade, about one-third (35%) of the students, internationally, on average, Like Learning Science (compared to 53% at the fourth grade), and about one-fifth (21%) Do Not Like Learning Science. Accompanying the decrease from the fourth to eighth grades in liking learning science is a widening achievement gap between students who like learning science (515, on average) and those who do not (450). It is noticeable that some of the highest performing countries have the smallest percentages of students reporting positive attitudes toward learning science, such as Chinese Taipei, Japan, and Korea. The tendency of smaller percentages of students in some East Asian countries to report positive attitudes is consistent with previous TIMSS assessments. The relatively low percentages of students liking learning science may partially result from the high level of difficulty of the science being studied, and also these countries have a cultural tradition of serious attitudes toward learning. Across countries teaching the sciences as separate subjects, the average percentages of students liking learning biology and earth science (36% and 33%, respectively) were similar to the percentage liking general or integrated science, but fewer students reported liking learning chemistry (25%) and physics (26%). In all four science subjects, the students who liked learning the subject had higher average achievement than those who only somewhat liked or did not like learning it.
334
TIMSS 2011 INTERNATIONAL RESULTS IN SCIENCE CHAPTER 8
Reported by Students The general/integrated science panel summarizes responses for countries where students are enrolled in science as a single subject. The remaining panels for biology, chemistry, physics, and earth science summarize responses for countries where students are taught science as separate subjects. For general/integrated science, students were scored according to their degree of agreement with five statements on the Students Like Learning Science scale. Students who Like Learning Science had a score on the scale of at least 10.8, which corresponds to their “agreeing a lot” with three of the five statements and “agreeing a little” with the other two, on average. Students who Do Not Like Learning Science had a score on the scale no higher than 8.4, which corresponds to their “disagreeing a little” with three of the five statements and “agreeing a little” with the other two, on average. All other students Somewhat Like Learning Science. For biology, chemistry, physics, and earth science, a comparable procedure was used. Students Like Learning General/Integrated Science
General/Integrated Science Country Tunisia Iran, Islamic Rep. of Turkey Jordan Oman Saudi Arabia Ghana United Arab Emirates Malaysia Chile Singapore Palestinian Nat’l Auth. Qatar Thailand Norway England Bahrain Israel United States Hong Kong SAR Italy Australia New Zealand Chinese Taipei Japan Korea, Rep. of International Avg.
Like Learning Science
Somewhat Like Learning Science
Do Not Like Learning Science
Average Scale Score
Percent of Students
Average Achievement
Percent of Students
Average Achievement
Percent of Students
Average Achievement
56 (1.2) 54 (1.2) 49 (1.1) 47 (1.2) 45 (0.9) 45 (1.5) 45 (1.5) 43 (0.9) 42 (1.4) 40 (1.2) 38 (0.8) 38 (1.4) 36 (1.4) 34 (1.2) 33 (1.5) 32 (1.3) 32 (1.1) 29 (1.1) 29 (0.7) 28 (1.2) 26 (1.0) 25 (1.3) 24 (1.0) 17 (0.8) 15 (0.8) 11 (0.5) 35 (0.2)
450 (2.6) 489 (4.2) 509 (3.5) 485 (3.4) 474 (2.5) 460 (3.7) 357 (4.9) 496 (2.4) 457 (5.8) 475 (2.6) 617 (5.2) 459 (3.5) 479 (5.0) 473 (4.4) 519 (3.5) 562 (5.4) 493 (3.9) 547 (4.7) 555 (3.1) 561 (4.1) 521 (3.1) 559 (6.1) 549 (5.2) 618 (3.4) 595 (3.7) 623 (3.8) 515 (0.8)
37 (1.0) 36 (0.9) 40 (0.9) 42 (0.9) 45 (0.8) 37 (1.0) 48 (1.2) 40 (0.7) 44 (0.9) 43 (0.8) 46 (0.7) 46 (1.1) 44 (1.2) 56 (1.0) 44 (1.0) 45 (0.9) 45 (1.0) 37 (1.0) 43 (0.7) 51 (0.9) 50 (1.0) 42 (1.0) 46 (0.7) 43 (0.7) 47 (1.1) 43 (0.9) 44 (0.2)
426 (2.8) 456 (4.1) 462 (3.8) 430 (4.2) 387 (3.9) 421 (4.2) 277 (5.6) 447 (3.1) 418 (6.3) 455 (2.9) 584 (4.2) 405 (4.3) 393 (3.9) 443 (3.9) 492 (3.1) 532 (5.0) 445 (2.8) 507 (4.9) 523 (2.6) 534 (3.3) 500 (3.2) 521 (4.8) 510 (4.7) 571 (2.7) 566 (2.2) 576 (2.1) 472 (0.8)
8 (0.5) 10 (0.7) 11 (0.6) 11 (0.6) 10 (0.4) 18 (1.1) 7 (0.5) 17 (0.7) 13 (1.0) 17 (0.9) 16 (0.5) 16 (1.0) 19 (0.9) 10 (0.8) 23 (1.2) 23 (1.1) 23 (1.0) 34 (1.5) 28 (0.7) 21 (1.1) 24 (0.9) 33 (1.3) 30 (1.3) 40 (1.1) 38 (1.5) 46 (1.1) 21 (0.2)
422 (5.7) 466 (6.4) 453 (5.5) 420 (6.5) 361 (5.2) 413 (5.7) 223 (10.9) 433 (3.0) 364 (9.4) 451 (4.2) 542 (5.4) 385 (6.1) 373 (6.7) 431 (6.7) 466 (3.8) 500 (4.9) 422 (4.8) 501 (4.5) 500 (3.0) 506 (4.9) 484 (4.1) 490 (4.9) 494 (5.3) 534 (2.6) 531 (3.1) 531 (2.2) 450 (1.1)
11.0 (0.04) 10.8 (0.05) 10.6 (0.04) 10.7 (0.05) 10.7 (0.03) 10.4 (0.07) 10.7 (0.05) 10.3 (0.04) 10.4 (0.06) 10.2 (0.05) 10.2 (0.03) 10.3 (0.06) 10.1 (0.06) 10.1 (0.05) 9.9 (0.07) 9.9 (0.06) 9.9 (0.05) 9.4 (0.07) 9.6 (0.04) 9.8 (0.06) 9.6 (0.05) 9.3 (0.07) 9.4 (0.06) 9.0 (0.05) 9.0 (0.06) 8.7 (0.04)
57 (1.2) 41 (1.1) 39 (1.3)
443 (3.1) 376 (3.0) 385 (4.4)
34 (0.8) 45 (0.8) 49 (1.0)
369 (3.8) 311 (4.5) 359 (4.5)
9 (0.5) 14 (0.6) 11 (0.9)
330 (8.6) 313 (6.4) 370 (6.5)
11.0 (0.05) 10.4 (0.04) 10.4 (0.06)
49 (1.1) 40 (1.3) 37 (1.9) 33 (1.7) 30 (1.4) 30 (1.9) 29 (1.1) 29 (1.3) 29 (1.3) 29 (2.0) 28 (1.4) 28 (1.8) 27 (1.8) 24 (1.1)
511 (2.9) 494 (4.6) 589 (5.6) 566 (5.7) 566 (3.3) 563 (6.5) 543 (3.8) 530 (5.2) 564 (7.1) 582 (5.0) 508 (7.7) 567 (7.9) 558 (6.3) 547 (3.6)
37 (0.9) 41 (1.0) 41 (1.3) 42 (1.4) 44 (1.1) 41 (1.4) 45 (0.8) 43 (1.3) 44 (1.1) 44 (1.3) 44 (1.1) 42 (1.4) 40 (1.3) 48 (0.9)
468 (3.7) 443 (4.7) 565 (5.3) 537 (4.6) 543 (2.8) 527 (5.2) 519 (3.0) 496 (4.8) 529 (7.4) 549 (4.4) 485 (6.6) 532 (6.8) 532 (5.6) 522 (2.7)
14 (0.7) 19 (1.3) 22 (2.0) 25 (1.4) 25 (1.2) 29 (1.7) 26 (1.1) 28 (1.5) 27 (1.7) 28 (1.8) 28 (1.1) 30 (2.1) 32 (1.8) 29 (1.2)
446 (4.7) 436 (5.3) 536 (5.4) 521 (5.6) 528 (2.9) 516 (6.3) 499 (3.1) 475 (5.9) 503 (6.9) 532 (5.7) 470 (6.2) 502 (8.6) 514 (4.9) 496 (3.6)
10.6 (0.05) 10.2 (0.07) 10.0 (0.10) 9.8 (0.07) 9.7 (0.07) 9.6 (0.10) 9.7 (0.05) 9.6 (0.07) 9.6 (0.09) 9.6 (0.10) 9.6 (0.06) 9.5 (0.10) 9.4 (0.10) 9.5 (0.06)
Ninth Grade Participants Botswana South Africa Honduras Benchmarking Participants Dubai, UAE Abu Dhabi, UAE Massachusetts, US Colorado, US Alberta, Canada Connecticut, US Ontario, Canada California, US North Carolina, US Minnesota, US Alabama, US Florida, US Indiana, US Quebec, Canada
Centerpoint of scale set at 10. ( ) Standard errors appear in parentheses. Because of rounding some results may appear inconsistent. A dash (–) indicates comparable data are not available. An “r” indicates data are available for at least 70% but less than 85% of the students.
CLASSROOM INSTRUCTION CHAPTER 8
335
SOURCE: IEA’s Trends in International Mathematics and Science Study – TIMSS 2011
Exhibit 8.2: Students StudentsLike LikeLearning LearningScience Science
SOURCE: IEA’s Trends in International Mathematics and Science Study – TIMSS 2011
Exhibit 8.2: Students StudentsLike LikeLearning LearningScience Science(Continued) (Continued) How much do you agree with these statements about learning ? Agree a lot
Agree a little
1) I enjoy learning ------------------------------- A
Disagree a little
A A A A A
2) I wish I did not have to study * ------------ A 3) is boring* --------------------------------------- A 4) I learn many interesting things in ------- A 5) I like --------------------------------------------- A
A A A A A
Disagree a lot
A A A A A
* Reverse coded Somewhat Like
Like
Do Not Like
Learning General/ Integrated Science
10.8
8.4
Learning Biology
10.7
8.1
Learning Chemistry
11.3
9.0
Learning Physics
11.2
8.9
Learning Earth Science
10.9
8.4
Separate Science Panels Students Like Learning Biology
Like Learning Biology
Biology Country Ukraine Georgia Armenia Syrian Arab Republic Morocco Kazakhstan Romania Russian Federation Lithuania Lebanon Macedonia, Rep. of Hungary Indonesia Sweden Finland T5r82130 Slovenia International Avg.
336
Somewhat Like Learning Biology
Do Not Like Learning Biology
Percent of Students
Average Achievement
Percent of Students
Average Achievement
Percent of Students
Average Achievement
56 (1.4) 56 (1.3) 53 (1.4) 51 (1.3) 51 (0.9) 46 (1.4) 36 (1.5) 36 (0.9) 34 (1.3) 32 (1.3) 30 (1.2) 28 (1.2) 24 (1.2) 19 (0.9) 15 (0.7) 13 (0.8) 36 (0.3)
507 (4.1) 441 (2.9) 451 (3.3) 446 (3.8) 400 (2.0) 505 (4.1) 484 (3.9) 546 (4.5) 525 (3.1) 445 (5.7) 458 (5.3) 536 (3.0) 414 (6.5) 538 (4.0) 574 (4.5) 543 (4.4) 488 (1.1)
37 (1.2) 34 (1.1) 35 (1.0) 42 (1.2) 41 (0.7) 50 (1.4) 45 (1.0) 50 (0.8) 45 (1.1) 50 (1.0) 55 (1.1) 43 (0.9) 71 (1.1) 54 (0.9) 47 (1.0) 43 (1.2) 46 (0.3)
495 (4.2) 409 (3.5) 426 (4.4) 413 (4.0) 357 (2.7) 480 (4.7) 459 (4.0) 540 (3.4) 511 (3.2) 391 (5.6) 387 (5.4) 514 (4.3) 405 (4.3) 515 (2.8) 557 (2.7) 544 (2.9) 463 (1.0)
8 (0.7) 10 (0.8) 12 (0.8) 7 (0.5) 8 (0.4) 4 (0.4) 19 (1.0) 14 (0.9) 21 (1.1) 18 (1.0) 15 (1.1) 29 (1.4) 5 (0.5) 27 (1.1) 38 (1.3) 44 (1.5) 17 (0.2)
501 (7.6) 406 (7.0) 434 (5.3) 400 (7.2) 354 (6.4) 496 (8.5) 454 (5.6) 546 (5.0) 508 (3.9) 379 (6.1) 423 (10.2) 525 (3.6) 385 (11.9) 493 (3.6) 543 (2.7) 543 (3.7) 462 (1.7)
TIMSS 2011 INTERNATIONAL RESULTS IN SCIENCE CHAPTER 8
Average Scale Score 10.9 (0.06) 10.8 (0.06) 10.7 (0.07) 10.8 (0.05) 10.8 (0.04) 10.6 (0.05) 10.0 (0.07) 10.1 (0.05) 9.8 (0.06) 9.9 (0.06) 9.9 (0.06) 9.5 (0.07) 9.8 (0.04) 9.2 (0.05) 8.8 (0.05) 8.6 (0.06)
Exhibit 8.2: Students StudentsLike LikeLearning LearningScience Science(Continued) (Continued) Like Learning Chemistry
Chemistry Country Kazakhstan Morocco Ukraine Russian Federation Lebanon Armenia Syrian Arab Republic Lithuania Macedonia, Rep. of Romania Slovenia Hungary Sweden Finland Indonesia Georgia International Avg.
r
Somewhat Like Learning Chemistry
Do Not Like Learning Chemistry
Percent of Students
Average Achievement
Percent of Students
Average Achievement
Percent of Students
Average Achievement
40 (1.5) 39 (0.8) 35 (1.5) 31 (0.9) 31 (1.3) 28 (1.3) 28 (1.2) 25 (1.1) 23 (1.2) 20 (1.2) 16 (0.8) 16 (0.8) 15 (0.9) 13 (0.9) 9 (0.7) –– 25 (0.3)
514 (4.6) 403 (2.3) 521 (4.5) 561 (4.1) 447 (5.1) 464 (4.2) 451 (4.7) 539 (3.2) 451 (6.0) 503 (4.7) 579 (4.2) 548 (4.8) 546 (5.2) 594 (4.4) 390 (8.6) –– 501 (1.3)
52 (1.4) 47 (0.6) 40 (1.1) 44 (0.8) 52 (1.1) 39 (0.8) 54 (1.0) 41 (0.8) 46 (1.2) 42 (1.1) 39 (1.2) 35 (1.0) 47 (0.9) 35 (1.2) 72 (1.2) –– 46 (0.3)
478 (4.7) 361 (3.1) 495 (3.7) 538 (4.0) 390 (5.2) 430 (3.7) 421 (4.2) 510 (3.2) 395 (5.8) 459 (3.6) 547 (3.2) 515 (3.7) 517 (3.1) 562 (2.9) 399 (4.7) –– 468 (1.0)
8 (0.6) 13 (0.5) 25 (1.2) 25 (1.0) 18 (1.0) 32 (1.4) 18 (0.9) 34 (1.3) 31 (1.6) 37 (1.8) 45 (1.6) 49 (1.4) 38 (1.2) 52 (1.7) 19 (1.4) –– 30 (0.3)
473 (6.7) 365 (4.3) 489 (5.3) 530 (3.4) 386 (7.2) 435 (4.0) 418 (4.7) 503 (3.3) 415 (6.2) 457 (4.1) 529 (3.2) 521 (3.4) 496 (2.8) 540 (2.7) 405 (7.0) –– 464 (1.2)
Average Scale Score 11.0 (0.05) 10.9 (0.03) 10.4 (0.07) 10.4 (0.05) 10.5 (0.06) 10.0 (0.08) 10.4 (0.05) 9.9 (0.06) 9.9 (0.07) 9.7 (0.08) 9.3 (0.06) 9.2 (0.06) 9.5 (0.05) 9.1 (0.07) 9.9 (0.04) ––
Students Like Learning Physics
Like Learning Physics
Physics Country Armenia Morocco Georgia Ukraine Kazakhstan Russian Federation Syrian Arab Republic Lebanon Macedonia, Rep. of Hungary Lithuania Romania Sweden Indonesia Finland Slovenia International Avg.
Somewhat Like Learning Physics
Do Not Like Learning Physics
Percent of Students
Average Achievement
Percent of Students
Average Achievement
Percent of Students
Average Achievement
44 (1.6) 42 (0.8) 42 (1.4) 40 (1.6) 39 (1.7) 34 (1.0) 29 (1.0) 27 (1.3) 25 (1.2) 20 (0.8) 19 (1.0) 17 (1.1) 13 (0.7) 12 (0.9) 9 (0.7) 7 (0.6) 26 (0.3)
465 (3.5) 404 (2.4) 447 (4.2) 523 (4.2) 512 (5.2) 562 (4.0) 453 (4.4) 446 (5.9) 456 (5.5) 555 (3.9) 536 (4.6) 499 (5.1) 559 (5.0) 409 (8.3) 602 (5.0) 586 (6.6) 501 (1.3)
40 (1.2) 47 (0.7) 40 (1.2) 42 (1.2) 52 (1.4) 48 (0.7) 55 (0.9) 52 (1.2) 49 (1.1) 39 (0.8) 41 (0.9) 45 (1.1) 46 (0.9) 75 (0.8) 32 (1.0) 28 (1.0) 46 (0.3)
424 (4.2) 362 (2.9) 418 (3.3) 491 (3.9) 478 (4.3) 536 (3.2) 421 (4.0) 391 (5.3) 393 (5.5) 519 (4.2) 512 (3.0) 461 (4.5) 518 (3.1) 408 (4.9) 559 (3.2) 550 (4.1) 465 (1.0)
16 (0.9) 11 (0.4) 18 (1.1) 19 (1.2) 9 (0.8) 18 (0.9) 16 (0.7) 22 (1.1) 26 (1.3) 41 (1.2) 40 (1.3) 38 (1.5) 41 (1.1) 13 (1.0) 58 (1.3) 65 (1.1) 28 (0.3)
419 (5.9) 370 (3.3) 402 (6.4) 484 (4.8) 486 (8.6) 523 (4.3) 419 (4.8) 399 (6.1) 413 (7.0) 514 (3.2) 508 (3.0) 461 (3.7) 499 (2.8) 415 (5.2) 544 (2.7) 536 (2.8) 462 (1.2)
Average Scale Score 10.9 (0.07) 11.0 (0.03) 10.7 (0.06) 10.6 (0.07) 10.8 (0.06) 10.5 (0.05) 10.4 (0.04) 10.2 (0.06) 10.0 (0.06) 9.4 (0.05) 9.4 (0.06) 9.5 (0.06) 9.3 (0.04) 9.9 (0.04) 8.7 (0.06) 8.4 (0.04)
Students Like Learning Earth Science
Earth Science Country Georgia Armenia Morocco Kazakhstan Ukraine Macedonia, Rep. of Romania Syrian Arab Republic Lithuania Russian Federation Sweden Hungary Finland Slovenia Indonesia Lebanon International Avg.
Like Learning Earth Science
Somewhat Like Learning Earth Science
Do Not Like Learning Earth Science
Percent of Students
Average Achievement
Percent of Students
Average Achievement
Percent of Students
Average Achievement
50 (1.2) 50 (1.5) 47 (0.8) 43 (1.6) 42 (1.6) 38 (1.4) 36 (1.4) 35 (1.5) 35 (1.3) 29 (1.1) 21 (0.8) 20 (1.2) 18 (0.9) 14 (0.8) 12 (1.0) –– 33 (0.3)
446 (3.3) 456 (3.3) 395 (2.1) 505 (4.6) 511 (4.4) 445 (4.9) 489 (3.7) 450 (4.7) 531 (3.1) 550 (3.9) 529 (3.9) 527 (5.4) 576 (4.3) 557 (4.5) 395 (8.7) –– 491 (1.2)
40 (1.0) 37 (1.0) 44 (0.7) 50 (1.3) 44 (1.2) 47 (1.1) 44 (1.0) 52 (1.2) 45 (0.9) 50 (0.8) 54 (0.8) 39 (0.9) 47 (0.8) 45 (1.2) 76 (0.9) –– 48 (0.3)
411 (3.8) 424 (4.0) 362 (3.2) 481 (4.5) 497 (4.2) 387 (5.6) 459 (4.9) 418 (4.0) 507 (2.8) 540 (3.6) 513 (3.0) 516 (3.9) 558 (2.6) 545 (3.0) 406 (4.2) –– 468 (1.0)
10 (0.7) 13 (0.8) 9 (0.4) 6 (0.7) 14 (1.1) 15 (1.0) 20 (1.3) 12 (0.9) 21 (1.1) 20 (1.1) 25 (1.0) 41 (1.7) 35 (1.2) 41 (1.5) 12 (0.8) –– 20 (0.3)
397 (6.1) 429 (6.5) 374 (3.5) 493 (10.0) 493 (5.5) 418 (9.8) 446 (5.5) 401 (6.7) 506 (4.3) 542 (4.3) 500 (3.9) 529 (3.0) 535 (2.6) 537 (3.4) 405 (6.4) –– 467 (1.5)
CLASSROOM INSTRUCTION CHAPTER 8
337
Average Scale Score 10.8 (0.05) 10.7 (0.07) 10.8 (0.03) 10.6 (0.06) 10.4 (0.07) 10.3 (0.06) 10.1 (0.07) 10.3 (0.05) 10.0 (0.07) 9.9 (0.06) 9.5 (0.04) 9.0 (0.08) 9.2 (0.05) 8.8 (0.07) 9.5 (0.04) ––
SOURCE: IEA’s Trends in International Mathematics and Science Study – TIMSS 2011
Students Like Learning Chemistry
Students Value Science Exhibit 8.3 presents the results for the TIMSS 2011 Students Value Science scale, which only was given at the eighth grade. The scale itself addresses six different aspects of valuing science:
I think learning science will help me in my daily life;
I need science to learn other school subjects;
I need to do well in science to get into the university of my choice;
I need to do well in science to get the job I want;
I would like a job that involves using science; and
It is important to do well in science.
Students in countries teaching the sciences as separate subjects were asked about each of the four science subjects and the results were scaled separately. On each scale, students with a score corresponding to “agreeing a lot” with three of the statements and “agreeing a little” with the other three, on average, were considered to Value science. In comparison, students in the Do Not Value science category “disagreed a little” with three of the statements and “agreed a little” with the other three, on average. The first page of Exhibit 8.3 presents the results for general or integrated science for the eighth grade countries, and also for the ninth grade and benchmarking participants. The second and third pages of the exhibit present the results for biology (second page) and chemistry, physics, and earth science (third page) in separate panels. Internationally, on average, eighth grade students in general or integrated science countries placed a high value on science. Forty-one percent were in the Value category and another 33 percent were in the Somewhat Value category, on average. However, about one-fourth (26%) were in the Do Not Value category. Across the eighth grade, ninth grade, and benchmarking participants, students who said they valued science typically had higher achievement than students who only valued it somewhat, and those students, in turn, had higher achievement than students who did not value science. Students in countries teaching the sciences as separate subjects do not seem to value the individual science subjects in the same way as students in general science countries value science. Across the four subjects, only about onefourth (25–29%) of the students reported that they value the science subjects, about one-third (33–36%) reported that they somewhat value the subjects, and about two-fifths (36–42%) reported that they did not value them. This
338
TIMSS 2011 INTERNATIONAL RESULTS IN SCIENCE CHAPTER 8
Reported by Students The general/integrated science panel summarizes responses for countries where students are enrolled in science as a single subject. The remaining panels for biology, chemistry, physics, and earth science summarize responses for countries where students are taught science as separate subjects. For general/integrated science, students were scored according to their degree of agreement with six statements on the Students Value Science scale. Students who Value science had a score on the scale of at least 10.5, which corresponds to their “agreeing a lot” with three of the six statements and “agreeing a little” with the other three, on average. Students who Do Not Value science had a score no higher than 8.6, which corresponds to their “disagreeing a little” with three of the six statements and “agreeing a little” with the other three, on average. All other students Somewhat Value science. For biology, chemistry, physics, and earth science, a comparable procedure was used. Students Value General/Integrated Science
General/Integrated Science Country Ghana Oman Jordan Tunisia Palestinian Nat’l Auth. Saudi Arabia United Arab Emirates Qatar Iran, Islamic Rep. of Thailand Malaysia Bahrain England Singapore Turkey Chile Israel United States New Zealand Hong Kong SAR Australia Norway Korea, Rep. of Italy Chinese Taipei Japan International Avg.
Value
Somewhat Value
Do Not Value
Average Scale Score
Percent of Students
Average Achievement
Percent of Students
Average Achievement
Percent of Students
Average Achievement
80 (1.0) 69 (0.7) 66 (1.0) 62 (0.9) 62 (1.3) 53 (1.2) 51 (0.7) 51 (1.3) 51 (1.0) 49 (1.3) 49 (1.6) 49 (1.0) 41 (1.3) 41 (0.8) 40 (0.8) 39 (0.8) 37 (1.2) 36 (0.7) 26 (0.8) 26 (1.0) 25 (1.3) 24 (0.9) 14 (0.6) 13 (0.6) 12 (0.7) 10 (0.7) 41 (0.2)
323 (5.1) 441 (3.0) 468 (3.1) 441 (2.7) 437 (3.1) 446 (3.9) 474 (2.8) 447 (4.0) 478 (4.7) 466 (4.1) 453 (5.7) 473 (2.6) 547 (5.9) 616 (4.6) 500 (4.2) 466 (2.8) 531 (4.9) 544 (3.0) 531 (5.3) 559 (4.1) 557 (6.4) 506 (4.1) 607 (4.1) 532 (5.7) 612 (4.2) 595 (4.9) 502 (0.8)
16 (0.8) 24 (0.6) 25 (0.8) 27 (0.7) 27 (0.9) 32 (0.8) 30 (0.5) 30 (0.9) 33 (0.8) 43 (1.0) 34 (0.9) 31 (0.8) 37 (0.9) 43 (0.7) 36 (0.6) 36 (0.7) 30 (0.8) 34 (0.5) 33 (0.8) 43 (0.8) 31 (0.8) 38 (1.0) 40 (0.9) 36 (0.9) 30 (0.7) 34 (1.0) 33 (0.2)
266 (7.2) 393 (5.0) 437 (5.6) 436 (2.9) 406 (4.4) 433 (4.4) 459 (3.1) 403 (4.7) 469 (4.2) 441 (4.0) 419 (6.4) 447 (3.2) 530 (4.7) 583 (4.3) 476 (3.8) 458 (2.8) 516 (4.7) 525 (2.7) 515 (5.2) 535 (3.8) 525 (5.5) 499 (3.7) 574 (2.3) 505 (2.8) 586 (2.8) 574 (2.7) 477 (0.8)
4 (0.4) 7 (0.4) 8 (0.5) 12 (0.6) 11 (0.7) 15 (0.8) 18 (0.5) 19 (1.0) 16 (0.7) 8 (0.5) 17 (1.1) 21 (0.8) 22 (0.9) 17 (0.6) 23 (0.8) 25 (0.8) 32 (1.0) 29 (0.6) 41 (1.2) 32 (1.1) 44 (1.3) 38 (1.1) 46 (1.0) 50 (0.8) 58 (1.1) 56 (1.1) 26 (0.2)
224 (10.5) 361 (6.2) 403 (7.9) 438 (5.0) 379 (7.3) 419 (6.2) 453 (2.8) 381 (8.2) 476 (5.1) 424 (5.8) 370 (9.2) 430 (5.0) 516 (5.9) 546 (5.9) 469 (4.7) 462 (3.5) 503 (4.2) 506 (2.9) 504 (4.4) 518 (4.0) 496 (3.8) 484 (2.6) 535 (2.2) 490 (3.1) 543 (2.2) 540 (2.7) 457 (1.1)
75 (0.8) 57 (1.0) ––
429 (3.0) 344 (3.5) ––
19 (0.6) 26 (0.6) ––
356 (4.8) 319 (4.7) ––
7 (0.4) 16 (0.7) ––
306 (9.0) 346 (6.8) ––
11.4 (0.03) 10.7 (0.05) ––
52 (1.0) 50 (1.1) 40 (1.5) 39 (1.3) 38 (1.0) 38 (1.7) 37 (1.3) 37 (1.4) 35 (1.8) 34 (1.4) 34 (1.1) 34 (1.3) 32 (1.3) 27 (1.1)
494 (3.3) 472 (4.6) 554 (6.5) 490 (7.2) 562 (3.2) 575 (4.7) 552 (5.2) 557 (5.6) 554 (7.7) 587 (5.9) 540 (3.3) 551 (6.1) 512 (5.5) 539 (3.1)
29 (0.8) 31 (0.8) 33 (1.2) 34 (0.9) 36 (0.9) 36 (1.1) 35 (1.0) 36 (1.0) 38 (1.4) 36 (1.1) 35 (0.9) 36 (0.8) 37 (1.2) 39 (0.8)
479 (3.7) 453 (5.1) 525 (7.8) 491 (8.0) 542 (2.6) 550 (5.0) 533 (5.5) 539 (6.0) 531 (8.3) 567 (5.3) 518 (3.4) 536 (4.6) 503 (5.7) 525 (3.1)
19 (0.7) 18 (0.9) 27 (1.1) 27 (1.3) 26 (1.0) 25 (1.5) 28 (1.3) 27 (1.2) 28 (1.7) 30 (1.5) 30 (0.9) 30 (1.2) 31 (1.1) 34 (1.1)
476 (3.3) 450 (5.2) 511 (6.2) 476 (4.5) 531 (3.1) 530 (5.3) 510 (5.1) 528 (5.0) 509 (7.7) 546 (6.4) 503 (3.4) 518 (5.6) 486 (4.8) 502 (2.8)
10.4 (0.04) 10.4 (0.05) 9.9 (0.06) 9.9 (0.06) 9.9 (0.05) 9.9 (0.07) 9.8 (0.07) 9.8 (0.06) 9.8 (0.08) 9.7 (0.07) 9.7 (0.05) 9.7 (0.07) 9.6 (0.05) 9.5 (0.05)
–
11.6 (0.04) 11.2 (0.03) 11.1 (0.04) 10.9 (0.04) 10.9 (0.05) 10.5 (0.05) 10.4 (0.03) 10.4 (0.06) 10.5 (0.04) 10.5 (0.04) 10.3 (0.07) 10.3 (0.05) 10.1 (0.05) 10.2 (0.03) 10.0 (0.04) 9.9 (0.03) 9.7 (0.06) 9.7 (0.03) 9.2 (0.05) 9.5 (0.04) 9.1 (0.07) 9.3 (0.04) 8.8 (0.03) 8.9 (0.03) 8.5 (0.05) 8.5 (0.04)
–
Ninth Grade Participants Botswana South Africa Honduras Benchmarking Participants Dubai, UAE Abu Dhabi, UAE North Carolina, US Alabama, US Alberta, Canada Minnesota, US Indiana, US Colorado, US Florida, US Massachusetts, US Ontario, Canada Connecticut, US California, US Quebec, Canada
Centerpoint of scale set at 10. ( ) Standard errors appear in parentheses. Because of rounding some results may appear inconsistent. A dash (–) indicates comparable data are not available. An “r” indicates data are available for at least 70% but less than 85% of the students.
CLASSROOM INSTRUCTION CHAPTER 8
339
SOURCE: IEA’s Trends in International Mathematics and Science Study – TIMSS 2011
Exhibit 8.3: Students StudentsValue ValueScience Science
SOURCE: IEA’s Trends in International Mathematics and Science Study – TIMSS 2011
Exhibit 8.3: Students StudentsValue ValueScience Science(Continued) (Continued) How much do you agree with these statements about ? Agree a lot
Agree a little
1) I think learning will help me in my daily life ----------------------------------------------- A 2) I need to learn other school subjects --- A 3) I need to do well in to get into the university of my choice ------------------------------------ A 4) I need to do well in to get the job I want - A 5) I would like a job that involves using --- A 6) It is important to do well in --------------- A Value
Disagree a little
Disagree a lot
A A
A A
A A
A A A A
A A A A
A A A A
Somewhat Value
Do Not Value
For General/ Integrated Science
10.5
8.6
For Biology
11.1
9.1
For Chemistry
11.3
9.5
For Physics
11.2
9.3
For Earth Science
11.4
9.3
Separate Science Panels Students Value Biology
Value
Biology Country Morocco Syrian Arab Republic Lebanon Macedonia, Rep. of Kazakhstan Georgia Ukraine Armenia Lithuania Indonesia Russian Federation Romania Hungary Slovenia T5r41130 Sweden Finland International Avg.
340
Somewhat Value
Do Not Value
Percent of Students
Average Achievement
Percent of Students
Average Achievement
Percent of Students
Average Achievement
60 (0.8) 55 (1.1) 40 (1.3) 39 (1.4) 38 (1.5) 32 (1.4) 32 (1.3) 26 (0.9) 25 (1.0) 24 (1.3) 23 (0.8) 20 (0.8) 17 (0.7) 13 (0.7) 13 (0.5) 6 (0.4) 29 (0.3)
376 (2.4) 431 (4.1) 415 (5.2) 384 (5.5) 482 (4.2) 412 (4.6) 495 (5.0) 425 (4.8) 514 (3.6) 405 (7.8) 534 (5.2) 459 (5.0) 520 (6.0) 549 (5.1) 526 (5.0) 577 (7.2) 469 (1.3)
29 (0.6) 33 (0.9) 37 (1.0) 33 (0.9) 40 (1.1) 34 (0.9) 36 (1.0) 32 (0.9) 37 (0.9) 62 (1.0) 30 (0.8) 31 (0.9) 29 (0.9) 38 (0.8) 38 (0.9) 26 (0.9) 35 (0.2)
378 (3.6) 427 (4.7) 400 (6.3) 418 (5.5) 488 (4.9) 432 (3.3) 499 (4.7) 433 (3.7) 511 (3.6) 404 (4.3) 535 (3.9) 463 (4.6) 515 (3.9) 544 (3.5) 518 (3.1) 564 (3.5) 471 (1.1)
11 (0.5) 13 (0.7) 23 (1.1) 28 (1.3) 22 (1.5) 34 (1.2) 32 (1.3) 42 (1.0) 37 (1.2) 14 (0.9) 47 (1.2) 49 (1.1) 54 (1.2) 49 (1.1) 49 (0.9) 68 (1.0) 36 (0.3)
393 (4.3) 420 (7.1) 402 (6.7) 448 (7.1) 516 (4.9) 437 (3.5) 512 (3.9) 454 (3.4) 520 (3.0) 418 (5.2) 553 (3.4) 473 (4.1) 529 (2.8) 542 (2.8) 507 (2.6) 549 (2.5) 480 (1.1)
TIMSS 2011 INTERNATIONAL RESULTS IN SCIENCE CHAPTER 8
Average Scale Score
–
11.4 (0.03) 11.3 (0.04) 10.6 (0.06) 10.5 (0.07) 10.6 (0.07) 10.1 (0.06) 10.1 (0.06) 9.8 (0.05) 9.9 (0.05) 10.3 (0.05) 9.6 (0.05) 9.4 (0.05) 9.2 (0.05) 9.3 (0.04) 9.4 (0.03) 8.6 (0.04)
–
Exhibit 8.3: Students StudentsValue ValueScience Science(Continued) (Continued) Value
Chemistry Country Morocco Syrian Arab Republic Kazakhstan Lebanon Macedonia, Rep. of Ukraine Lithuania Russian Federation Armenia Indonesia Romania Slovenia Hungary Sweden Finland Georgia International Avg.
r
Somewhat Value
Do Not Value
Percent of Students
Average Achievement
Percent of Students
Average Achievement
Percent of Students
56 (0.7) 48 (1.3) 39 (1.4) 36 (1.1) 33 (1.2) 26 (1.1) 25 (0.9) 22 (1.0) 20 (0.7) 17 (1.0) 16 (0.7) 15 (0.8) 14 (0.6) 11 (0.6) 7 (0.5) –– 26 (0.2)
378 (2.6) 430 (4.1) 487 (4.6) 411 (5.3) 386 (5.9) 498 (4.6) 519 (3.8) 544 (4.1) 428 (5.2) 392 (6.6) 462 (5.5) 566 (3.6) 518 (6.9) 518 (6.4) 584 (5.9) –– 475 (1.3)
29 (0.5) 33 (0.9) 40 (1.2) 37 (1.0) 29 (1.0) 34 (0.8) 34 (0.8) 29 (0.6) 23 (0.8) 55 (1.3) 26 (0.9) 37 (1.0) 24 (0.7) 33 (0.9) 26 (1.0) –– 33 (0.2)
375 (3.4) 426 (4.5) 489 (5.1) 400 (6.0) 409 (6.2) 501 (4.9) 513 (3.5) 539 (4.3) 427 (5.0) 397 (5.0) 464 (4.7) 549 (3.9) 517 (5.1) 520 (3.8) 570 (3.2) –– 473 (1.2)
15 (0.6) 19 (0.9) 20 (1.2) 27 (1.2) 38 (1.4) 40 (1.4) 41 (1.1) 49 (0.9) 57 (1.1) 28 (1.3) 57 (1.2) 48 (1.1) 62 (0.9) 56 (1.0) 67 (1.1) –– 42 (0.3)
390 (3.5) 433 (5.7) 507 (5.1) 412 (6.5) 442 (6.0) 506 (3.3) 513 (2.8) 545 (3.4) 449 (3.0) 411 (6.2) 471 (3.6) 533 (2.8) 528 (2.6) 510 (2.6) 545 (2.4) –– 479 (1.1)
Students Value Physics
Value
Physics Country Morocco Syrian Arab Republic Kazakhstan Lebanon Macedonia, Rep. of Georgia Ukraine Russian Federation Armenia Lithuania Indonesia Hungary Romania Slovenia Sweden Finland International Avg.
Somewhat Value Average Achievement
Percent of Students
Average Achievement
Percent of Students
60 (0.7) 47 (1.2) 42 (1.4) 37 (1.4) 36 (1.3) 34 (1.2) 29 (1.2) 27 (1.2) 27 (1.0) 23 (0.9) 20 (1.4) 17 (0.5) 16 (0.9) 13 (0.6) 13 (0.5) 7 (0.6) 28 (0.3)
379 (2.3) 429 (4.3) 491 (5.0) 415 (5.4) 390 (6.1) 422 (4.4) 508 (4.8) 553 (4.5) 440 (4.7) 521 (4.2) 397 (9.1) 539 (4.9) 460 (5.4) 564 (4.5) 528 (5.5) 581 (6.2) 476 (1.3)
26 (0.5) 33 (1.0) 40 (1.0) 36 (1.2) 29 (0.8) 32 (0.9) 35 (1.1) 32 (0.8) 28 (0.9) 35 (1.0) 58 (1.0) 27 (0.8) 26 (1.0) 36 (0.9) 35 (0.9) 24 (0.9) 33 (0.2)
378 (3.3) 425 (4.2) 486 (5.2) 400 (6.3) 415 (5.7) 426 (3.7) 503 (4.4) 544 (3.6) 434 (4.2) 513 (3.3) 409 (4.5) 521 (5.1) 472 (6.1) 551 (3.4) 522 (3.5) 570 (3.4) 473 (1.1)
14 (0.5) 20 (0.9) 18 (1.1) 27 (1.3) 35 (1.4) 33 (1.0) 36 (1.5) 41 (1.2) 45 (1.2) 41 (1.1) 22 (1.3) 56 (0.9) 58 (1.4) 51 (0.9) 52 (0.9) 69 (1.0) 39 (0.3)
Percent of Students
Average Achievement
Percent of Students
Average Achievement
Percent of Students
58 (0.7) 48 (1.3) 35 (1.2) 35 (1.4) 32 (1.2) 26 (0.8) 24 (1.2) 20 (0.9) 19 (1.0) 17 (1.2) 15 (0.6) 14 (0.7) 13 (0.7) 11 (0.6) 6 (0.5) –– 25 (0.3)
373 (2.3) 425 (4.3) 482 (4.5) 379 (5.5) 414 (4.8) 509 (3.7) 492 (5.5) 423 (5.0) 448 (4.6) 390 (8.1) 508 (4.8) 525 (5.0) 545 (5.1) 506 (7.2) 568 (7.6) –– 466 (1.4)
28 (0.5) 32 (0.9) 43 (0.9) 35 (1.0) 35 (0.9) 39 (0.9) 39 (1.0) 32 (0.9) 33 (1.0) 58 (1.2) 43 (0.9) 29 (0.9) 40 (0.9) 26 (0.8) 30 (0.9) –– 36 (0.2)
378 (2.9) 427 (4.8) 487 (4.7) 417 (5.3) 426 (4.0) 516 (2.9) 505 (4.4) 432 (4.1) 468 (4.7) 402 (4.5) 519 (3.1) 542 (4.0) 549 (3.8) 514 (4.4) 565 (2.9) –– 476 (1.1)
14 (0.5) 20 (1.2) 22 (1.3) 30 (1.4) 33 (1.3) 35 (1.0) 38 (1.5) 48 (1.2) 48 (1.4) 25 (1.4) 42 (1.0) 57 (1.3) 47 (1.0) 62 (1.2) 64 (1.0) –– 39 (0.3)
393 (3.8) 437 (5.1) 506 (4.9) 408 (6.7) 436 (6.5) 436 (3.3) 498 (3.2) 535 (3.3) 447 (3.6) 513 (2.6) 424 (4.6) 521 (2.5) 468 (3.4) 533 (2.9) 508 (2.6) 546 (2.5) 476 (1.0)
Country Morocco Syrian Arab Republic Kazakhstan Macedonia, Rep. of Georgia Lithuania Ukraine Armenia Romania Indonesia Sweden Russian Federation Slovenia Hungary Finland Lebanon International Avg.
Somewhat Value
–
Do Not Value
CLASSROOM INSTRUCTION CHAPTER 8
341
–
11.4 (0.03) 11.0 (0.05) 10.9 (0.06) 10.5 (0.06) 10.2 (0.07) 10.2 (0.05) 10.0 (0.06) 10.0 (0.05) 9.9 (0.05) 9.8 (0.05) 10.2 (0.05) 9.2 (0.04) 9.1 (0.06) 9.3 (0.04) 9.4 (0.03) 8.6 (0.05)
–
Average Scale Score
Average Achievement
404 (3.4) 436 (6.4) 516 (5.6) 449 (6.4) 443 (3.6) 517 (3.3) 506 (3.9) 453 (3.3) 474 (4.1) 422 (4.3) 509 (3.1) 548 (3.4) 539 (2.9) 531 (2.5) 547 (2.4) –– 486 (1.1)
11.4 (0.03) 11.1 (0.05) 10.9 (0.05) 10.7 (0.05) 10.2 (0.07) 10.0 (0.06) 10.0 (0.05) 9.9 (0.05) 9.4 (0.05) 10.2 (0.04) 9.3 (0.06) 9.7 (0.04) 9.1 (0.04) 9.5 (0.03) 8.9 (0.04) ––
Average Scale Score
Average Achievement
Students Value Earth Science
Value
–
Do Not Value
Percent of Students
Earth Science
Average Scale Score
Average Achievement
–
11.6 (0.03) 11.1 (0.06) 10.7 (0.06) 10.5 (0.07) 10.3 (0.06) 10.1 (0.05) 10.0 (0.06) 9.7 (0.05) 9.6 (0.06) 10.2 (0.05) 9.8 (0.03) 9.3 (0.06) 9.5 (0.04) 9.0 (0.05) 8.9 (0.04) ––
–
SOURCE: IEA’s Trends in International Mathematics and Science Study – TIMSS 2011
Students Value Chemistry
may be partly due to the nature of the questions making up the Students Value Science scale, several of which may be more suited to a general subject such as reading, mathematics, or science than to the more specific biology, chemistry, physics, and earth science. For example, students may indeed value science very highly and yet not agree that they “need biology to learn other school subjects” (question 2 on the scale), or that they “need to do well in earth science to get the job I want” (question 4 on the scale). As a result, the Students Value Science scale may underestimate the extent to which students in separate science countries actually value science, and inflate the percentage of students in the Do Not Value category. This may somewhat explain the absence of relationship with science achievement in chemistry and physics and the anomalous finding of higher average science achievement among students who Do Not Value biology and earth science compared to those who do value these subjects. Students Confident in Science Exhibit 8.4 presents the fourth grade results for the TIMSS 2011 Students Confident in Science scale, which includes six statements such as “Science is harder for me than for many of my classmates” (reverse coded) and “My teacher tells me I am good at science” (see second page of exhibit for all six statements). Confident students “agreed a lot” with three of the six statements and “agreed a little” to the other three, on average. Students Not Confident in science “disagreed a little” with three of the statements and “agreed a little” with the other three, on average. Internationally, on average, 43 percent of the fourth grade students expressed confidence in their science ability. Average science achievement was highest for the Confident fourth grade students and lowest (by 68 points) for the students lacking confidence (21% across countries). Similar to the results for “liking” to learn science at the eighth grade, students in some of the highest performing countries expressed the least confidence. For the sixth grade participants, somewhat fewer students expressed confidence (28–39%) and somewhat more expressed a lack of confidence (23–30%). As shown in Exhibit 8.5 (second page), the TIMSS 2011 Student Confidence with Science scale for the eighth grade included nine statements, five of which also were included in the fourth grade scale. As with the other attitudinal scales, students in countries teaching the sciences as separate subjects were asked about each of the four science subjects and the results were scaled separately. On average internationally, only 20 percent of the eighth grade
342
TIMSS 2011 INTERNATIONAL RESULTS IN SCIENCE CHAPTER 8
students in general or integrated science countries expressed confidence in their science ability, with 49 percent Somewhat Confident and 31 percent Not Confident. The average achievement gap was large—86 points—between the Confident students and those Not Confident. To at least some extent, the eighth grade results for general or integrated science held constant across the ninth grade and benchmarking participants. The eighth grade students in separate science countries were similar to students in general or integrated countries in their confidence with biology and earth science (21–19% confident, respectively), but less confident with chemistry and physics (14% confident for each). In all four science subjects there was a strong positive relationship between student confidence and average science achievement.
CLASSROOM INSTRUCTION CHAPTER 8
343
Reported by Students Students were scored according to their degree of agreement with six statements on the Students Confident in Science scale. Students Confident in science had a score on the scale of at least 10.1, which corresponds to their “agreeing a lot” with three of the six statements and “agreeing a little” with the other three, on average. Students who were Not Confident had a score no higher than 8.3, which corresponds to their “disagreeing a little” with three of the six statements and “agreeing a little” with the other three, on average. All other students were Somewhat Confident in science.
Confident
Country Croatia Iran, Islamic Rep. of Austria Turkey Saudi Arabia Norway Germany Georgia Oman Romania Kazakhstan United Arab Emirates Tunisia Serbia Kuwait Hungary Sweden Russian Federation United States Azerbaijan Ireland Malta Poland Slovenia Bahrain Armenia Qatar Lithuania Slovak Republic Chinese Taipei Australia Spain Portugal Netherlands Italy Czech Republic Finland Northern Ireland Belgium (Flemish) Denmark England Yemen Chile New Zealand Morocco Singapore Hong Kong SAR Thailand Japan Korea, Rep. of International Avg.
r
Somewhat Confident
Average Achievement
Percent of Students
Average Achievement
Percent of Students
Average Achievement
62 (0.9) 61 (1.0) 59 (1.0) 57 (1.0) 56 (1.5) 55 (1.3) 53 (1.1) 53 (1.2) 52 (0.9) 52 (1.3) 52 (1.5) 51 (0.8) 51 (1.4) 51 (1.4) 50 (1.2) 50 (1.0) 49 (1.2) 48 (1.2) 48 (0.8) 47 (1.8) 47 (1.5) 47 (0.9) 46 (0.9) 46 (1.0) 46 (1.5) 46 (1.2) 45 (1.3) 45 (1.0) 44 (1.1) 44 (1.3) 42 (1.0) 41 (1.2) 41 (1.7) 39 (1.5) 39 (1.0) 38 (1.2) 38 (1.1) 37 (1.4) 37 (1.0) 36 (1.0) 33 (1.3) 30 (1.9) 30 (0.9) 28 (1.2) 27 (1.4) 26 (0.6) 25 (0.9) 19 (1.0) 17 (0.8) 15 (0.7) 43 (0.2)
529 (2.0) 479 (3.5) 549 (2.9) 498 (3.3) 463 (5.0) 507 (2.1) 548 (3.0) 488 (3.2) 426 (4.5) 544 (4.5) 509 (5.2) 463 (2.8) 380 (6.2) 536 (3.1) 388 (5.5) 568 (3.4) 547 (3.0) 570 (3.9) 567 (2.0) 482 (5.6) 533 (3.6) 478 (2.4) 528 (2.5) 543 (2.5) 488 (3.5) 440 (4.0) 453 (5.3) 534 (2.5) 556 (3.2) 573 (2.4) 535 (3.2) 532 (2.4) 548 (4.2) 545 (2.9) 540 (2.8) 556 (3.0) 587 (3.3) 537 (2.9) 525 (2.4) 540 (3.1) 549 (4.5) 269 (7.4) 520 (3.5) 530 (3.4) 317 (5.3) 620 (3.6) 560 (4.6) 500 (5.9) 581 (3.1) 623 (3.8) 514 (0.5)
25 (0.8) 27 (0.8) 28 (0.9) 30 (0.7) 28 (1.0) 33 (1.1) 33 (0.9) 28 (1.0) 29 (0.7) 29 (1.0) 33 (1.3) 30 (0.6) 35 (1.2) 35 (1.1) 31 (0.8) 30 (0.8) 40 (1.1) 32 (0.8) 32 (0.6) 32 (1.3) 36 (1.1) 29 (0.8) 35 (0.7) 37 (0.8) 33 (1.1) 30 (0.8) 31 (0.9) 37 (1.0) 35 (0.9) 35 (0.8) 36 (0.9) 33 (1.0) 44 (1.4) 44 (1.0) 44 (0.8) 38 (1.1) 43 (0.9) 40 (1.0) 42 (0.9) 44 (0.9) 38 (1.1) 41 (1.3) 37 (0.7) 40 (1.0) 43 (1.0) 36 (0.6) 36 (0.9) 49 (1.2) 48 (0.9) 45 (0.8) 36 (0.1)
505 (3.1) 423 (5.1) 522 (3.0) 437 (4.7) 409 (6.6) 486 (4.0) 524 (3.5) 443 (5.0) 344 (5.1) 491 (7.5) 485 (6.2) 411 (3.6) 329 (6.4) 512 (4.0) 338 (5.9) 520 (4.1) 530 (3.3) 548 (4.2) 538 (3.2) 435 (6.0) 516 (3.7) 435 (3.0) 502 (3.1) 515 (3.4) 448 (3.6) 409 (5.8) 378 (4.8) 511 (2.9) 529 (4.7) 550 (3.2) 516 (3.4) 499 (4.0) 514 (3.7) 529 (2.4) 524 (3.0) 538 (3.1) 571 (2.6) 520 (3.0) 510 (2.2) 529 (2.8) 530 (3.8) 204 (7.7) 481 (2.7) 504 (3.5) 257 (5.7) 592 (3.6) 539 (3.8) 471 (6.2) 564 (2.2) 598 (2.1) 480 (0.6)
13 (0.7) 11 (0.6) 13 (0.7) 13 (0.7) 16 (1.0) 11 (0.7) 13 (0.8) 19 (0.9) 19 (0.6) 19 (1.2) 15 (0.9) 18 (0.5) 14 (0.8) 14 (1.0) 19 (0.9) 21 (0.9) 11 (0.7) 20 (0.8) 20 (0.6) 20 (1.0) 17 (1.0) 24 (0.7) 19 (0.7) 17 (0.7) 21 (1.0) 25 (1.0) 24 (1.2) 18 (0.8) 20 (0.8) 21 (1.0) 22 (0.9) 26 (1.1) 15 (1.1) 17 (0.9) 17 (0.8) 24 (1.0) 19 (0.8) 23 (1.1) 22 (0.8) 20 (0.9) 29 (1.1) 29 (1.7) 33 (0.9) 32 (1.0) 31 (1.6) 37 (0.7) 39 (1.3) 32 (1.3) 34 (1.0) 40 (1.0) 21 (0.1)
479 (3.9) 393 (6.5) 478 (5.2) 389 (6.8) 370 (10.0) 466 (4.8) 483 (4.5) 412 (5.7) 303 (6.5) 435 (10.1) 479 (7.7) 368 (3.6) 278 (10.5) 456 (7.4) 285 (7.2) 483 (5.1) 500 (5.5) 521 (4.1) 507 (3.0) 409 (6.2) 481 (7.0) 400 (4.0) 460 (5.2) 475 (4.8) 396 (5.7) 386 (5.1) 333 (7.4) 478 (4.1) 488 (4.9) 512 (4.4) 484 (4.4) 477 (4.0) 474 (5.6) 507 (4.0) 496 (4.5) 505 (4.2) 540 (4.6) 482 (4.4) 478 (3.0) 509 (4.9) 506 (3.4) 171 (8.4) 449 (3.0) 463 (3.6) 231 (6.0) 552 (4.0) 516 (4.8) 458 (6.9) 541 (3.2) 562 (2.3) 446 (0.8)
Centerpoint of scale set at 10. ( ) Standard errors appear in parentheses. Because of rounding some results may appear inconsistent. An “r” indicates data are available for at least 70% but less than 85% of the students.
344
Not Confident
Percent of Students
TIMSS 2011 INTERNATIONAL RESULTS IN SCIENCE CHAPTER 8
Average Scale Score 10.9 (0.05) 10.9 (0.05) 10.7 (0.04) 10.6 (0.05) 10.7 (0.07) 10.5 (0.05) 10.4 (0.05) 10.5 (0.06) 10.5 (0.05) 10.4 (0.06) 10.4 (0.07) 10.4 (0.03) 10.3 (0.07) 10.4 (0.06) 10.4 (0.05) 10.3 (0.05) 10.2 (0.05) 10.2 (0.05) 10.1 (0.03) 10.2 (0.07) 10.1 (0.06) 10.1 (0.04) 10.1 (0.04) 10.1 (0.05) 10.2 (0.07) 10.2 (0.06) 10.2 (0.05) 10.0 (0.04) 10.0 (0.05) 10.1 (0.06) 9.9 (0.04) 9.8 (0.05) 10.0 (0.06) 9.8 (0.05) 9.9 (0.04) 9.7 (0.06) 9.7 (0.04) 9.7 (0.05) 9.7 (0.04) 9.7 (0.04) 9.5 (0.05) 9.6 (0.07) 9.4 (0.04) 9.3 (0.05) 9.4 (0.06) 9.1 (0.03) 9.1 (0.05) 9.1 (0.04) 8.9 (0.03) 8.8 (0.03)
SOURCE: IEA’s Trends in International Mathematics and Science Study – TIMSS 2011
Exhibit 8.4: Students StudentsConfident ConfidentininScience Science
Confident
Country
Somewhat Confident
Not Confident Average Achievement
Average Scale Score
Percent of Students
Average Achievement
Percent of Students
Average Achievement
Percent of Students
39 (1.9) 32 (1.3) 28 (1.7)
389 (7.5) 448 (6.2) 474 (8.0)
38 (1.2) 41 (0.9) 42 (1.2)
335 (6.9) 348 (5.6) 429 (5.2)
23 (1.6) 27 (1.0) 30 (1.3)
298 (9.2) 308 (6.6) 402 (5.9)
10.0 (0.08) 9.6 (0.05) 9.5 (0.07)
55 (1.5) 53 (0.9) 53 (1.3) 50 (1.7) 47 (1.3) 47 (1.6) 41 (1.0)
556 (4.5) 494 (3.1) 557 (2.6) 449 (4.9) 528 (2.9) 565 (4.5) 548 (3.2)
30 (1.4) 30 (0.9) 34 (1.0) 31 (1.1) 38 (1.0) 30 (1.5) 38 (0.9)
531 (5.5) 452 (3.4) 533 (3.0) 393 (6.8) 512 (3.2) 540 (4.2) 525 (3.6)
16 (1.2) 16 (0.6) 14 (0.7) 19 (1.1) 15 (0.9) 23 (1.3) 21 (1.1)
498 (6.5) 400 (5.6) 506 (5.9) 354 (6.0) 491 (4.5) 517 (4.5) 497 (4.7)
10.4 (0.06) 10.4 (0.04) 10.4 (0.06) 10.3 (0.07) 10.1 (0.05) 10.1 (0.07) 9.9 (0.05)
Sixth Grade Participants Yemen Botswana Honduras Benchmarking Participants North Carolina, US Dubai, UAE Alberta, Canada Abu Dhabi, UAE Quebec, Canada Florida, US Ontario, Canada
How much do you agree with these statements about science? Agree a lot
Agree a little
A
A
A
A
A A A A A
A A A A A
A A A A A
A A A A A
Confident
Somewhat Confident
1) I usually do well in science --------------------------------------2) Science is harder for me than for many of my classmates* --------------------------------------------------3) I am just not good at science* ----------------------------------4) I learn things quickly in science --------------------------------5) My teacher tells me I am good at science -------------------6) Science is harder for me than any other subject* ----------
Disagree a little
Disagree a lot
* Reverse coded
10.1
T5r41132
Not Confident 8.3
CLASSROOM INSTRUCTION CHAPTER 8
345
SOURCE: IEA’s Trends in International Mathematics and Science Study – TIMSS 2011
Exhibit 8.4: Students StudentsConfident ConfidentininScience Science(Continued) (Continued)
Reported by Students The general/integrated science panel summarizes responses for countries where students are enrolled in science as a single subject. The remaining panels for biology, chemistry, physics, and earth science summarize responses for countries where students are taught science as separate subjects. For general/integrated science, students were scored according to their degree of agreement with nine statements on the Students Confident in Science scale. Students Confident in science had a score on the scale of at least 11.5, which corresponds to their “agreeing a lot” with five of the nine statements and “agreeing a little” with the other four, on average. Students who were Not Confident had a score no higher than 9.0, which corresponds to their “disagreeing a little” with five of the nine statements and “agreeing a little” with the other four, on average. All other students were Somewhat Confident in science. For biology, chemistry, physics, and earth science, a comparable procedure was used. Students Confident in General/Integrated Science
General/Integrated Science Country Tunisia Iran, Islamic Rep. of Israel Oman Jordan Saudi Arabia United Arab Emirates Qatar Ghana United States Turkey Palestinian Nat’l Auth. Norway England Bahrain Chile Australia Singapore New Zealand Italy Hong Kong SAR Chinese Taipei Thailand Korea, Rep. of Malaysia Japan International Avg.
Confident
Somewhat Confident
Not Confident
Average Scale Score
Percent of Students
Average Achievement
Percent of Students
Average Achievement
Percent of Students
Average Achievement
37 (1.1) 33 (1.0) 33 (1.2) 29 (0.9) 29 (1.0) 29 (1.2) 29 (0.7) 28 (1.6) 27 (1.1) 26 (0.7) 25 (1.0) 23 (1.1) 23 (1.0) 23 (1.2) 23 (0.9) 18 (0.7) 16 (1.1) 14 (0.5) 14 (0.9) 13 (0.8) 8 (0.6) 6 (0.4) 5 (0.4) 4 (0.3) 4 (0.4) 3 (0.3) 20 (0.2)
464 (2.9) 509 (4.5) 568 (4.0) 487 (2.9) 507 (3.4) 481 (4.0) 512 (2.7) 496 (5.4) 372 (5.1) 565 (3.3) 549 (5.8) 480 (3.6) 535 (3.6) 579 (5.2) 511 (4.1) 498 (3.0) 575 (6.5) 630 (5.9) 570 (5.8) 540 (3.8) 579 (4.9) 648 (4.9) 498 (7.8) 652 (4.6) 511 (9.0) 631 (7.7) 536 (1.0)
51 (0.9) 50 (0.7) 43 (1.0) 57 (0.8) 56 (0.8) 54 (1.0) 52 (0.5) 51 (1.4) 56 (0.8) 47 (0.5) 48 (0.9) 55 (1.0) 55 (0.9) 52 (1.2) 52 (0.9) 55 (1.0) 49 (1.1) 48 (0.7) 46 (0.9) 61 (1.0) 47 (1.1) 27 (0.9) 58 (1.3) 33 (0.8) 45 (1.1) 28 (0.9) 49 (0.2)
427 (2.4) 463 (4.0) 501 (4.6) 407 (3.3) 440 (4.0) 426 (3.8) 454 (2.8) 404 (3.5) 295 (5.1) 524 (2.6) 474 (3.4) 414 (3.9) 494 (3.0) 529 (5.4) 450 (2.6) 459 (2.8) 527 (4.8) 600 (4.8) 519 (5.3) 505 (2.7) 544 (4.1) 599 (3.1) 451 (4.3) 603 (2.1) 437 (6.2) 591 (2.6) 482 (0.8)
11 (0.6) 17 (0.8) 24 (1.1) 14 (0.4) 15 (0.7) 17 (1.0) 19 (0.7) 22 (0.9) 16 (0.8) 27 (0.7) 26 (0.9) 22 (1.0) 22 (1.1) 25 (1.2) 25 (0.9) 27 (1.3) 35 (1.4) 37 (0.8) 40 (1.2) 26 (1.1) 45 (1.3) 67 (1.0) 37 (1.5) 63 (0.9) 51 (1.3) 69 (1.1) 31 (0.2)
414 (3.9) 443 (4.7) 477 (4.8) 360 (5.2) 407 (6.5) 401 (6.0) 428 (3.1) 368 (6.2) 256 (8.8) 492 (3.0) 441 (3.9) 379 (5.7) 456 (3.8) 503 (5.0) 418 (4.2) 444 (3.5) 486 (4.6) 562 (4.2) 490 (4.6) 473 (4.2) 520 (3.4) 543 (2.3) 448 (4.2) 532 (1.9) 411 (6.5) 540 (2.6) 450 (0.9)
17 (0.6) 16 (0.9) 15 (0.7)
399 (4.1) 404 (5.3) 485 (4.3)
59 (0.6) 60 (1.0) 54 (0.9)
326 (3.5) 368 (4.4) 401 (3.7)
24 (0.7) 24 (1.3) 31 (1.1)
323 (5.6) 353 (4.2) 381 (4.7)
10.1 (0.03) 10.0 (0.05) 9.9 (0.04)
33 (2.1) 32 (1.1) 28 (1.9) 28 (1.6) 27 (1.1) 27 (1.4) 27 (2.0) 27 (1.5) 26 (1.4) 24 (1.8) 24 (1.4) 22 (0.9) 21 (1.0) 19 (1.0)
604 (6.4) 528 (3.5) 576 (6.7) 575 (7.4) 509 (5.4) 570 (5.4) 595 (4.4) 544 (4.3) 579 (5.5) 570 (7.9) 517 (8.3) 560 (3.7) 588 (2.9) 550 (3.7)
46 (1.2) 50 (0.9) 44 (1.3) 46 (1.2) 53 (0.9) 46 (1.0) 45 (1.2) 47 (1.1) 49 (1.1) 47 (1.6) 47 (1.4) 49 (1.0) 53 (0.9) 60 (0.8)
561 (5.0) 474 (3.6) 531 (5.1) 532 (7.0) 450 (4.5) 532 (4.9) 553 (3.9) 496 (4.5) 539 (5.4) 535 (7.6) 488 (6.0) 521 (2.9) 543 (2.9) 521 (2.7)
21 (1.9) 18 (0.7) 28 (1.7) 27 (1.8) 20 (1.1) 27 (1.8) 27 (1.7) 27 (1.8) 25 (1.7) 29 (2.4) 29 (2.0) 30 (1.1) 26 (1.2) 21 (1.0)
526 (4.4) 446 (4.4) 501 (5.2) 490 (5.1) 429 (5.1) 500 (5.0) 515 (5.3) 464 (5.6) 511 (5.0) 499 (8.3) 462 (6.7) 492 (3.4) 519 (3.0) 491 (3.7)
10.7 (0.12) 10.7 (0.05) 10.4 (0.10) 10.3 (0.11) 10.5 (0.05) 10.4 (0.09) 10.3 (0.10) 10.4 (0.09) 10.4 (0.08) 10.2 (0.11) 10.2 (0.09) 10.1 (0.05) 10.2 (0.06) 10.2 (0.05)
–
11.1 (0.05) 10.8 (0.05) 10.6 (0.07) 10.7 (0.04) 10.7 (0.04) 10.6 (0.06) 10.6 (0.04) 10.5 (0.07) 10.6 (0.05) 10.3 (0.04) 10.3 (0.05) 10.4 (0.05) 10.4 (0.05) 10.2 (0.06) 10.2 (0.05) 10.0 (0.05) 9.8 (0.06) 9.6 (0.03) 9.6 (0.05) 9.9 (0.04) 9.2 (0.04) 8.3 (0.05) 9.3 (0.04) 8.7 (0.03) 9.1 (0.04) 8.4 (0.04)
–
Ninth Grade Participants South Africa Honduras Botswana Benchmarking Participants Massachusetts, US Dubai, UAE Connecticut, US North Carolina, US Abu Dhabi, UAE Indiana, US Minnesota, US California, US Colorado, US Florida, US Alabama, US Ontario, Canada Alberta, Canada Quebec, Canada
Centerpoint of scale set at 10. ( ) Standard errors appear in parentheses. Because of rounding some results may appear inconsistent. A dash (–) indicates comparable data are not available. A tilde (~) indicates insufficient data to report achievement. An “r” indicates data are available for at least 70% but less than 85% of the students.
346
TIMSS 2011 INTERNATIONAL RESULTS IN SCIENCE CHAPTER 8
SOURCE: IEA’s Trends in International Mathematics and Science Study – TIMSS 2011
Exhibit 8.5: Students StudentsConfident ConfidentininScience Science
SOURCE: IEA’s Trends in International Mathematics and Science Study – TIMSS 2011
Exhibit 8.5: Students StudentsConfident ConfidentininScience Science(Continued) (Continued) How much do you agree with these statements about ? Agree a lot
Agree a little
A
A
A
A
A A A A A
A A A A A
A A A A A
A A A A A
A A A
A A A
A A A
A A A
1) I usually do well in ----------------------------------2) is more difficult for me than for many of my classmates* -----------------------------------------3) is not one of my strengths* ----------------------4) I learn things quickly in ----------------------------5) makes me confused and nervous* -------------6) I am good at working out difficult problems 7) My teacher thinks I can do well in with difficult materials ----8) My teacher tells me I am good at ---------------9) is harder for me than any other subject* -----* Reverse coded
Confident
Disagree a little
Somewhat Confident
Disagree a lot
Not Confident
For General/ Integrated Science
11.5
9.0
For Biology
11.4
8.5
For Chemistry
11.9
9.3
For Physics
11.9
9.2
For Earth Science
11.5
8.7
Separate Science Panels Students Confident in Biology
Confident
Biology Country Georgia Syrian Arab Republic Kazakhstan Macedonia, Rep. of Russian Federation Hungary Ukraine Morocco Romania T5r81132 Lebanon Lithuania Armenia Slovenia Sweden Finland Indonesia International Avg.
Somewhat Confident
Not Confident
Percent of Students
Average Achievement
Percent of Students
Average Achievement
Percent of Students
Average Achievement
32 (1.0) 31 (1.3) 27 (1.4) 27 (1.0) 23 (0.9) 22 (1.1) 22 (1.1) 22 (0.7) 21 (1.1) 21 (1.1) 19 (0.8) 16 (0.8) 15 (0.8) 14 (0.7) 14 (0.8) 5 (0.5) 21 (0.2)
472 (3.2) 458 (4.6) 516 (4.7) 478 (4.8) 565 (4.2) 563 (3.7) 533 (5.0) 424 (2.6) 504 (3.6) 467 (6.4) 547 (4.0) 486 (3.9) 572 (3.9) 558 (4.8) 592 (3.9) 412 (10.7) 509 (1.2)
48 (0.9) 58 (1.1) 61 (1.2) 54 (1.0) 57 (0.9) 52 (0.9) 58 (1.0) 59 (0.7) 55 (0.9) 56 (1.1) 58 (0.9) 55 (1.0) 61 (0.9) 66 (0.9) 59 (1.0) 67 (1.4) 58 (0.2)
417 (3.3) 418 (3.5) 486 (4.7) 392 (5.7) 543 (3.3) 518 (3.3) 501 (3.5) 370 (2.7) 466 (3.7) 400 (5.5) 513 (2.7) 438 (3.4) 547 (2.9) 517 (2.5) 557 (2.5) 403 (5.1) 468 (0.9)
20 (0.9) 11 (0.8) 11 (0.8) 19 (1.0) 20 (0.8) 25 (1.2) 20 (1.0) 19 (0.6) 25 (1.2) 23 (1.2) 23 (1.1) 29 (1.2) 24 (1.1) 20 (0.9) 27 (1.1) 29 (1.6) 22 (0.3)
380 (4.6) 398 (5.5) 469 (6.7) 381 (7.0) 519 (3.9) 499 (4.9) 472 (5.5) 353 (3.2) 439 (6.1) 368 (5.8) 492 (4.4) 419 (4.4) 517 (4.5) 474 (3.3) 530 (3.4) 413 (4.5) 445 (1.2)
CLASSROOM INSTRUCTION CHAPTER 8
347
Average Scale Score
–
10.6 (0.06) 10.7 (0.06) 10.5 (0.07) 10.3 (0.05) 10.1 (0.05) 10.0 (0.07) 10.1 (0.06) 10.1 (0.03) 9.9 (0.06) 10.0 (0.06) 9.9 (0.05) 9.6 (0.05) 9.7 (0.05) 9.8 (0.04) 9.6 (0.05) 9.2 (0.04)
–
Exhibit 8.5: Students StudentsConfident ConfidentininScience Science(Continued) (Continued)
Confident
Chemistry Country Lebanon Kazakhstan Morocco Syrian Arab Republic Slovenia Macedonia, Rep. of Russian Federation Hungary Lithuania Ukraine Sweden Finland Romania Armenia Indonesia Georgia International Avg.
r
Somewhat Confident
Not Confident
Percent of Students
Average Achievement
Percent of Students
Average Achievement
Percent of Students
21 (1.3) 21 (1.2) 17 (0.6) 17 (0.9) 16 (0.7) 15 (0.8) 14 (0.8) 14 (0.7) 13 (0.8) 13 (0.8) 12 (0.7) 12 (0.7) 12 (0.8) 9 (0.6) 2 (0.4) –– 14 (0.2)
462 (6.5) 523 (5.4) 427 (2.9) 462 (5.0) 595 (3.7) 493 (6.6) 583 (4.8) 572 (4.9) 562 (3.7) 552 (5.1) 563 (5.1) 608 (4.2) 525 (5.7) 504 (4.7) ~~ –– 531 (1.3)
57 (1.1) 55 (1.0) 59 (0.6) 60 (0.9) 49 (0.8) 51 (1.1) 44 (1.1) 40 (1.2) 44 (1.0) 42 (0.9) 61 (1.0) 41 (1.2) 42 (1.2) 42 (1.0) 53 (1.7) –– 49 (0.3)
399 (5.0) 487 (4.5) 371 (2.7) 424 (4.1) 550 (3.1) 403 (5.1) 548 (4.1) 521 (3.6) 517 (3.3) 506 (3.7) 518 (2.8) 566 (2.7) 470 (4.4) 444 (3.9) 389 (5.3) –– 474 (1.0)
22 (1.1) 24 (1.1) 23 (0.6) 23 (0.8) 35 (1.2) 34 (1.3) 42 (1.3) 46 (1.4) 43 (1.3) 45 (1.2) 27 (1.2) 47 (1.6) 46 (1.6) 50 (1.3) 44 (1.9) –– 37 (0.3)
376 (6.9) 478 (5.6) 361 (3.3) 419 (4.6) 513 (3.2) 396 (5.9) 525 (3.3) 511 (3.5) 498 (3.3) 485 (4.0) 482 (3.3) 531 (2.9) 449 (3.6) 428 (3.6) 415 (5.0) –– 458 (1.1)
Students Confident in Physics
Confident
Physics Country Georgia Kazakhstan Morocco Syrian Arab Republic Lebanon Hungary Russian Federation Macedonia, Rep. of Armenia Ukraine Sweden Lithuania Finland Slovenia Romania Indonesia International Avg.
Somewhat Confident
Average Achievement
Percent of Students
Average Achievement
Percent of Students
20 (1.0) 20 (1.2) 19 (0.7) 18 (0.8) 18 (1.1) 18 (0.8) 17 (0.7) 17 (0.9) 15 (0.7) 13 (1.0) 11 (0.7) 9 (0.6) 9 (0.7) 9 (0.5) 8 (0.6) 3 (0.6) 14 (0.2)
479 (4.6) 520 (6.2) 425 (3.0) 465 (4.8) 463 (7.5) 580 (3.7) 584 (4.1) 492 (5.9) 502 (4.4) 557 (6.5) 569 (4.8) 563 (4.4) 609 (4.9) 614 (4.8) 520 (6.1) 392 (13.2) 521 (1.5)
46 (0.9) 55 (1.1) 59 (0.7) 63 (0.8) 55 (1.2) 43 (0.9) 51 (1.2) 53 (1.0) 51 (0.9) 50 (1.2) 62 (0.8) 41 (1.2) 39 (1.3) 40 (1.1) 45 (1.1) 57 (1.7) 51 (0.3)
428 (4.0) 488 (4.6) 372 (2.5) 423 (3.9) 403 (5.5) 524 (3.9) 545 (3.5) 398 (5.2) 442 (3.4) 505 (3.6) 520 (2.6) 519 (3.1) 569 (2.9) 559 (3.4) 471 (4.3) 401 (5.9) 473 (1.0)
34 (1.1) 25 (1.3) 22 (0.7) 19 (0.7) 27 (1.3) 39 (1.0) 32 (1.3) 31 (1.2) 35 (1.1) 37 (1.5) 26 (0.8) 50 (1.4) 52 (1.5) 52 (1.2) 47 (1.3) 40 (2.0) 35 (0.3)
398 (3.5) 480 (4.9) 364 (3.2) 418 (5.0) 379 (5.7) 498 (3.1) 517 (3.9) 400 (6.2) 414 (3.8) 480 (3.8) 480 (3.3) 502 (2.9) 535 (2.7) 521 (3.0) 455 (3.8) 423 (3.9) 454 (1.0)
Country Macedonia, Rep. of Kazakhstan Georgia Russian Federation Syrian Arab Republic Lithuania Romania Morocco Hungary Sweden Slovenia Armenia Finland Ukraine Indonesia Lebanon International Avg. 348
Somewhat Confident
Average Achievement
Percent of Students
Average Achievement
Percent of Students
30 (1.1) 28 (1.5) 26 (1.1) 23 (0.9) 22 (1.1) 21 (0.9) 21 (1.1) 20 (0.5) 19 (1.0) 18 (0.9) 16 (0.7) 16 (0.8) 15 (0.9) 15 (1.0) 3 (0.4) –– 19 (0.2)
479 (5.4) 518 (4.7) 482 (3.7) 563 (3.3) 460 (6.0) 550 (3.1) 509 (3.4) 420 (2.8) 555 (4.2) 542 (4.4) 576 (4.4) 489 (4.0) 590 (4.1) 546 (5.2) 389 (12.6) –– 511 (1.4)
54 (0.9) 59 (1.2) 50 (1.0) 56 (0.9) 62 (1.0) 52 (1.0) 53 (1.0) 61 (0.6) 48 (1.0) 66 (0.9) 58 (1.1) 57 (1.0) 58 (0.9) 56 (1.0) 60 (1.6) –– 57 (0.3)
393 (6.0) 485 (4.7) 420 (3.4) 545 (3.2) 421 (3.9) 513 (3.0) 467 (4.2) 370 (2.4) 521 (3.8) 515 (2.7) 549 (2.8) 440 (3.4) 558 (2.5) 504 (3.6) 398 (5.4) –– 473 (1.0)
16 (0.8) 13 (0.9) 24 (1.0) 22 (1.0) 16 (0.9) 27 (1.1) 26 (1.2) 19 (0.5) 33 (1.3) 15 (0.7) 26 (1.3) 27 (1.1) 28 (1.2) 29 (1.3) 37 (1.8) –– 24 (0.3)
TIMSS 2011 INTERNATIONAL RESULTS IN SCIENCE CHAPTER 8
–
Not Confident
Percent of Students
–
10.3 (0.05) 10.5 (0.07) 10.5 (0.03) 10.5 (0.04) 10.4 (0.07) 10.1 (0.06) 10.3 (0.05) 10.2 (0.06) 10.1 (0.05) 9.9 (0.07) 10.1 (0.04) 9.4 (0.06) 9.3 (0.07) 9.3 (0.04) 9.5 (0.05) 9.6 (0.05)
–
Average Scale Score
Average Achievement
367 (6.4) 470 (5.7) 385 (4.0) 516 (4.8) 411 (5.4) 490 (3.5) 434 (4.5) 362 (3.1) 509 (3.7) 472 (5.0) 513 (3.7) 415 (4.4) 525 (2.5) 477 (4.1) 419 (3.8) –– 451 (1.1)
10.6 (0.06) 10.7 (0.06) 10.4 (0.03) 10.4 (0.05) 10.1 (0.05) 10.1 (0.06) 9.9 (0.05) 9.7 (0.06) 9.8 (0.06) 9.8 (0.06) 10.2 (0.04) 9.6 (0.07) 9.7 (0.06) 9.4 (0.05) 9.5 (0.04) ––
Average Scale Score
Average Achievement
Students Confident in Earth Science
Confident
–
Not Confident
Percent of Students
Earth Science
Average Scale Score
Average Achievement
–
10.6 (0.06) 10.7 (0.07) 10.3 (0.06) 10.2 (0.05) 10.2 (0.06) 10.0 (0.06) 10.0 (0.07) 10.1 (0.03) 9.8 (0.07) 10.2 (0.04) 9.8 (0.05) 9.7 (0.05) 9.7 (0.06) 9.7 (0.06) 9.1 (0.04) ––
–
SOURCE: IEA’s Trends in International Mathematics and Science Study – TIMSS 2011
Students Confident in Chemistry
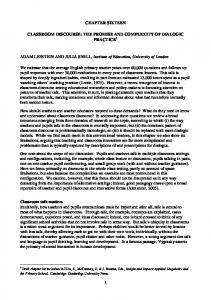
Instructional Time Instructional Time Spent on Science It is difficult to examine the effect of instructional time on student achievement, because a wide variety of factors influence the productivity of instruction hours—most importantly, the quality of the curriculum and instructional approaches (and all of the variables influencing them). In addition, the relationship between instructional time and student achievement is highly dependent on the effectiveness of the educational system. If an education system essentially is ineffective, increasing the amount of instruction time will have diminishing returns. Also, most countries implement levels of instructional time across their systems so that any variation is unintended and rarely related to achievement. Despite the difficulties in studying its effects, instructional time remains a crucial resource in considering students’ opportunity to learn. If everything else about schooling was equal and of high quality, more instructional time should result in increased student learning. For example, a recent study published by the London School of Economics used data from PISA 2006 and from 10- and 13-year-olds in Israel to compare achievement estimates for the same students across curriculum subjects, and found that instructional time has a positive and significant effect on achievement (Lavy, 2010). Exhibits 8.6 and 8.7 present principals’ and teachers’ reports about the instructional hours per year spent on science instruction, respectively, at the fourth and eighth grades. The results for the time spent on science instruction were based on a series of calculations. As explained on the second page of the exhibits, principals provided the number of school days per year and the number of instructional hours per day. This information was combined to provide the yearly total number of instructional hours in each country shown in the first column of the exhibit. There was substantial variation across countries, but the fourth grade students in the TIMSS 2011 countries averaged about 900 hours per year of instruction, while those in the eighth grade averaged about 1,000 hours. Teachers reported the weekly amount of instruction in science. This information was combined with the data provided by principals to estimate yearly amounts of instructional time in science for each TIMSS 2011 participant (second column in the exhibits). On average, the fourth grade countries reported devoting 85 hours per year to science instruction, although the amount of instructional time varied widely across the fourth grade, sixth grade, and benchmarking participants, from a low of 39 to a high of 162 hours.
CLASSROOM INSTRUCTION CHAPTER 8
349
8.6: Instructional Time Spent on Science Exhibit Exhibit 8.6: Instructional Time Spent on Science Total Instructional Hours per Year
Country Portugal Chile Spain Qatar Oman Georgia Thailand United Arab Emirates Iran, Islamic Rep. of United States Slovenia Slovak Republic Finland Singapore Austria Croatia Turkey Tunisia Korea, Rep. of Yemen Japan Chinese Taipei Hong Kong SAR Kuwait Bahrain Saudi Arabia Italy England Sweden Germany Hungary Serbia Northern Ireland Australia Poland Ireland Denmark Azerbaijan Lithuania Czech Republic Kazakhstan Romania Norway Armenia New Zealand Russian Federation Morocco Netherlands Malta Belgium (Flemish) International Avg.
r r r s r r r
r r r r r r r r r r r r
r
r r s r r
940 (13.1) 1228 (22.6) 884 (9.7) 1068 (9.1) 999 (17.4) 748 (18.7) 1201 (20.9) 1025 (8.5) 727 (11.2) 1078 (7.3) 684 (0.0) 780 (8.8) 779 (9.8) 1012 (0.0) 808 (6.9) 776 (19.4) 900 (19.3) 963 (22.9) 789 (11.4) 831 (14.1) 891 (3.7) 989 (13.4) 1059 (11.2) 928 (23.1) 964 (10.8) 977 (19.4) 1085 (12.6) 970 (8.3) 849 (11.3) 863 (11.2) 760 (12.2) 778 (18.5) 970 (11.1) 1008 (6.9) 764 (13.5) 854 (0.0) 863 (9.4) 804 (27.7) 649 (9.0) 782 (8.2) 779 (10.6) 796 (17.9) 817 (10.7) 851 (17.1) 925 (3.9) 660 (8.0) 1040 (23.6) 1074 (9.9) 891 (0.2) 1010 (16.8) 897 (2.0)
SOURCE: IEA’s Trends in International Mathematics and Science Study – TIMSS 2011
Reported by Principals and Teachers
Hours per Year for Science Instruction r s r s r s r
r r r s r r r s s s s s r s
s s s s r
162 (4.1) 161 (6.4) 145 (2.6) 135 (6.8) 120 (2.4) 110 (2.7) 109 (4.9) 108 (3.0) 106 (3.2) 105 (3.1) 101 (1.2) 101 (4.3) 98 (1.9) 96 (2.1) 96 (2.3) 95 (2.4) 94 (1.8) 93 (5.4) 92 (2.5) 91 (5.6) 91 (0.8) 90 (2.3) 88 (4.2) 85 (5.8) 85 (2.7) 82 (4.2) 78 (1.8) 76 (3.2) 75 (3.0) 75 (3.5) 72 (2.2) 72 (5.0) 72 (3.9) 65 (2.3) 64 (3.1) 63 (6.6) 62 (1.9) 61 (1.4) 60 (1.5) 60 (2.2) 57 (1.3) 56 (6.2) 55 (2.2) 54 (0.6) 52 (3.0) 49 (0.7) 44 (5.5) 42 (2.4) 39 (0.1) –– 85 (0.5) 0
40
80
120
160
200
240
280
( ) Standard errors appear in parentheses. Because of rounding some results may appear inconsistent. A dash (–) indicates comparable data not available. An “r” indicates data are available for at least 70% but less than 85% of the students. An “s” indicates data are available for at least 50% but less than 70% of the students.
350
TIMSS 2011 INTERNATIONAL RESULTS IN SCIENCE CHAPTER 8
320
Total Instructional Hours per Year
Country
Hours per Year for Science Instruction
Sixth Grade Participants Honduras Botswana Yemen
s r
1024 (16.9) 1143 (23.2) 831 (14.4)
r s r
161 (5.0) 114 (5.0) 84 (5.3)
1006 (8.8) 1073 (19.7) 1033 (18.1) 993 (0.7) 1113 (22.9) 969 (7.4) 916 (5.1)
s s s s r r
130 (4.1) 113 (9.6) 110 (6.8) 99 (1.6) 94 (6.0) 92 (3.2) 50 (1.7)
Benchmarking Participants Alberta, Canada Florida, US Abu Dhabi, UAE Dubai, UAE North Carolina, US Ontario, Canada Quebec, Canada
r r r r
0
Total Instructional Hours per Year
Hours per Year for Science Instruction
=
=
Principal Reports of School Days per Year Teacher Reports of Weekly Science Instructional Hours Principal Reports of School Days per Week
40
80
120
160
X
Principal Reports of Instructional Hours per Day
X
Principal Reports of School Days per Year
200
CLASSROOM INSTRUCTION CHAPTER 8
240
351
280
320
SOURCE: IEA’s Trends in International Mathematics and Science Study – TIMSS 2011
Exhibit 8.6: Instructional InstructionalTime TimeSpent Spenton onScience Science(Continued) (Continued)
Exhibit 8.7: Instructional Time Spent on Science Exhibit 8.7: Instructional Time Spent on Science Total Instructional Hours per Year
Country Macedonia, Rep. of Romania Lithuania Slovenia Kazakhstan Armenia Ukraine Hungary Russian Federation Georgia Finland Indonesia Oman Chinese Taipei Syrian Arab Republic Ghana Morocco Chile Jordan Israel Australia Qatar New Zealand Bahrain Japan Korea, Rep. of Malaysia Saudi Arabia Iran, Islamic Rep. of Thailand United Arab Emirates Singapore Palestinian Nat’l Auth. Hong Kong SAR England Norway Turkey Sweden Italy Tunisia Lebanon United States International Avg.
r
r
r r r r r r r
r r r r r r r r r
1023 (21.4) 984 (15.5) 898 (13.9) 798 (0.0) 920 (9.9) 979 (12.8) 901 (10.7) 836 (12.2) 882 (8.7) 833 (10.8) 934 (11.7) 1494 (40.9) 1044 (17.7) 1153 (11.7) 811 (14.2) 1153 (18.9) 1303 (24.9) 1245 (23.5) 1041 (11.9) 1108 (14.1) 1038 (7.2) 1054 (1.3) 959 (4.4) 1019 (1.1) 1016 (6.7) 1006 (12.1) 1198 (13.7) 1050 (20.9) 994 (15.9) 1270 (15.1) 1046 (8.0) 1106 (0.0) 918 (7.3) 1026 (11.3) 992 (8.4) 880 (6.3) 889 (16.7) 969 (13.5) 1085 (9.4) 1299 (25.4) 1028 (12.7) 1114 (6.6) 1031 (2.3)
SOURCE: IEA’s Trends in International Mathematics and Science Study – TIMSS 2011
Reported by Principals and Teachers
Hours per Year for Science Instruction* s r s
r r r s r r r r r s r r
r s r s s r
334 (14.7) 281 (10.1) 251 (5.2) 251 (4.6) 244 (4.8) 240 (4.9) 239 (4.0) 236 (4.8) 208 (1.6) 198 (6.8) 190 (6.0) 190 (12.2) 161 (3.8) 157 (2.7) 150 (7.5) 148 (6.1) 144 (2.0) 134 (3.8) 134 (3.1) 132 (3.9) 131 (4.5) 131 (6.9) 130 (2.6) 130 (2.8) 128 (1.7) 126 (2.5) 126 (3.6) 124 (6.8) 120 (3.6) 119 (2.9) 115 (2.7) 115 (2.1) 107 (3.4) 103 (4.6) 102 (3.1) 101 (3.3) 99 (1.1) 94 (3.1) 73 (1.0) 64 (1.9) xx xx 158 (0.8) 0
40
80
120
160
200
240
280
* For countries teaching science as separate subjects, total hours across subjects. ( ) Standard errors appear in parentheses. Because of rounding some results may appear inconsistent. A dash (–) indicates comparable data not available. An “r” indicates data are available for at least 70% but less than 85% of the students. An “s” indicates data are available for at least 50% but less than 70% of the students. An “x” indicates data are available for less than 50% of students.
352
TIMSS 2011 INTERNATIONAL RESULTS IN SCIENCE CHAPTER 8
320
Total Instructional Hours per Year
Country
SOURCE: IEA’s Trends in International Mathematics and Science Study – TIMSS 2011
Exhibit 8.7: Instructional InstructionalTime TimeSpent Spenton onScience Science (Continued) Hours per Year for Science Instruction*
Ninth Grade Participants Honduras South Africa Botswana
r r r
1152 (27.1) 1193 (11.3) 1114 (20.2)
r s r
162 (6.9) 152 (5.6) 137 (5.2)
r
1135 (16.3) 1087 (13.6) 1031 (10.0) 1043 (14.8) 1071 (19.3) 1148 (17.0) 1132 (14.9) 1022 (1.5) 1045 (16.6) 913 (3.3) 972 (7.4) 1040 (15.1) 1119 (17.0) 1159 (16.0)
s s r s s s s s s r r
167 (6.0) 156 (6.1) 145 (4.0) 140 (8.3) 139 (6.2) 138 (6.0) 132 (6.5) 125 (3.6) 111 (4.8) 102 (3.0) 96 (3.5) xx xx xx
Benchmarking Participants Alabama, US Massachusetts, US Alberta, Canada Minnesota, US Connecticut, US Colorado, US Indiana, US Dubai, UAE Abu Dhabi, UAE Quebec, Canada Ontario, Canada California, US Florida, US North Carolina, US
r r r r r r
0
40
80
120
160
200
240
280
For Countries Teaching Science as Separate Subjects
Hours per Year for Instruction
Country
All Science Subjects
Macedonia, Rep. of Romania Lithuania Slovenia Kazakhstan Armenia Ukraine Hungary Russian Federation Georgia Finland Indonesia Syrian Arab Republic Morocco Lebanon International Avg.
s r s
r r r r r
334 (14.7) 281 (10.1) 251 (5.2) 251 (4.6) 244 (4.8) 240 (4.9) 239 (4.0) 236 (4.8) 208 (1.6) 198 (6.8) 190 (6.0) 190 (12.2) 150 (7.5) 144 (2.0) xx 225 (1.9)
Total Instructional Hours per Year
Hours per Year for Science Instruction
Biology
s r s
r r r r s
=
=
86 (6.1) 50 (4.1) 44 (1.7) 60 (2.2) 57 (1.6) 60 (2.0) 62 (1.2) 62 (2.2) 51 (0.6) 71 (4.8) 43 (2.0) 61 (5.5) 53 (2.4) 36 (0.6) xx 57 (0.8)
Principal Reports of School Days per Year Teacher Reports of Weekly Science Instructional Hours Principal Reports of School Days per Week
Chemistry
84 (4.5) 83 (4.6) 70 (2.5) 69 (1.7) 70 (1.6) 59 (1.2) 65 (2.9) 59 (2.2) 52 (0.7) –– 55 (2.1) 37 (2.5) 40 (3.0) 36 (0.6) xx 56 (0.7)
s r s
r r r
Physics
s
s
r r r r
85 (6.3) 77 (2.8) 67 (2.4) 64 (2.0) 60 (1.5) 63 (2.2) 61 (0.9) 56 (2.1) 53 (1.0) 64 (2.4) 51 (1.7) 56 (5.0) 40 (3.0) 36 (0.6) xx 59 (0.8)
X
Principal Reports of Instructional Hours per Day
X
Principal Reports of School Days per Year
CLASSROOM INSTRUCTION CHAPTER 8
Earth Science
80 (4.2) 71 (2.2) 70 (2.8) 58 (1.4) 56 (1.5) 58 (1.4) 51 (1.4) 60 (2.9) 52 (0.6) 63 (2.9) 42 (2.2) 37 (2.5) 18 (0.8) 36 (0.6) –– 54 (0.6)
s
s
s r r r s
353
320
Instructional time for science was much greater at the eighth grade, with the eighth grade countries devoting an average of 158 hours to science instruction, and there was greater variability across countries, from 64 to 334 hours. The large increase in science instructional time compared to the fourth grade was mainly the result of the greater attention given to science instruction in the separate science countries. For these countries, the number of hours reported for each of biology, chemistry, physics, and earth science is shown on the second page of Exhibit 8.7. The separate science countries devote 54 to 59 hours per year, on average, to each science subject, for an overall average of 225 hours of science instruction per year. It should be noted that the variation across countries in science instructional time at both the fourth and eighth grades (including the sixth and ninth grades, respectively, and the benchmarking participants) is due to countries spending different amounts of time on total schooling, and allocating different amounts of the total time to science instruction, and in different ways. Finally, it should be understood that providing time for instruction is a necessary but not sufficient condition for student learning; the time allocated for instruction is a resource that needs to be used effectively, and efficiently. Students Taught the TIMSS Science Topics The science content and topic areas assessed in TIMSS 2011 are elaborated in the Science Framework, with each topic area for the fourth and eighth grades presented as comprehensive lists of objectives. Developed collaboratively by the participating countries, the TIMSS topics do not represent the “least common denominator” but rather a forward-looking conception of science teaching and learning. Exhibit 8.8 presents teachers’ reports about the TIMSS science topics that actually had been taught to students in fourth grade classrooms either prior to or during the year of the assessment. The exhibit shows, for each TIMSS participant, the percentage of students whose teachers reported that the students had been taught each of the topics, averaged across all science topics and across all topics within each science content domain. The topics are shown on the second page of the exhibit. At the fourth grade, teachers were asked about a total of 20 topics: six in life science, eight in physical science, and six in earth science. At the fourth grade, according to their teachers, 64 percent of students, on average, had been taught the TIMSS science topics overall. There was considerable variation across countries, from 93 percent in Kuwait to 38 percent in Japan. On average, the percentage of students taught various topics was
354
TIMSS 2011 INTERNATIONAL RESULTS IN SCIENCE CHAPTER 8
highest for life science (75%), next highest for earth science (63%), and lowest for physical science (57%). However, including the fourth grade, sixth grade, and the benchmarking participants, there was considerable variation from topic to topic and from participant to participant. Exhibit 8.9 presents teachers’ reports about the TIMSS science topics that actually had been taught to students in eighth grade science classrooms either prior to or during the year of the assessment. The exhibit shows, for each participant, the percentage of students whose teachers reported that the students had been taught each of the topics, averaged across all science topics and across all topics within each science content domain. The topics are shown on the second page of the exhibit. At the eighth grade, teachers were asked about a total of 20 topics: seven in biology, four in chemistry, five in physics, and four in earth science. At the eighth grade, on average, 72 percent of students had been taught the science topics overall. Teachers’ reports about the degree of implementation ranged from 98 percent in Macedonia to 39 percent in Norway. Chemistry had the greatest degree of coverage, with 81 percent of students having been taught the chemistry topics at the eighth grade, followed by physics, with 75 percent of students taught the topics. The coverage for biology and earth science was similar, with 68 percent of the students being taught the topics in each of those two content areas. It should be emphasized that there was considerable variation across participants in relative coverage of the topics in the content domains. National Research Coordinators were asked to indicate whether each of the TIMSS 2011 science topics was included in their countries’ intended curriculum through the fourth or eighth grade, and if so, whether the topics were intended to be taught to “all or almost all students” or “only the more able students.” The results for the fourth and eighth grades are summarized in Exhibits 8.10 and 8.11. On average, across countries, the majority of the assessment topics were intended for all students—14 out of 20 at the fourth grade, and 17 out of 20 at the eighth grade. At the fourth grade, the results varied topic by topic and country by country. However, of the six life science topics, on average, five were included in the curriculum for all students and one was not included; of the eight physical science topics, five were included and two were not; and of the six earth science topics, four were included and two were not. At the eighth grade, there was also considerable variation across countries, but with most of the topics in each content domain included in the curriculum for all students. On average across the eighth grade students, six of the seven biology topics, three of the four
CLASSROOM INSTRUCTION CHAPTER 8
355
Exhibit Percentage ofthe Students TIMSS Science Topics* Exhibit 8.8: Percentage of8.8: Students Taught TIMSS Taught Sciencethe Topics* All Science (20 Topics)
Country Armenia Australia Austria Azerbaijan Bahrain Belgium (Flemish) Chile Chinese Taipei Croatia Czech Republic Denmark England Finland Georgia Germany Hong Kong SAR Hungary Iran, Islamic Rep. of Ireland Italy Japan Kazakhstan Korea, Rep. of Kuwait Lithuania Malta Morocco Netherlands New Zealand Northern Ireland Norway Oman Poland Portugal Qatar Romania Russian Federation Saudi Arabia Serbia Singapore Slovak Republic Slovenia Spain Sweden Thailand Tunisia Turkey United Arab Emirates United States Yemen International Avg.
r r
r
s r
r r r
r
r
69 (1.9) 58 (1.8) 71 (1.1) 77 (1.5) 76 (1.8) 41 (1.2) 69 (1.2) 58 (1.6) 56 (1.1) 59 (1.2) 55 (1.4) 71 (1.7) 55 (1.2) 70 (1.5) 59 (1.2) 56 (1.9) 67 (1.2) 70 (1.3) 71 (1.4) 57 (1.1) 38 (1.5) –– 50 (1.9) 93 (0.8) 79 (1.4) 58 (0.0) 50 (1.6) 47 (2.0) 54 (1.7) 61 (2.1) 56 (1.4) 70 (1.0) 66 (1.2) 85 (1.7) 64 (1.6) 92 (0.9) –– 81 (1.3) 85 (1.1) 41 (0.8) 87 (0.8) 64 (1.4) 72 (1.3) 53 (1.6) 66 (2.3) 46 (1.2) 75 (1.2) 65 (1.0) 72 (1.0) 54 (1.9) 64 (0.2)
Life Science (6 Topics) s r
r
s r
r s r
r
r
73 (2.2) 69 (2.0) 83 (1.1) 80 (2.0) 80 (1.9) 57 (1.9) 87 (1.3) 69 (2.1) 81 (1.4) 85 (1.3) 63 (2.4) 72 (2.4) 73 (1.6) 85 (1.5) 73 (1.5) 72 (2.4) 91 (1.1) 69 (2.2) 73 (1.8) 69 (1.5) 34 (2.0) –– 56 (2.3) 96 (0.7) 98 (0.4) 67 (0.0) 72 (1.6) 60 (2.0) 66 (2.0) 74 (2.3) 67 (1.9) 87 (1.0) 83 (1.3) 96 (1.0) 77 (2.4) 95 (1.1) –– 82 (1.6) 88 (1.3) 47 (1.3) 96 (0.7) 71 (1.5) 89 (1.2) 59 (2.7) 79 (2.0) 75 (1.7) 69 (1.9) 64 (1.1) 73 (1.2) 65 (2.1) 75 (0.2)
Physical Science (8 Topics) s s
r
s r
r s r
r
r
56 (2.7) 47 (2.6) 58 (1.9) 69 (1.9) 75 (2.4) 27 (1.5) 48 (2.6) 61 (2.0) 36 (1.6) 37 (1.6) 48 (1.9) 78 (1.8) 43 (1.8) 46 (2.3) 52 (2.0) 48 (2.3) 49 (1.9) 73 (1.3) 68 (2.0) 44 (1.7) 42 (1.8) –– 44 (2.4) 93 (1.2) 64 (2.1) 57 (0.1) 45 (1.9) 32 (2.5) 44 (2.2) 57 (2.8) 34 (2.0) 73 (1.1) 41 (2.1) 75 (3.3) 58 (2.1) 93 (1.3) –– 88 (1.5) 92 (1.5) 59 (0.9) 83 (1.3) 69 (2.0) 56 (2.4) 34 (1.9) 54 (3.1) 42 (1.5) 88 (0.9) 62 (1.3) 67 (1.4) 54 (2.3) 57 (0.3)
Earth Science (6 Topics) s s
r
s r
r s r
s
r
81 (2.0) 62 (2.3) 76 (1.3) 86 (1.7) 75 (2.7) 44 (1.6) 78 (1.7) 43 (2.1) 59 (1.3) 62 (2.1) 58 (2.2) 62 (2.9) 53 (1.6) 86 (1.6) 53 (1.5) 51 (2.1) 67 (1.7) 66 (1.4) 72 (1.8) 64 (1.6) 36 (1.7) –– 52 (2.2) 91 (1.4) 81 (2.0) 53 (0.1) 34 (2.2) 54 (3.4) 56 (1.9) 53 (3.0) 75 (2.0) 49 (1.6) 82 (1.0) 88 (1.0) 60 (1.8) 88 (1.0) –– 70 (1.9) 74 (1.5) 12 (1.1) 85 (1.1) 52 (2.0) 76 (1.8) 73 (2.4) 68 (2.9) 23 (1.7) 66 (2.0) 69 (1.3) 77 (1.3) 43 (2.5) 63 (0.3)
* Percentage mostly taught before or in the assessment year averaged across topics. ( ) Standard errors appear in parentheses. Because of rounding some results may appear inconsistent. A dash (–) indicates comparable data are not available. An “r” indicates data are available for at least 70% but less than 85% of the students. An “s” indicates data are available for at least 50% but less than 70% of the students.
356
TIMSS 2011 INTERNATIONAL RESULTS IN SCIENCE CHAPTER 8
SOURCE: IEA’s Trends in International Mathematics and Science Study – TIMSS 2011
Reported by Teachers
Country
All Science (20 Topics)
Life Science (6 Topics)
Physical Science (8 Topics)
Earth Science (6 Topics)
86 (1.3) 78 (1.3) 71 (1.7)
90 (1.4) 98 (0.5) 79 (2.0)
91 (1.4) 54 (2.9) 74 (2.0)
76 (2.3) 90 (1.5) 58 (2.8)
SOURCE: IEA’s Trends in International Mathematics and Science Study – TIMSS 2011
Exhibit 8.8: Percentage of Students Taught the TIMSS Science Topics* Exhibit 8.8: Percentage of Students Taught the TIMSS Science Topics* (Continued) (Continued)
Sixth Grade Participants Botswana Honduras Yemen Benchmarking Participants Alberta, Canada Ontario, Canada Quebec, Canada Abu Dhabi, UAE Dubai, UAE Florida, US North Carolina, US
r
r s r
48 (1.6) 52 (1.5) 52 (1.9) 65 (1.7) 63 (1.2) 79 (1.7) 66 (1.9)
r
r s r
60 (2.4) 67 (2.1) 59 (2.4) 61 (2.1) 66 (1.4) 74 (3.2) 76 (2.7)
r r r s r
46 (2.3) 46 (2.3) 43 (2.4) 66 (2.3) 59 (1.3) 77 (3.0) 56 (2.8)
r r r s r
40 (2.4) 44 (2.0) 58 (2.3) 66 (2.2) 66 (2.3) 86 (2.6) 71 (3.4)
TIMSS 2011 Science Topics A. Life Science 1) Major body structures and their functions in humans and other organisms (plants and animals) 2) Life cycles and reproduction in plants and animals 3) Physical features, behavior, and survival of organisms living in different environments 4) Relationships in a given community (e.g., simple food chains, predator-prey relationships) 5) Changes in environments (effects of human activity, pollution and its prevention) 6) Human health (e.g., transmission/prevention of communicable diseases, signs of health/illness, diet, exercise) B. Physical Science 1) States of matter (solids, liquids, gases) and differences in their physical properties (shape, volume), including changes in state of matter by heating and cooling 2) Classification of objects/materials based on physical properties (e.g., weight/mass, volume, magnetic attraction) 3) Forming and separating mixtures 4) Familiar changes in materials (e.g., decaying, burning, rusting, cooking) 5) Common energy sources/forms and their practical uses (e.g., the Sun, electricity, water, wind) 6) Light (e.g., sources, behavior) 7) Electrical circuits and properties of magnets 8) Forces that cause objects to move (e.g., gravity, push/pull forces) C. Earth Science 1) Water on Earth (location, types, and movement) and air (composition, proof of its existence, uses) 2) Common features of Earth’s landscape (e.g., mountains, plains, rivers, deserts) and relationship to human use (e.g., farming, irrigation, land development) 3) Weather conditions from day to day or over the seasons 4) Fossils of animals and plants (age, location, formation) 5) Earth’s solar system (planets, Sun, moon) 6) Day, night, and shadows due to Earth’s rotation and its relationship to the Sun
CLASSROOM INSTRUCTION CHAPTER 8
357
Exhibit 8.9: Percentage PercentageofofStudents StudentsTaught Taughtthe theTIMSS TIMSSScience ScienceTopics* Topics* All Science (20 Topics)
Country Armenia Australia Bahrain Chile Chinese Taipei England Finland Georgia Ghana Hong Kong SAR Hungary Indonesia Iran, Islamic Rep. of Israel Italy Japan Jordan Kazakhstan Korea, Rep. of Lebanon Lithuania Macedonia, Rep. of Malaysia Morocco New Zealand Norway Oman Palestinian Nat'l Auth. Qatar Romania Russian Federation Saudi Arabia Singapore Slovenia Sweden Syrian Arab Republic Thailand Tunisia Turkey Ukraine United Arab Emirates United States International Avg.
s
r
r r
r
s
93 (0.6) 58 (1.1) 85 (0.8) 78 (1.2) 68 (0.9) 87 (1.3) 59 (1.0) 64 (0.7) 68 (1.5) 56 (1.3) 83 (0.8) 67 (1.6) 91 (0.6) 74 (1.0) 77 (1.1) 57 (0.7) 89 (0.9) –– 54 (0.9) 80 (1.3) 72 (1.0) 98 (0.3) 63 (1.0) 57 (0.7) 48 (1.3) 39 (1.0) 77 (0.8) 86 (1.0) 79 (1.9) 95 (0.4) –– 88 (1.0) 65 (1.1) 63 (0.8) 67 (1.3) 66 (1.8) 74 (1.4) 40 (1.4) 89 (0.6) 70 (0.8) 72 (1.0) 84 (0.8) 72 (0.2)
Biology (7 Topics) s
r
r r
r
r s
89 (1.0) 47 (1.6) 81 (1.2) 83 (1.5) 92 (1.9) 86 (1.5) 35 (1.5) 63 (1.6) 73 (1.7) 54 (1.9) 75 (1.7) 73 (2.2) 82 (1.2) 70 (1.4) 81 (1.1) 35 (1.1) 89 (1.1) –– 38 (1.3) 71 (2.0) 69 (1.9) 97 (0.6) 61 (1.4) 56 (1.2) 40 (1.7) 29 (1.5) 73 (1.0) 80 (1.5) 75 (2.2) 90 (1.1) –– 86 (1.3) 63 (1.4) 61 (1.5) 58 (1.5) 63 (2.4) 69 (2.1) 46 (1.6) 93 (0.7) 46 (1.9) 63 (1.3) 88 (1.1) 68 (0.2)
Chemistry (4 Topics) s
r
r
r r
r r
r s
97 (1.0) 66 (2.3) 90 (0.8) 73 (1.8) 98 (1.0) 91 (1.7) 91 (1.4) –– 76 (1.6) 61 (1.9) 98 (0.6) 82 (3.2) 98 (0.6) 94 (1.1) 82 (2.1) 86 (1.3) 91 (1.3) –– 42 (1.4) 92 (1.5) 65 (1.4) 100 (0.2) 80 (1.5) 59 (1.7) 62 (2.2) 55 (2.4) 78 (1.2) 95 (0.8) 86 (2.4) 98 (0.7) –– 91 (1.8) 80 (1.5) 56 (1.1) 74 (1.7) 85 (1.9) 92 (1.5) –– 99 (0.3) 73 (0.9) 77 (1.5) 79 (1.5) 81 (0.3)
Physics (5 Topics) s
r
r r
r s
96 (0.9) 63 (1.8) 81 (1.2) 76 (2.0) 59 (1.5) 89 (1.9) 60 (1.9) 40 (0.7) 71 (2.4) 76 (1.6) 86 (0.9) 79 (1.3) 98 (0.5) 80 (1.0) 71 (1.6) 76 (1.4) 87 (1.3) –– 79 (1.5) 84 (2.0) 65 (2.0) 99 (0.6) 72 (1.2) 55 (1.6) 58 (1.5) 28 (1.4) 77 (1.3) 83 (1.5) 78 (2.7) 99 (0.4) –– 85 (1.6) 83 (1.1) 57 (1.6) 73 (2.1) 66 (2.3) 67 (1.9) –– 97 (0.5) 79 (0.7) 74 (1.4) 77 (1.6) 75 (0.2)
Earth Science (4 Topics) r s
r
r s
r s
r r
r s
* Percentage mostly taught before or in the assessment year averaged across topics. ( ) Standard errors appear in parentheses. Because of rounding some results may appear inconsistent. A dash (–) indicates comparable data are not available. An “r” indicates data are available for at least 70% but less than 85% of the students. An “s” indicates data are available for at least 50% but less than 70% of the students. An “x” indicates data are available for less than 50% of students.
358
TIMSS 2011 INTERNATIONAL RESULTS IN SCIENCE CHAPTER 8
90 (1.8) 61 (3.0) 89 (1.2) 76 (3.0) 5 (1.5) 83 (2.0) 67 (2.6) 97 (0.8) 49 (2.7) 32 (3.0) 75 (1.8) 27 (3.8) 91 (1.0) 53 (2.8) 71 (2.3) 41 (1.3) 90 (1.3) –– 64 (1.4) –– 91 (1.1) 95 (1.0) 38 (2.0) 62 (1.7) 38 (2.8) 55 (3.2) 84 (1.6) 89 (1.4) 82 (1.6) 97 (0.8) –– 92 (1.5) 31 (2.4) 81 (1.9) xx 54 (4.0) 72 (2.9) 29 (2.2) 63 (2.1) 96 (1.1) 82 (1.2) 92 (1.1) 68 (0.3)
SOURCE: IEA’s Trends in International Mathematics and Science Study – TIMSS 2011
Reported by Teachers
Country
All Science (20 Topics)
Biology (7 Topics)
Chemistry (4 Topics)
Physics (5 Topics)
Earth Science (4 Topics)
54 (1.2) 70 (1.6) 76 (1.3)
68 (1.7) 80 (2.2) 78 (1.5)
35 (1.9) 70 (2.8) 82 (1.8)
72 (1.3) 55 (2.8) 72 (1.8)
28 (2.5) 71 (2.5) 72 (3.0)
Ninth Grade Participants Botswana Honduras South Africa Benchmarking Participants Alberta, Canada Ontario, Canada Quebec, Canada Abu Dhabi, UAE Dubai, UAE Alabama, US California, US Colorado, US Connecticut, US Florida, US Indiana, US Massachusetts, US Minnesota, US North Carolina, US
r r s s s s s s r s
63 (1.0) 71 (1.5) 67 (1.1) 72 (1.7) 72 (2.0) 86 (1.9) 86 (2.3) 88 (2.1) 85 (1.4) xx 80 (2.1) 82 (1.9) 79 (3.1) 89 (1.9)
r r r s s s s s s s r s
63 (1.6) 76 (1.6) 59 (1.8) 62 (2.6) 65 (2.6) 87 (3.9) 90 (3.7) 93 (2.1) 89 (1.6) xx 80 (3.1) 89 (2.1) 87 (3.8) 89 (2.6)
r r r r s s s s s s r s
38 (1.8) 52 (2.9) 76 (2.2) 76 (2.6) 76 (1.8) 88 (3.4) 93 (1.4) 83 (5.1) 82 (3.0) xx 69 (4.6) 71 (4.5) 67 (5.5) 88 (4.0)
r r s s s s s s s r s
72 (1.7) 74 (2.0) 51 (1.9) 77 (2.4) 73 (1.8) 78 (3.0) 75 (2.4) 79 (3.2) 77 (3.1) xx 82 (3.4) 72 (3.4) 63 (5.1) 84 (3.4)
r r s s s s s s s r s
TIMSS 2011 Science Topics A. Biology 1) Major organs and organ systems in humans and other organisms (structure/function, life processes that maintain stable bodily conditions) 2) Cells and their functions, including respiration and photosynthesis as cellular processes 3) Reproduction (sexual and asexual) and heredity (passing on of traits, inherited versus acquired/learned characteristics) 4) Role of variation and adaptation in survival/extinction of species in a changing environment 5) Interdependence of populations of organisms in an ecosystem (e.g., energy flow, food webs, competition, predation) and the impact of changes in the physical environment on populations (e.g., climate, water supply) 6) Reasons for increase in world’s human population (e.g., advances in medicine, sanitation), and the effects of population growth on the environment 7) Human health (causes of infectious diseases, methods of infection, prevention, immunity) and the importance of diet and exercise in maintaining health B. Chemistry 1) Classification, composition, and particulate structure of matter (elements, compounds, mixtures, molecules, atoms, protons, neutrons, electrons) 2) Solutions (solvent, solute, concentration/dilution, effect of temperature on solubility) 3) Properties and uses of common acids and bases 4) Chemical change (transformation of reactants, evidence of chemical change, conservation of matter, common oxidation reactions - combustion, rusting, tarnishing) C. Physics 1) Physical states and changes in matter (explanations of properties in terms of movement and distance between particles; phase change, thermal expansion, and changes in volume and/or pressure) 2) Energy forms, transformations, heat, and temperature 3) Basic properties/behaviors of light (reflection, refraction, light and color, simple ray diagrams) and sound (transmission through media, loudness, pitch, amplitude, frequency, relative speed of light and sound) 4) Electric circuits (flow of current; types of circuits - parallel/series; current/voltage relationship) and properties and uses of permanent magnets and electromagnets 5) Forces and motion (types of forces, basic description of motion, effects of density and pressure) D. Earth Science 1) Earth’s structure and physical features (Earth’s crust, mantle and core; composition and relative distribution of water, and composition of air) 2) Earth’s processes, cycles, and history (rock cycle; water cycle; weather patterns; major geological events; formation of fossils and fossil fuels) 3) Earth’s resources, their use, and conservation (e.g., renewable/nonrenewable resources, human use of land/soil, water resources) 4) Earth in the solar system and the universe (phenomena on Earth - day/night, tides, phases of moon, eclipses, seasons; physical features of Earth compared to other bodies; the Sun as a star)
CLASSROOM INSTRUCTION CHAPTER 8
359
74 (1.8) 79 (2.8) 89 (1.6) 80 (2.4) 79 (2.9) 93 (2.5) 85 (3.5) 97 (1.5) 91 (2.3) xx 91 (3.3) 94 (2.0) 96 (1.2) 96 (1.6)
SOURCE: IEA’s Trends in International Mathematics and Science Study – TIMSS 2011
Exhibit 8.9: Percentage of Students Taught the TIMSS Science Topics* Exhibit 8.9: Percentage of Students Taught the TIMSS Science Topics* (Continued) (Continued)
Exhibit 8.10: Number of TIMSS Science Topics Intended to Be Taught by the End of Fourth Grade All Science (20 Topics) Topics Topics Not Taught Taught to Included to All or Only the in the Almost More Able Curriculum All Students Through Students (Top Track) Grade 4
Country
Armenia Australia Austria Azerbaijan Bahrain Belgium (Flemish) Chile Chinese Taipei Croatia Czech Republic Denmark England Finland Georgia Germany Hong Kong SAR Hungary Iran, Islamic Rep. of Ireland Italy Japan Kazakhstan Korea, Rep. of Kuwait Lithuania Malta Morocco * Netherlands New Zealand Northern Ireland Norway Oman Poland Portugal Qatar Romania Russian Federation Saudi Arabia Serbia Singapore Slovak Republic Slovenia Spain Sweden Thailand Tunisia Turkey United Arab Emirates United States Yemen International Avg.
Life Science (6 Topics)
Physical Science (8 Topics)
14 15 16 4 20 16 6 11 18 12 14 16 11 14 16 17 12 20 18 12 13 16 8 20 16 12 19
0 1 0 8 0 4 0 0 0 0 0 0 0 2 0 0 0 0 0 0 0 0 2 0 2 0 0
6 4 4 8 0 0 14 9 2 8 6 4 9 4 4 3 8 0 2 8 7 4 10 0 2 8 1
5 5 6 2 6 6 2 4 6 6 6 6 3 5 5 6 6 6 6 5 2 6 2 6 6 3 6
0 0 0 3 0 0 0 0 0 0 0 0 0 0 0 0 0 0 0 0 0 0 0 0 0 0 0
1 1 0 1 0 0 4 2 0 0 0 0 3 1 1 0 0 0 0 1 4 0 4 0 0 3 0
4 5 7 0 8 6 2 5 6 3 3 7 4 3 7 7 5 8 8 3 6 4 3 8 5 6 8
0 1 0 2 0 2 0 0 0 0 0 0 0 2 0 0 0 0 0 0 0 0 2 0 2 0 0
4 2 1 6 0 0 6 3 2 5 5 1 4 3 1 1 3 0 0 5 2 4 3 0 1 2 0
5 5 3 2 6 4 2 2 6 3 5 3 4 6 4 4 1 6 4 4 5 6 3 6 5 3 5
0 0 0 3 0 2 0 0 0 0 0 0 0 0 0 0 0 0 0 0 0 0 0 0 0 0 0
1 1 3 1 0 0 4 4 0 3 1 3 2 0 2 2 5 0 2 2 1 0 3 0 1 3 1
12 20 12 20 8 15 12 19 12 19 18 6 17 15 7 19 14 5 19 20 15 18 14
8 0 0 0 0 0 6 0 0 0 0 0 0 0 0 0 0 0 0 0 0 0 1
0 0 8 0 12 5 2 1 8 1 2 14 3 5 13 1 6 15 1 0 5 2 5
3 6 4 6 3 5 5 6 4 6 6 3 6 4 2 6 3 2 5 6 3 6 5
3 0 0 0 0 0 1 0 0 0 0 0 0 0 0 0 0 0 0 0 0 0 0
0 0 2 0 3 1 0 0 2 0 0 3 0 2 4 0 3 4 1 0 3 0 1
5 8 4 8 2 5 4 8 2 8 8 3 6 7 3 8 5 3 8 8 8 7 5
3 0 0 0 0 0 4 0 0 0 0 0 0 0 0 0 0 0 0 0 0 0 0
0 0 4 0 6 3 0 0 6 0 0 5 2 1 5 0 3 5 0 0 0 1 2
4 6 4 6 3 5 3 5 6 5 4 0 5 4 2 5 6 0 6 6 4 5 4
2 0 0 0 0 0 1 0 0 0 0 0 0 0 0 0 0 0 0 0 0 0 0
0 0 2 0 3 1 2 1 0 1 2 6 1 2 4 1 0 6 0 0 2 1 2
* No grade-specific science curriculum prescribed. Because of rounding some results may appear inconsistent.
360
Earth Science (6 Topics)
Topics Topics Not Topics Topics Not Topics Topics Not Taught Taught to Included Taught Taught to Included Taught Taught to Included to All or Only the in the to All or Only the in the to All or Only the in the Almost More Able Curriculum Almost More Able Curriculum Almost More Able Curriculum All Students Through All Students Through All Students Through Students (Top Track) Grade 4 Students (Top Track) Grade 4 Students (Top Track) Grade 4
TIMSS 2011 INTERNATIONAL RESULTS IN SCIENCE CHAPTER 8
SOURCE: IEA’s Trends in International Mathematics and Science Study – TIMSS 2011
Reported by National Research Coordinators
All Science (20 Topics) Country
Life Science (6 Topics)
Topics Topics Not Taught Taught to Included to All or Only the in the Almost More Able Curriculum All Students Through Students (Top Track) Grade 4
Physical Science (8 Topics)
Earth Science (6 Topics)
Topics Topics Not Topics Topics Not Topics Topics Not Taught Taught to Included Taught Taught to Included Taught Taught to Included to All or Only the in the to All or Only the in the to All or Only the in the Almost More Able Curriculum Almost More Able Curriculum Almost More Able Curriculum All Students Through All Students Through All Students Through Students (Top Track) Grade 4 Students (Top Track) Grade 4 Students (Top Track) Grade 4
Sixth Grade Participants Botswana Honduras
6 16
0 0
14 4
2 6
0 0
4 0
3 6
0 0
5 2
1 4
0 0
5 2
13 13 9 19 20 12 12
0 0 2 0 0 0 0
7 7 9 1 0 8 8
5 5 2 6 6 3 3
0 0 1 0 0 0 0
1 1 3 0 0 3 3
6 6 4 8 8 5 6
0 0 1 0 0 0 0
2 2 3 0 0 3 2
2 2 3 5 6 4 3
0 0 0 0 0 0 0
4 4 3 1 0 2 3
Benchmarking Participants Alberta, Canada Ontario, Canada Quebec, Canada Abu Dhabi, UAE Dubai, UAE Florida, US North Carolina, US
CLASSROOM INSTRUCTION CHAPTER 8
361
SOURCE: IEA’s Trends in International Mathematics and Science Study – TIMSS 2011
Exhibit 8.10: Number of TIMSS Science Topics Intended to Be Taught by the End of Fourth Grade (Continued)
Exhibit Exhibit 8.11: 8.11: Number Number of ofTIMSS TIMSS Science ScienceTopics Topics Intended Intended to to Be Be Taught Taught by by the the End End of of Eighth Eighth Grade Grade All Science (20 Topics) Topics Taught Topics Taught to Only the to All or Almost More Able All Students Students (Top Track)
Country
Armenia Australia Bahrain Chile Chinese Taipei England Finland Georgia Ghana Hong Kong SAR Hungary Indonesia Iran, Islamic Rep. of Israel Italy Japan Jordan Kazakhstan Korea, Rep. of Lebanon Lithuania Macedonia, Rep. of Malaysia Morocco New Zealand Norway Oman Palestinian Nat’I Auth. Qatar Romania Russian Federation Saudi Arabia Singapore Slovenia Sweden Syrian Arab Republic Thailand Tunisia Turkey Ukraine United Arab Emirates United States International Avg.
20 18 20 17 19 19 15 9 20 18 19 19 20 16 17 17 20 20 13 9 16 20 15 6 16 12 20 20 8 20 20 19 14 15 20 20 20 9 20 12 20 16 17
0 1 0 0 0 0 0 4 0 0 0 0 0 2 2 0 0 0 5 2 0 0 0 0 4 0 0 0 0 0 0 0 0 0 0 0 0 0 0 5 0 0 1
Biology (7 Topics)
Not Included in the Curriculum Through Grade 8
0 1 0 3 1 1 5 7 0 2 1 1 0 2 1 3 0 0 2 9 4 0 5 14 0 8 0 0 12 0 0 1 6 5 0 0 0 11 0 3 0 4 3
Topics Taught Topics Taught to Only the to All or Almost More Able All Students Students (Top Track)
7 6 7 7 6 6 3 4 7 7 7 7 7 5 5 5 7 7 2 0 7 7 4 1 6 3 7 7 3 7 7 6 4 5 7 7 7 5 7 0 7 6 6
0 0 0 0 0 0 0 3 0 0 0 0 0 1 2 0 0 0 3 0 0 0 0 0 1 0 0 0 0 0 0 0 0 0 0 0 0 0 0 5 0 0 0
Because of rounding some results may appear inconsistent.
362
TIMSS 2011 INTERNATIONAL RESULTS IN SCIENCE CHAPTER 8
Chemistry (4 Topics) Not Included Topics Taught in the Topics Taught to Only the Curriculum to All or Almost More Able Through All Students Students Grade 8 (Top Track)
0 1 0 0 1 1 4 0 0 0 0 0 0 1 0 2 0 0 2 7 0 0 3 6 0 4 0 0 4 0 0 1 3 2 0 0 0 2 0 2 0 1 1
4 3 4 2 4 4 4 0 4 2 4 3 4 3 4 4 4 4 3 2 3 4 3 2 3 2 4 4 0 4 4 4 4 2 4 4 4 2 4 3 4 2 3
0 1 0 0 0 0 0 0 0 0 0 0 0 1 0 0 0 0 1 0 0 0 0 0 1 0 0 0 0 0 0 0 0 0 0 0 0 0 0 0 0 0 0
Not Included in the Curriculum Through Grade 8
0 0 0 2 0 0 0 4 0 2 0 1 0 0 0 0 0 0 0 2 1 0 1 2 0 2 0 0 4 0 0 0 0 2 0 0 0 2 0 1 0 2 1
SOURCE: IEA’s Trends in International Mathematics and Science Study – TIMSS 2011
Reported by National Research Coordinators
Physics (5 Topics) Country
Armenia Australia Bahrain Chile Chinese Taipei England Finland Georgia Ghana Hong Kong SAR Hungary Indonesia Iran, Islamic Rep. of Israel Italy Japan Jordan Kazakhstan Korea, Rep. of Lebanon Lithuania Macedonia, Rep. of Malaysia Morocco New Zealand Norway Oman Palestinian Nat’I Auth. Qatar Romania Russian Federation Saudi Arabia Singapore Slovenia Sweden Syrian Arab Republic Thailand Tunisia Turkey Ukraine United Arab Emirates United States International Avg.
Topics Taught to All or Almost All Students
Topics Taught to Only the More Able Students (Top Track)
5 5 5 4 5 5 4 2 5 5 5 5 5 4 4 4 5 5 5 5 2 5 5 0 3 4 5 5 4 5 5 5 4 4 5 5 5 2 5 5 5 4 4
0 0 0 0 0 0 0 0 0 0 0 0 0 0 0 0 0 0 0 0 0 0 0 0 2 0 0 0 0 0 0 0 0 0 0 0 0 0 0 0 0 0 0
Earth Science (4 Topics) Not Included Topics Taught in the Topics Taught to Only the Curriculum to All or Almost More Able Through All Students Students Grade 8 (Top Track)
0 0 0 1 0 0 1 3 0 0 0 0 0 1 1 1 0 0 0 0 3 0 0 5 0 1 0 0 1 0 0 0 1 1 0 0 0 3 0 0 0 1 1
4 4 4 4 4 4 4 3 4 4 3 4 4 4 4 4 4 4 3 2 4 4 3 3 4 3 4 4 1 4 4 4 2 4 4 4 4 0 4 4 4 4 4
0 0 0 0 0 0 0 1 0 0 0 0 0 0 0 0 0 0 1 2 0 0 0 0 0 0 0 0 0 0 0 0 0 0 0 0 0 0 0 0 0 0 0
Not Included in the Curriculum Through Grade 8
0 0 0 0 0 0 0 0 0 0 1 0 0 0 0 0 0 0 0 0 0 0 1 1 0 1 0 0 3 0 0 0 2 0 0 0 0 4 0 0 0 0 0
SOURCE: IEA’s Trends in International Mathematics and Science Study – TIMSS 2011
Exhibit 8.11: Number of TIMSS Science Topics Intended to Be Taught by the End of Eighth Grade (Continued)
CLASSROOM INSTRUCTION CHAPTER 8
363
All Science (20 Topics) Country
Biology (7 Topics)
Chemistry (4 Topics)
Topics Taught to All or Almost All Students
Topics Taught to Only the More Able Students (Top Track)
Not Included in the Curriculum Through Grade 8
Topics Taught to All or Almost All Students
Topics Taught to Only the More Able Students (Top Track)
Not Included Topics Taught in the Topics Taught to Only the Curriculum to All or Almost More Able Through All Students Students Grade 8 (Top Track)
Not Included in the Curriculum Through Grade 8
10 20 20
0 0 0
10 0 0
6 7 7
0 0 0
1 0 0
1 4 4
0 0 0
3 0 0
15 18 10 19 20 18 16 18 20 18 16 16 13 15
0 0 1 0 0 0 0 0 0 0 0 0 0 0
5 2 9 1 0 2 4 2 0 2 4 4 7 5
5 7 3 7 7 5 5 6 7 5 5 5 4 7
0 0 1 0 0 0 0 0 0 0 0 0 0 0
2 0 3 0 0 2 2 1 0 2 2 2 3 0
1 3 3 3 4 4 2 3 4 4 2 2 2 1
0 0 0 0 0 0 0 0 0 0 0 0 0 0
3 1 1 1 0 0 2 1 0 0 2 2 2 3
Ninth Grade Participants Botswana Honduras South Africa Benchmarking Participants Alberta, Canada Ontario, Canada Quebec, Canada Abu Dhabi, UAE Dubai, UAE Alabama, US California, US Colorado, US Connecticut, US Florida, US Indiana, US Massachusetts, US Minnesota, US North Carolina, US
Physics (5 topics) Country
Earth Science (4 topics)
Topics Taught to All or Almost All Students
Topics Taught to Only the More Able Students (Top Track)
Not Included in the Curriculum Through Grade 8
Topics Taught to All or Almost All Students
Topics Taught to Only the More Able Students (Top Track)
Not Included in the Curriculum Through Grade 8
2 5 5
0 0 0
3 0 0
1 4 4
0 0 0
3 0 0
5 5 0 5 5 5 5 5 5 5 5 5 5 4
0 0 0 0 0 0 0 0 0 0 0 0 0 0
0 0 5 0 0 0 0 0 0 0 0 0 0 1
4 3 4 4 4 4 4 4 4 4 4 4 2 3
0 0 0 0 0 0 0 0 0 0 0 0 0 0
0 1 0 0 0 0 0 0 0 0 0 0 2 1
Ninth Grade Participants Botswana Honduras South Africa Benchmarking Participants Alberta, Canada Ontario, Canada Quebec, Canada Abu Dhabi, UAE Dubai, UAE Alabama, US California, US Colorado, US Connecticut, US Florida, US Indiana, US Massachusetts, US Minnesota, US North Carolina, US
364
TIMSS 2011 INTERNATIONAL RESULTS IN SCIENCE CHAPTER 8
SOURCE: IEA’s Trends in International Mathematics and Science Study – TIMSS 2011
Exhibit Exhibit 8.11: 8.11: Number Number of ofTIMSS TIMSS Science ScienceTopics Topics Intended Intended to to Be Be Taught Taught by by the the End End of of Eighth Eighth Grade Grade (Continued) (Continued)
chemistry topics, four of the five physics topics, and all four of the earth science topics were included in the curriculum for all students. However, there were a number of countries where none of the topics in a content area were included in the eighth grade science curriculum for all students, including Lebanon and the Ukraine (no biology), Georgia and Qatar (no chemistry), Morocco and Québec, Canada (no physics), and Tunisia (no earth science). Collaborate to Improve Teaching Part of creating a school learning environment focused on academic success involves a staff that collaborates on curricular activities. For example, a study including a comprehensive theoretical review and a meta-analysis of studies about professional communities indicated a small but positive effect of professional communities on student achievement (Lomos, Roelande, & Bosker, 2011). Because teacher collaboration with colleagues is important in building a professional community, TIMSS 2011 included the Collaborate to Improve Teaching scale. Although the idea of teacher collegiality and collaboration can involve a variety of theoretical perspectives and terms, the TIMSS 2011 scale was designed to focus on the idea of collaboration for the purpose of improving teaching. Therefore, the scale was based on how often teachers interacted with other teachers regarding each of five areas:
Discuss how to teach a particular topic;
Collaborate in planning and preparing instructional materials;
Share what I have learned about my teaching experiences;
Visit another classroom to learn more about teaching; and
Work together to try out new ideas.
Students were scored according to their teachers responses, with Very Collaborative teachers having interactions with other teachers at least “one to three times per week” in each of three of the five areas and “two or three times per month” in each of the other two, on average. Exhibit 8.12 presents the results for the fourth grade. In general, most science teachers of fourth grade students reported a high degree of collaboration with other teachers with the goal of improving teaching and learning. Internationally, on average, about one-third of the fourth grade students (35%) had Very Collaborative teachers. Another 53 percent of students, on average, had teachers that reported being Collaborative (e.g., interacting two or three times a month for all areas). Few fourth grade students (12%, on average) had
CLASSROOM INSTRUCTION CHAPTER 8
365
Reported by Teachers Students were scored according to their teachers’ responses to how often they interacted with other teachers in each of five teaching areas on the Collaborate to Improve Teaching scale. Students with Very Collaborative teachers had a score on the scale of at least 11.0, which corresponds to their teachers having interactions with other teachers at least “one to three times per week” in each of three of the five areas and “two or three times per month” in each of the other two, on average. Students with Somewhat Collaborative teachers had a score no higher than 7.3, which corresponds to their teachers interacting with other teachers “never or almost never” in each of three of the five areas and “two or three times per month” in each of the other two, on average. All other students had Collaborative teachers.
Very Collaborative Country Slovenia Kuwait Romania Kazakhstan Armenia Serbia Oman Slovak Republic Korea, Rep. of United States Azerbaijan Portugal Turkey Australia Hungary United Arab Emirates England New Zealand Croatia Lithuania Chile Thailand Spain Qatar Sweden Norway Georgia Poland Japan Russian Federation Iran, Islamic Rep. of Singapore Bahrain Italy Chinese Taipei Germany Finland Northern Ireland Belgium (Flemish) Austria Saudi Arabia Netherlands Hong Kong SAR Morocco Ireland Czech Republic Yemen Denmark Malta Tunisia International Avg.
r
r
r
r
r
Collaborative
Average Achievement
Percent of Students
Average Achievement
Percent of Students
Average Achievement
73 (3.5) 69 (3.6) 68 (3.8) 59 (3.9) 57 (3.8) 52 (4.0) 52 (3.3) 50 (3.4) 49 (3.7) 49 (2.8) 47 (4.1) 45 (4.8) 44 (3.3) 43 (3.4) 43 (4.2) 43 (2.7) 42 (3.7) 41 (3.1) 41 (3.8) 40 (3.4) 39 (4.2) 38 (3.5) 38 (3.8) 35 (4.1) 35 (4.6) 34 (4.0) 33 (3.1) 32 (3.0) 32 (3.8) 31 (3.9) 31 (3.0) 31 (2.5) 29 (4.9) 27 (3.1) 27 (3.6) 25 (2.9) 25 (2.7) 22 (4.1) 20 (2.5) 19 (3.1) 18 (3.2) 18 (3.9) 16 (3.6) 16 (2.4) 16 (2.6) 15 (2.5) 14 (3.0) 14 (2.7) 14 (0.1) 13 (2.3) 35 (0.5)
521 (3.0) 350 (5.5) 503 (7.2) 490 (5.6) 420 (4.6) 522 (3.8) 384 (4.2) 532 (4.9) 592 (2.7) 547 (2.9) 439 (8.4) 521 (7.0) 461 (7.8) 520 (5.4) 532 (6.6) 437 (4.4) 523 (5.8) 496 (5.0) 519 (3.0) 516 (3.9) 487 (5.2) 473 (8.2) 514 (3.6) 391 (11.6) 535 (4.5) 497 (3.0) 449 (7.4) 500 (3.6) 563 (2.8) 550 (6.7) 449 (7.6) 581 (5.9) 464 (7.1) 527 (6.1) 556 (4.5) 522 (4.8) 571 (4.6) 515 (5.7) 508 (3.4) 521 (7.5) 429 (11.4) 532 (6.1) 536 (7.0) 261 (11.5) 522 (9.7) 529 (4.9) 196 (16.5) 537 (5.2) 461 (3.5) 350 (17.1) 487 (1.0)
25 (3.4) 27 (3.5) 31 (3.9) 41 (4.0) 42 (3.9) 46 (4.0) 47 (3.4) 48 (3.5) 48 (3.6) 40 (2.7) 49 (4.3) 50 (4.9) 46 (2.9) 44 (3.9) 54 (4.1) 51 (2.6) 47 (3.9) 54 (2.9) 57 (3.8) 55 (3.5) 40 (4.4) 57 (3.8) 51 (3.8) 62 (4.1) 51 (4.6) 55 (4.1) 62 (3.4) 66 (3.1) 55 (4.2) 67 (4.0) 60 (2.9) 61 (2.8) 58 (5.1) 58 (3.5) 56 (4.0) 59 (3.6) 62 (2.6) 54 (4.9) 62 (3.5) 55 (3.8) 59 (4.2) 57 (4.6) 74 (3.7) 43 (3.7) 59 (3.6) 70 (3.6) 60 (4.2) 67 (3.5) 45 (0.1) 57 (3.9) 53 (0.5)
518 (4.5) 343 (9.3) 507 (8.2) 503 (9.5) 412 (5.6) 508 (4.5) 371 (6.6) 534 (4.4) 582 (2.6) 546 (3.8) 440 (7.4) 522 (4.2) 462 (6.5) 520 (5.4) 536 (5.4) 426 (3.9) 534 (4.4) 500 (3.5) 515 (2.6) 514 (4.1) 478 (5.2) 473 (7.6) 502 (4.2) 395 (6.4) 533 (4.0) 493 (3.4) 460 (4.0) 508 (3.2) 559 (2.4) 553 (3.6) 452 (4.9) 584 (4.3) 448 (4.8) 524 (3.6) 552 (3.1) 529 (3.5) 571 (2.9) 519 (4.1) 508 (2.5) 532 (3.2) 439 (6.5) 531 (3.4) 534 (4.9) 270 (8.1) 512 (3.8) 540 (3.0) 221 (8.4) 530 (3.4) 447 (2.5) 347 (7.4) 487 (0.7)
2 (0.8) 3 (1.4) 1 (0.6) 0 (0.3) 1 (0.9) 2 (0.9) 1 (0.6) 2 (0.9) 3 (1.5) 11 (1.7) 4 (1.9) 5 (1.4) 9 (1.8) 13 (2.8) 3 (1.1) 6 (1.3) 11 (2.0) 5 (1.3) 2 (0.9) 5 (1.5) 22 (3.5) 5 (1.7) 11 (2.3) 3 (1.3) 14 (3.5) 11 (3.1) 5 (1.5) 2 (0.9) 13 (2.8) 1 (0.8) 9 (2.0) 9 (1.4) 13 (2.8) 15 (2.5) 18 (3.0) 16 (2.6) 13 (1.8) 24 (3.7) 18 (2.8) 26 (3.0) 24 (3.2) 26 (4.5) 10 (2.5) 41 (3.4) 25 (3.1) 15 (3.0) 25 (3.7) 19 (3.0) 41 (0.1) 31 (3.6) 12 (0.3)
~~ 311 (15.3) ~~ ~~ ~~ ~~ ~~ ~~ 570 (10.3) 535 (6.8) 410 (42.0) 525 (8.0) 468 (8.6) 515 (8.5) 528 (12.6) 416 (11.2) 537 (13.8) 476 (12.8) ~~ 511 (10.1) 471 (9.5) 462 (15.7) 493 (6.1) 409 (38.3) 542 (4.9) 491 (7.9) 431 (26.7) ~~ 543 (5.2) ~~ 473 (12.3) 580 (14.4) 436 (13.2) 522 (6.8) 547 (5.1) 537 (5.6) 565 (6.2) 514 (7.0) 513 (5.2) 540 (4.2) 414 (10.2) 527 (4.3) 538 (8.6) 260 (8.3) 525 (5.6) 529 (5.2) 187 (13.8) 526 (5.9) 441 (2.4) 340 (9.8) 479 (2.1)
Centerpoint of scale set at 10. ( ) Standard errors appear in parentheses. Because of rounding some results may appear inconsistent. A tilde (~) indicates insufficient data to report achievement. An “r” indicates data are available for at least 70% but less than 85% of the students.
366
Somewhat Collaborative
Percent of Students
TIMSS 2011 INTERNATIONAL RESULTS IN SCIENCE CHAPTER 8
Average Scale Score 11.8 (0.14) 11.3 (0.15) 11.4 (0.12) 11.1 (0.08) 11.1 (0.11) 10.8 (0.13) 10.8 (0.07) 10.7 (0.09) 10.6 (0.15) 10.4 (0.14) 10.6 (0.13) 10.6 (0.18) 10.2 (0.12) 10.3 (0.15) 10.5 (0.12) 10.4 (0.09) 10.3 (0.14) 10.4 (0.11) 10.5 (0.11) 10.4 (0.11) 9.7 (0.19) 10.5 (0.15) 9.9 (0.17) 10.3 (0.18) 9.8 (0.23) 9.9 (0.17) 10.3 (0.11) 10.3 (0.08) 9.8 (0.13) 10.3 (0.08) 10.0 (0.14) 9.9 (0.10) 9.7 (0.16) 9.4 (0.13) 9.4 (0.17) 9.5 (0.12) 9.6 (0.13) 9.3 (0.22) 9.3 (0.14) 9.0 (0.15) 9.1 (0.14) 9.0 (0.19) 9.4 (0.14) 8.1 (0.19) 8.8 (0.14) 9.2 (0.14) 8.8 (0.16) 9.3 (0.13) 8.1 (0.01) 8.5 (0.17) 479 (2.1)
SOURCE: IEA’s Trends in International Mathematics and Science Study – TIMSS 2011
Exhibit 8.12: Collaborate to Improve Teaching
Very Collaborative Country
Collaborative
Somewhat Collaborative
Average Scale Score
Percent of Students
Average Achievement
Percent of Students
Average Achievement
Percent of Students
Average Achievement
56 (4.3) 35 (4.8) 17 (3.0)
362 (6.4) 425 (14.9) 326 (16.0)
37 (4.2) 51 (4.6) 61 (3.5)
380 (11.5) 434 (5.7) 359 (8.5)
7 (2.3) 14 (2.4) 22 (3.5)
384 (51.4) 443 (10.4) 324 (15.1)
10.9 (0.19) 9.9 (0.23) 8.9 (0.16)
62 (7.2) 62 (4.0) 52 (4.9) 40 (4.4) 33 (4.1) 27 (3.5) 20 (3.9)
535 (6.6) 470 (6.0) 546 (5.6) 413 (8.3) 542 (4.5) 528 (4.3) 514 (6.1)
34 (6.6) 37 (4.0) 44 (4.8) 54 (4.5) 53 (4.9) 57 (4.0) 58 (4.8)
542 (6.9) 463 (9.0) 543 (6.6) 415 (7.9) 540 (4.3) 526 (4.0) 516 (3.4)
4 (2.1) 2 (0.3) 5 (2.3) 6 (1.8) 14 (3.2) 17 (2.9) 22 (3.6)
536 (10.5) ~~ 539 (29.0) 404 (6.2) 546 (5.6) 533 (5.5) 519 (5.3)
11.1 (0.26) 11.0 (0.09) 10.9 (0.21) 10.4 (0.14) 9.8 (0.19) 9.8 (0.18) 9.1 (0.18)
Sixth Grade Participants Botswana Honduras Yemen Benchmarking Participants North Carolina, US Dubai, UAE Florida, US Abu Dhabi, UAE Alberta, Canada Ontario, Canada Quebec, Canada
r r
How often do you have the following types of interactions with other teachers? Daily or almost daily
1–3 times per week
2 or 3 times per month
1) Discuss how to teach a particular topic -------------------
A
A
A
A
2) Collaborate in planning and preparing instructional materials ----------------------------------------------------------
A
A
A
A
3) Share what I have learned about my teaching experiences ------------------------------------------
A
A
A
A
A A
A A
A A
A A
4) Visit another classroom to learn more about teaching--------------------------------------------------5) Work together to try out new ideas -----------------------
Very Collaborative
Collaborative Somewhat Collaborative 11.0
Never or almost never
T5r42195
7.3
CLASSROOM INSTRUCTION CHAPTER 8
367
SOURCE: IEA’s Trends in International Mathematics and Science Study – TIMSS 2011
Exhibit 8.12: Collaborate to Improve Teaching (Continued)
Reported by Teachers Students were scored according to their teachers’ responses to how often they interacted with other teachers in each of five teaching areas on the Collaborate to Improve Teaching scale. Students with Very Collaborative teachers had a score on the scale of at least 11.4, which corresponds to their teachers having interactions with other teachers at least “one to three times per week” in each of three of the five areas and “two or three times per month” in each of the other two, on average. Students with Somewhat Collaborative teachers had a score no higher than 7.5, which corresponds to their teachers interacting with other teachers “never or almost never” in each of three of the five areas and “two or three times per month” in each of the other two, on average. All other students had Collaborative teachers.
Very Collaborative Country Qatar Israel Bahrain Kazakhstan Oman Indonesia Armenia Romania Thailand United Arab Emirates United States Australia Ghana Macedonia, Rep. of Lebanon Palestinian Nat'l Auth. Malaysia Georgia Turkey New Zealand England Sweden Ukraine Jordan Slovenia Singapore Norway Chile Saudi Arabia Hungary Tunisia Syrian Arab Republic Korea, Rep. of Lithuania Japan Finland Russian Federation Chinese Taipei Italy Hong Kong SAR Iran, Islamic Rep. of Morocco International Avg.
r s
r r
Collaborative
Somewhat Collaborative
Percent of Students
Average Achievement
Percent of Students
Average Achievement
Percent of Students
Average Achievement
53 (4.2) 51 (3.3) 47 (2.6) 46 (2.8) 46 (3.2) 45 (4.1) 44 (2.9) 41 (2.6) 39 (3.8) 38 (2.2) 38 (2.4) 37 (3.6) 37 (4.0) 34 (2.4) 34 (3.3) 33 (4.1) 32 (3.8) 31 (2.1) 31 (3.1) 30 (2.8) 27 (3.4) 26 (3.5) 26 (2.6) 25 (3.3) 23 (1.9) 22 (2.3) 22 (3.3) 21 (3.2) 21 (3.4) 20 (2.3) 19 (3.1) 18 (2.3) 18 (2.7) 18 (1.7) 17 (3.3) 15 (1.8) 15 (1.6) 15 (3.1) 13 (2.8) 13 (3.3) 13 (2.5) 13 (1.3) 29 (0.5)
401 (8.3) 514 (5.6) 456 (3.4) 479 (5.3) 429 (5.3) 399 (8.3) 437 (4.2) 465 (3.8) 460 (8.6) 463 (4.0) 528 (4.3) 520 (7.1) 298 (7.8) 405 (7.0) 417 (7.9) 415 (6.3) 424 (9.8) 416 (4.0) 485 (8.5) 518 (8.4) 521 (12.6) 508 (5.7) 498 (5.2) 460 (7.8) 541 (3.3) 585 (10.8) 501 (6.7) 470 (6.6) 443 (7.3) 506 (6.9) 436 (4.4) 416 (6.2) 566 (5.0) 517 (5.1) 557 (6.8) 557 (3.9) 543 (6.8) 568 (8.9) 504 (9.8) 520 (10.8) 482 (9.5) 384 (5.8) 476 (1.1)
40 (4.4) 46 (3.3) 44 (2.1) 53 (2.8) 48 (3.1) 50 (4.3) 54 (2.8) 55 (2.5) 51 (3.5) 56 (2.1) 47 (2.2) 52 (3.4) 52 (3.8) 61 (2.5) 60 (3.5) 61 (4.0) 64 (3.8) 67 (2.0) 53 (3.6) 58 (3.9) 57 (3.0) 50 (3.3) 70 (2.5) 66 (3.8) 63 (2.1) 66 (2.7) 60 (4.3) 44 (4.2) 64 (4.1) 65 (2.4) 63 (3.8) 60 (3.6) 66 (3.7) 67 (2.0) 61 (4.0) 59 (2.2) 81 (1.6) 58 (4.3) 56 (3.7) 73 (4.4) 69 (3.2) 47 (2.5) 58 (0.5)
439 (11.2) 520 (6.5) 451 (2.8) 500 (4.9) 412 (5.4) 410 (5.4) 440 (4.2) 466 (4.5) 447 (4.5) 458 (3.4) 529 (4.8) 530 (6.8) 316 (9.1) 413 (6.7) 402 (6.4) 424 (4.9) 430 (8.2) 422 (3.5) 482 (4.6) 512 (6.4) 536 (5.7) 515 (3.7) 502 (3.9) 448 (5.4) 544 (2.9) 595 (5.6) 493 (3.4) 459 (4.6) 436 (4.9) 526 (3.2) 440 (3.2) 427 (5.1) 559 (2.3) 513 (2.6) 558 (3.1) 552 (2.6) 542 (3.3) 563 (3.8) 504 (4.0) 537 (4.9) 477 (4.5) 377 (2.9) 479 (0.8)
6 (1.2) 3 (1.1) 9 (1.7) 1 (0.2) 6 (1.7) 5 (1.8) 2 (0.5) 4 (0.9) 10 (2.4) 6 (0.8) 16 (1.9) 11 (2.2) 12 (2.5) 5 (0.9) 6 (1.3) 6 (1.9) 4 (1.5) 3 (0.7) 16 (2.7) 12 (2.7) 16 (2.6) 24 (3.0) 4 (1.3) 10 (2.5) 15 (1.6) 11 (1.8) 18 (3.7) 35 (3.5) 16 (3.1) 15 (1.8) 18 (2.7) 22 (3.4) 16 (2.9) 15 (1.5) 22 (3.2) 26 (2.2) 4 (0.8) 28 (4.0) 30 (3.5) 14 (2.8) 18 (2.7) 40 (2.4) 13 (0.4)
433 (14.7) 510 (40.2) 450 (14.0) ~~ 417 (14.1) 412 (12.7) ~~ 456 (8.8) 434 (14.2) 485 (12.1) 516 (9.1) 518 (13.8) 283 (16.2) 412 (14.2) 381 (15.4) 412 (17.2) 378 (30.8) 419 (8.5) 485 (9.0) 486 (10.9) 535 (8.2) 504 (4.9) 496 (10.6) 428 (18.8) 543 (4.3) 573 (11.8) 490 (4.9) 457 (5.7) 428 (12.3) 531 (5.4) 437 (5.4) 431 (9.2) 559 (4.3) 516 (6.0) 558 (5.6) 551 (3.7) 545 (7.0) 563 (4.7) 498 (4.5) 536 (10.7) 459 (10.5) 374 (3.1) 472 (2.1)
Centerpoint of scale set at 10. ( ) Standard errors appear in parentheses. Because of rounding some results may appear inconsistent. A tilde (~) indicates insufficient data to report achievement. An “r” indicates data are available for at least 70% but less than 85% of the students. An “s” indicates data are available for at least 50% but less than 70% of the students. An “x” indicates data are available for less than 50% of students.
368
TIMSS 2011 INTERNATIONAL RESULTS IN SCIENCE CHAPTER 8
Average Scale Score 11.2 (0.11) 11.0 (0.12) 10.7 (0.13) 11.1 (0.07) 10.9 (0.11) 10.7 (0.12) 11.1 (0.08) 10.8 (0.09) 10.5 (0.17) 10.6 (0.08) 10.2 (0.12) 10.4 (0.16) 10.5 (0.18) 10.5 (0.09) 10.4 (0.12) 10.4 (0.14) 10.5 (0.11) 10.5 (0.08) 9.9 (0.14) 10.0 (0.11) 9.9 (0.16) 9.6 (0.15) 10.4 (0.09) 10.0 (0.13) 9.9 (0.08) 9.9 (0.09) 9.7 (0.16) 9.0 (0.18) 9.7 (0.16) 9.8 (0.09) 9.4 (0.14) 9.4 (0.15) 9.6 (0.13) 9.5 (0.08) 9.2 (0.16) 9.2 (0.11) 10.1 (0.06) 9.0 (0.17) 8.8 (0.18) 9.4 (0.14) 9.3 (0.12) 8.4 (0.11)
SOURCE: IEA’s Trends in International Mathematics and Science Study – TIMSS 2011
Exhibit 8.13: Collaborate to Improve Teaching
Very Collaborative Country
Collaborative
Somewhat Collaborative
Average Scale Score
Percent of Students
Average Achievement
Percent of Students
Average Achievement
Percent of Students
Average Achievement
44 (4.2) 37 (3.8) 21 (3.9)
406 (5.3) 324 (7.5) 364 (7.4)
48 (4.2) 51 (3.9) 52 (4.6)
405 (5.8) 332 (7.4) 376 (7.0)
8 (2.4) 13 (2.4) 27 (3.7)
390 (13.9) 334 (14.3) 360 (6.6)
10.8 (0.17) 10.4 (0.15) 9.2 (0.19)
63 (7.0) 46 (3.0) 40 (4.4) 40 (6.2) 35 (3.7) 34 (5.3) 34 (6.4) 31 (6.2) 26 (7.3) 26 (2.8) 26 (5.7) 23 (5.6) 14 (2.7) xx
530 (12.8) 481 (5.2) 461 (7.1) 534 (9.1) 522 (3.5) 487 (8.1) 556 (6.6) 525 (7.1) 569 (18.7) 543 (4.4) 490 (9.6) 539 (19.4) 524 (7.8) xx
19 (5.7) 49 (3.0) 54 (4.2) 44 (5.9) 47 (4.1) 56 (5.3) 42 (5.5) 42 (7.2) 56 (7.6) 46 (3.5) 62 (7.0) 48 (7.8) 62 (3.7) xx
540 (13.1) 477 (4.3) 455 (5.7) 542 (9.7) 522 (4.2) 513 (7.8) 529 (13.1) 539 (9.3) 562 (9.5) 549 (3.7) 481 (8.8) 564 (7.4) 518 (3.8) xx
17 (6.3) 5 (0.7) 6 (1.7) 16 (5.1) 17 (3.2) 10 (3.4) 25 (5.7) 27 (5.7) 18 (5.3) 28 (3.3) 13 (4.6) 28 (7.5) 24 (3.5) xx
498 (20.4) 495 (26.3) 501 (21.3) 556 (15.1) 520 (5.8) 468 (13.4) 508 (16.3) 539 (7.4) 558 (21.9) 544 (3.9) 482 (16.9) 546 (8.1) 525 (6.1) xx
10.7 (0.33) 10.9 (0.09) 10.5 (0.15) 10.2 (0.30) 10.2 (0.20) 10.2 (0.23) 9.6 (0.37) 9.5 (0.26) 9.7 (0.34) 9.5 (0.16) 9.7 (0.26) 9.2 (0.36) 9.1 (0.17) xx
Ninth Grade Participants Botswana South Africa Honduras Benchmarking Participants North Carolina, US Dubai, UAE Abu Dhabi, UAE Colorado, US Ontario, Canada California, US Connecticut, US Indiana, US Massachusetts, US Alberta, Canada Alabama, US Minnesota, US Quebec, Canada Florida, US
s r
s r r r r r
How often do you have the following types of interactions with other teachers? Daily or almost daily
1–3 times per week
2 or 3 times per month
1) Discuss how to teach a particular topic -------------------
A
A
A
A
2) Collaborate in planning and preparing instructional materials ----------------------------------------------------------
A
A
A
A
3) Share what I have learned about my teaching experiences ------------------------------------------
A
A
A
A
A A
A A
A A
A A
4) Visit another classroom to learn more about teaching--------------------------------------------------5) Work together to try out new ideas -----------------------
Very Collaborative
Collaborative Somewhat Collaborative 11.4
Never or almost never
7.5
CLASSROOM INSTRUCTION CHAPTER 8
369
SOURCE: IEA’s Trends in International Mathematics and Science Study – TIMSS 2011
Exhibit 8.13: Collaborate to Improve Teaching (Continued)
science teachers that were only Somewhat Collaborative (e.g., never or almost never interacting in three of the five areas). Looking across the countries at the fourth and sixth grades as well as the benchmarking participants, it is clear that there are differences from country to country. However, primarily these differences were between the percentages of students with Very Collaborative and Collaborative teachers, although they had the same achievement (487), on average. Exhibit 8.13 presents the teacher collaboration results for the eighth grade. The science teachers of eighth grade students reported a degree of collaboration with other teachers comparable to their colleagues at the fourth grade. Nearly one-third of the eighth grade students (29%) had Very Collaborative teachers and another 58 percent had Collaborative teachers, with 13 percent having only Somewhat Collaborative teachers. Just like at the fourth grade, eighth grade students had essentially the same average science achievement whether their teachers were Very Collaborative or Collaborative (476 and 479, respectively). In general, the ninth grade and benchmarking students also had teachers that reported a considerable amount of collaboration with other teachers. According to TIMSS 2011 reports from teachers, almost all students have the benefit of teachers who collaborate with other teachers to improve instruction. Instruction to Engage Students in Learning Historically, educational studies, including TIMSS, have struggled to link student achievement to instructional activities. Typically, teachers are asked to report how frequently they use various instruction activities and strategies, and such information can be very useful. However, in light of the growing body of evidence about the complexities of teaching and learning, researchers are beginning to understand these lists of activities cannot be used as proxies for the characteristics of good teaching. To help build a better bridge between curriculum and instruction, TIMSS 2011 collected information about the concept of student content engagement as described by McLaughlin, McGrath, Burian-Fitzgerald, Lanahan, Scotchmer, Enyeart, and Salganik (2005). According to this work, supported by the U.S. National Center for Education Statistics, student content engagement focuses on the importance of the activity that brings the student and the subject matter content together. Engagement refers to the cognitive interaction between the student and instructional content, and may take the form of listening to the teacher or providing an explanation of a problem solution. It is the student’s in-the-moment cognitive interaction with instructional content.
370
TIMSS 2011 INTERNATIONAL RESULTS IN SCIENCE CHAPTER 8
To measure aspects of student content engagement, TIMSS 2011 developed both a teacher scale, called the Engaging Students in Learning scale, and a student scale called the Engaged in Science Lessons scale. Exhibit 8.14 presents the fourth grade results for the Engaging Students in Learning scale. The scale contains six items related to teachers’ instructional practices intended to interest students and reinforce learning:
Summarizing the lesson’s learning goals;
Relating the lesson to students’ daily lives;
Questioning to elicit reasons and explanations;
Encouraging students to show improvement;
Praising students for good effort; and
Bringing interesting materials to class.
Students were categorized according to their teachers’ responses, with Most Lessons corresponding to teachers who used three of the six practices in “every or almost every lesson” and the other three in “about half the lessons,” on average. Many fourth grade students, 71 percent on average, internationally, had teachers that made efforts to engage them in instruction by using a variety of strategies in Most Lessons, and most of the remaining students had teachers that used engaging instructional practices in About Half the Lessons (with a few exceptions). Although the fourth grade students whose teachers used engaging instruction in Most Lessons had somewhat higher average science achievement than other students, the pattern varied considerably across the fourth grade, sixth grade, and benchmarking participants. Exhibit 8.15 presents the eighth grade results based on a somewhat shorter Engaging Students in Learning scale. At the eighth grade, two items were removed from the scale because relatively small percentages of students had teachers that frequently related lessons to students’ daily lives, and even smaller percentages had teachers that routinely brought interesting materials to class (see Exhibit 8.16). Perhaps eighth grade teachers should make greater efforts to make science relevant to students’ daily lives and provide interesting materials, especially in light of the drop by the eighth grade in students’ liking science learning. On the other hand, teachers in some of the highest achieving countries reported the least use of these instructional practices.
CLASSROOM INSTRUCTION CHAPTER 8
371
Reported by Teachers Students were scored according to their teachers’ responses to how often they used each of six instructional practices on the Engaging Students in Learning scale. Students with teachers who used engagement practices in Most Lessons had a score on the scale of at least 9.1, which corresponds to their teachers using three of the six practices “every or almost every lesson” and using the other three in “about half the lessons,” on average. Students with teachers who used engagement practices in Some Lessons had a score no higher than 6.0, which corresponds to their teachers using three of the six practices in “some lessons” and using the other three in “about half the lessons,” on average. All other students had teachers who used engagement practices in About Half the Lessons.
Most Lessons Country Romania Lithuania United Arab Emirates Bahrain Qatar Portugal Kazakhstan United States Hungary Croatia Oman England Malta Slovak Republic Slovenia Chile Russian Federation Georgia Northern Ireland Tunisia Serbia Australia Iran, Islamic Rep. of Kuwait Poland Saudi Arabia Italy Czech Republic Thailand Azerbaijan Korea, Rep. of Armenia Singapore Ireland New Zealand Spain Morocco Turkey Chinese Taipei Hong Kong SAR Belgium (Flemish) Sweden Japan Austria Germany Yemen Netherlands Norway Finland Denmark International Avg.
r
r r
r
r
About Half the Lessons
Some Lessons
Percent of Students
Average Achievement
Percent of Students
Average Achievement
Percent of Students
Average Achievement
94 (1.8) 93 (1.6) 90 (1.4) 90 (2.2) 90 (2.4) 89 (2.1) 89 (2.1) 88 (1.5) 88 (1.9) 87 (2.2) 86 (2.4) 85 (3.1) 85 (0.1) 84 (2.2) 84 (2.8) 83 (3.5) 82 (3.0) 81 (2.2) 80 (3.6) 78 (3.7) 78 (3.4) 78 (3.4) 75 (2.7) 74 (3.5) 74 (3.1) 73 (3.3) 73 (3.1) 72 (3.7) 69 (3.5) 69 (3.4) 69 (4.2) 69 (3.7) 68 (2.5) 68 (3.1) 67 (3.1) 66 (3.5) 64 (3.7) 64 (3.5) 62 (4.2) 62 (4.7) 56 (3.2) 55 (4.4) 52 (4.0) 51 (3.4) 47 (3.4) 43 (4.6) 41 (3.9) 41 (5.0) 33 (3.1) 27 (2.9) 71 (0.5)
505 (6.3) 514 (2.6) 432 (2.8) 452 (3.9) 390 (4.6) 522 (4.3) 496 (5.6) 544 (2.1) 533 (4.2) 517 (2.2) 380 (3.8) 529 (3.6) 447 (2.0) 530 (4.2) 519 (2.9) 479 (3.1) 552 (3.5) 457 (4.0) 515 (3.6) 344 (6.1) 516 (3.7) 522 (3.6) 457 (5.0) 349 (5.8) 503 (3.1) 432 (6.3) 524 (3.5) 539 (2.6) 477 (6.3) 442 (6.7) 589 (2.4) 418 (4.5) 581 (4.6) 513 (3.6) 497 (3.5) 506 (3.2) 270 (6.6) 472 (5.5) 552 (3.1) 538 (4.0) 511 (2.7) 539 (3.6) 559 (2.3) 528 (3.3) 520 (3.9) 216 (9.2) 528 (3.4) 493 (3.8) 576 (3.1) 529 (4.8) 487 (0.6)
6 (1.5) 7 (1.6) 9 (1.4) 10 (2.2) 10 (2.4) 10 (2.1) 11 (2.1) 11 (1.4) 12 (1.9) 12 (2.2) 14 (2.4) 15 (3.1) 15 (0.1) 16 (2.2) 16 (2.8) 17 (3.5) 17 (2.9) 19 (2.2) 19 (3.6) 21 (3.5) 22 (3.4) 22 (3.4) 24 (2.8) 24 (3.4) 25 (3.1) 25 (3.1) 27 (3.0) 27 (3.6) 29 (3.5) 31 (3.4) 30 (4.1) 31 (3.7) 28 (2.8) 31 (3.1) 32 (3.0) 33 (3.5) 33 (3.6) 34 (3.4) 31 (3.8) 35 (4.4) 43 (3.3) 42 (4.6) 44 (4.2) 46 (3.3) 49 (3.4) 51 (4.5) 55 (4.2) 56 (5.1) 61 (3.1) 65 (3.1) 27 (0.4)
495 (19.2) 517 (8.6) 412 (10.2) 422 (12.5) 429 (20.3) 516 (8.7) 492 (12.6) 549 (7.9) 535 (8.8) 509 (6.1) 368 (16.8) 530 (8.9) 445 (3.9) 539 (6.0) 526 (7.0) 493 (8.4) 551 (7.6) 448 (11.2) 525 (7.1) 353 (10.1) 514 (5.2) 511 (7.3) 439 (7.8) 344 (10.9) 509 (4.0) 424 (10.4) 528 (4.7) 530 (6.2) 463 (10.9) 431 (11.7) 580 (3.2) 414 (8.0) 583 (6.6) 522 (7.1) 497 (4.1) 506 (5.5) 252 (7.6) 444 (8.2) 552 (4.1) 527 (10.8) 507 (3.0) 529 (4.7) 558 (2.8) 535 (4.4) 534 (3.6) 205 (10.7) 532 (3.4) 496 (3.1) 567 (3.5) 531 (3.2) 484 (1.2)
1 (0.0) 0 (0.0) 1 (0.0) 0 (0.0) 0 (0.0) 0 (0.0) 0 (0.0) 1 (0.5) 0 (0.0) 0 (0.2) 1 (0.6) 0 (0.0) 0 (0.0) 0 (0.3) 0 (0.0) 0 (0.0) 1 (0.7) 0 (0.0) 1 (0.6) 2 (1.1) 0 (0.4) 0 (0.2) 1 (0.4) 2 (1.1) 1 (0.6) 1 (1.1) 1 (0.0) 1 (0.8) 2 (1.0) 0 (0.0) 1 (0.9) 1 (0.5) 4 (1.1) 1 (0.5) 0 (0.4) 2 (1.1) 3 (1.3) 2 (0.9) 7 (2.0) 3 (1.5) 1 (0.5) 2 (1.2) 4 (1.3) 3 (1.3) 4 (1.4) 5 (1.9) 4 (2.0) 3 (1.5) 5 (1.3) 8 (2.3) 2 (0.1)
~~ ~~ ~~ ~~ ~~ ~~ ~~ ~~ ~~ ~~ ~~ ~~ ~~ ~~ ~~ ~~ ~~ ~~ ~~ ~~ ~~ ~~ ~~ ~~ ~~ ~~ ~~ ~~ ~~ ~~ ~~ ~~ 612 (11.3) ~~ ~~ ~~ 249 (29.4) ~~ 540 (6.9) 552 (4.6) ~~ ~~ 558 (8.8) 535 (9.6) 552 (6.5) 199 (25.1) 531 (12.0) 481 (8.4) 576 (6.0) 525 (12.0) ~~
Centerpoint of scale set at 10. ( ) Standard errors appear in parentheses. Because of rounding some results may appear inconsistent. A tilde (~) indicates insufficient data to report achievement. An “r” indicates data are available for at least 70% but less than 85% of the students. An “s” indicates data are available for at least 50% but less than 70% of the students.
372
TIMSS 2011 INTERNATIONAL RESULTS IN SCIENCE CHAPTER 8
Average Scale Score 11.4 (0.15) 11.1 (0.10) 11.4 (0.09) 11.0 (0.17) 11.3 (0.13) 10.8 (0.13) 11.6 (0.14) 10.9 (0.09) 10.8 (0.11) 10.5 (0.10) 10.7 (0.12) 10.3 (0.13) 10.9 (0.00) 10.5 (0.11) 10.5 (0.13) 11.0 (0.16) 10.7 (0.16) 10.6 (0.13) 9.8 (0.12) 10.4 (0.18) 10.3 (0.12) 10.1 (0.13) 10.3 (0.13) 10.2 (0.17) 10.2 (0.12) 10.3 (0.15) 10.3 (0.14) 9.7 (0.12) 10.0 (0.17) 9.9 (0.12) 10.3 (0.19) 10.1 (0.16) 9.8 (0.12) 9.8 (0.12) 9.7 (0.10) 9.9 (0.16) 9.7 (0.16) 9.9 (0.13) 9.6 (0.22) 9.3 (0.17) 9.1 (0.10) 9.1 (0.16) 8.9 (0.13) 9.1 (0.13) 8.7 (0.11) 8.8 (0.17) 8.5 (0.11) 8.8 (0.16) 8.4 (0.10) 8.1 (0.12) ~~
SOURCE: IEA’s Trends in International Mathematics and Science Study – TIMSS 2011
Exhibit 8.14: Instruction to Engage Students in Learning
Most Lessons Country
About Half the Lessons
Some Lessons
Percent of Students
Average Achievement
Percent of Students
Average Achievement
Percent of Students
Average Achievement
79 (4.1) 76 (3.8) 40 (4.0)
440 (6.0) 373 (7.3) 351 (10.4)
20 (4.1) 24 (3.8) 51 (4.3)
405 (15.6) 366 (13.7) 337 (10.1)
1 (1.0) 0 (0.0) 9 (2.6)
~~ ~~ 369 (17.7)
96 (1.9) 94 (0.8) 90 (2.2) 88 (2.8) 84 (3.8) 79 (3.1) 58 (4.2)
543 (3.8) 466 (3.6) 414 (5.4) 536 (5.0) 543 (3.2) 528 (3.0) 518 (3.7)
4 (1.9) 4 (0.8) 10 (2.2) 10 (3.1) 16 (3.8) 21 (3.1) 41 (4.3)
538 (30.3) 494 (13.8) 412 (19.2) 553 (12.7) 537 (9.0) 526 (7.0) 514 (3.9)
0 (0.0) 2 (0.1) 0 (0.0) 1 (1.3) 0 (0.0) 0 (0.0) 2 (0.6)
Average Scale Score
Sixth Grade Participants Honduras Botswana Yemen
10.3 (0.18) 10.3 (0.16) 8.6 (0.16)
Benchmarking Participants Florida, US Dubai, UAE Abu Dhabi, UAE North Carolina, US Alberta, Canada Ontario, Canada Quebec, Canada
s r r
~~ ~~ ~~ ~~ ~~ ~~ ~~
How often do you do the following in teaching this class? Every or almost every lesson
1) Summarize what students should have learned from the lesson --------------------------------------------------
A A Use questioning to elicit reasons and explanations --- A
2) Relate the lesson to students’ daily lives ----------------3)
4) Encourage all students to improve their performance -----------------------------------------------------
A A Bring interesting materials to class ------------------------ A
5) Praise students for good effort -----------------------------6)
Most Lessons
T5r81194
Some lessons
Never
A A A
A A A
A A A
A A A
A A A
A A A
About Half the Lessons 9.1
About half the lessons
Some Lessons 6.0
CLASSROOM INSTRUCTION CHAPTER 8
373
11.1 (0.16) 11.5 (0.10) 11.6 (0.15) 10.8 (0.15) 10.3 (0.13) 10.0 (0.12) 9.3 (0.14)
SOURCE: IEA’s Trends in International Mathematics and Science Study – TIMSS 2011
Exhibit 8.14: Instruction to Engage Students in Learning (Continued)
Reported by Teachers Students were scored according to their teachers’ responses to how often they used each of four instructional practices on the Engaging Students in Learning scale. Students with teachers who used engagement practices in Most Lessons had a score on the scale of at least 8.7, which corresponds to their teachers using two of the four practices “every or almost every lesson” and using the other two in “about half the lessons,” on average. Students with teachers who used engagement practices in Some Lessons had a score no higher than 5.7, which corresponds to their teachers using two of the four practices in “some lessons” and using the other two in “about half the lessons,” on average. All other students had teachers who used engagement practices in About Half the Lessons.
Most Lessons Country Palestinian Nat'l Auth. United Arab Emirates Qatar Indonesia England Kazakhstan Romania Lithuania Ukraine Morocco Jordan Saudi Arabia Macedonia, Rep. of United States Lebanon Syrian Arab Republic Chile Ghana Oman Georgia Bahrain Russian Federation Thailand Israel Tunisia Hungary New Zealand Iran, Islamic Rep. of Australia Slovenia Turkey Italy Armenia Malaysia Sweden Singapore Chinese Taipei Korea, Rep. of Hong Kong SAR Finland Norway Japan International Avg.
r
s
s
r
About Half the Lessons
Some Lessons
Percent of Students
Average Achievement
Percent of Students
Average Achievement
Percent of Students
Average Achievement
94 (1.6) 94 (1.1) 93 (1.7) 93 (1.1) 93 (1.6) 91 (1.2) 91 (1.4) 90 (1.1) 89 (1.6) 89 (1.4) 89 (2.2) 89 (2.7) 89 (1.3) 88 (1.9) 88 (2.3) 88 (2.4) 87 (2.6) 86 (3.0) 85 (2.2) 84 (1.7) 84 (2.1) 83 (1.0) 83 (3.2) 83 (2.5) 83 (2.8) 83 (1.6) 81 (3.5) 81 (2.6) 81 (2.7) 81 (1.8) 79 (2.7) 78 (3.2) 77 (2.2) 77 (3.2) 65 (3.2) 63 (2.6) 61 (4.4) 58 (3.3) 51 (4.9) 48 (2.8) 46 (4.1) 44 (4.2) 80 (0.4)
422 (3.2) 462 (2.5) 420 (3.8) 404 (4.7) 532 (5.6) 493 (4.1) 466 (3.4) 514 (2.6) 502 (3.7) 377 (2.4) 451 (4.4) 438 (4.3) 414 (5.7) 532 (3.3) 406 (4.8) 424 (4.1) 461 (3.0) 305 (5.8) 422 (3.4) 420 (3.2) 460 (2.8) 545 (3.0) 450 (4.6) 518 (4.6) 438 (2.9) 520 (3.2) 510 (5.1) 477 (4.2) 527 (6.9) 542 (2.6) 482 (4.1) 501 (3.2) 437 (3.4) 427 (6.8) 511 (3.3) 593 (6.0) 562 (3.7) 559 (2.6) 539 (5.9) 555 (3.0) 488 (4.0) 560 (3.7) 478 (0.6)
6 (1.6) 6 (1.1) 6 (1.4) 7 (1.1) 7 (1.6) 8 (1.2) 8 (1.2) 10 (1.2) 10 (1.6) 10 (1.4) 9 (2.1) 11 (2.7) 9 (1.2) 10 (1.8) 11 (2.1) 11 (2.3) 12 (2.5) 14 (3.0) 15 (2.2) 14 (1.6) 16 (2.1) 15 (1.0) 12 (2.7) 16 (2.4) 14 (2.3) 16 (1.5) 16 (3.3) 18 (2.6) 18 (2.7) 17 (1.7) 17 (2.5) 20 (3.1) 21 (2.2) 19 (2.8) 28 (2.8) 30 (2.7) 26 (4.0) 33 (3.1) 35 (4.5) 45 (2.5) 48 (4.5) 44 (4.1) 17 (0.4)
398 (15.6) 471 (11.6) 411 (12.0) 416 (8.9) 533 (13.0) 468 (8.7) 456 (7.5) 519 (5.1) 491 (6.4) 375 (5.1) 441 (18.4) 428 (8.6) 385 (10.6) 514 (12.1) 404 (13.4) 437 (10.4) 464 (10.1) 303 (14.9) 406 (10.7) 424 (4.4) 418 (8.5) 533 (6.8) 456 (14.1) 525 (9.7) 439 (4.7) 534 (5.0) 520 (10.4) 460 (10.0) 524 (7.9) 545 (4.3) 482 (8.8) 506 (6.5) 442 (5.9) 418 (17.3) 507 (4.3) 585 (8.5) 569 (5.0) 560 (3.6) 532 (6.6) 549 (2.6) 499 (3.3) 556 (3.9) 474 (1.5)
0 (0.0) 0 (0.0) 1 (0.9) 0 (0.3) 1 (0.4) 0 (0.2) 1 (0.6) 0 (0.2) 1 (0.3) 1 (0.5) 2 (1.0) 0 (0.0) 2 (0.6) 1 (0.6) 1 (0.5) 1 (0.6) 1 (0.0) 0 (0.0) 0 (0.1) 2 (0.5) 0 (0.0) 1 (0.4) 5 (1.8) 1 (0.8) 4 (1.5) 2 (0.5) 3 (1.4) 1 (0.6) 1 (0.3) 2 (0.5) 3 (1.1) 1 (0.9) 3 (0.8) 4 (1.6) 7 (1.9) 7 (1.2) 13 (2.7) 9 (2.1) 14 (3.1) 7 (1.3) 6 (2.1) 12 (2.8) 3 (0.2)
~~ ~~ ~~ ~~ ~~ ~~ ~~ ~~ ~~ ~~ ~~ ~~ ~~ ~~ ~~ ~~ ~~ ~~ ~~ ~~ ~~ ~~ 443 (21.7) ~~ 437 (6.7) ~~ 503 (50.3) ~~ ~~ ~~ 513 (30.9) ~~ 435 (11.2) 425 (36.0) 529 (8.5) 586 (13.2) 563 (7.2) 567 (8.1) 527 (15.8) 549 (5.8) 497 (12.1) 559 (6.0) 509 (5.6)
Centerpoint of scale set at 10. ( ) Standard errors appear in parentheses. Because of rounding some results may appear inconsistent. A tilde (~) indicates insufficient data to report achievement. An “r” indicates data are available for at least 70% but less than 85% of the students. An “s” indicates data are available for at least 50% but less than 70% of the students. An “x” indicates data are available for less than 50% of students.
374
TIMSS 2011 INTERNATIONAL RESULTS IN SCIENCE CHAPTER 8
Average Scale Score 10.9 (0.12) 10.9 (0.07) 10.5 (0.15) 10.8 (0.12) 10.8 (0.10) 10.8 (0.08) 10.7 (0.09) 10.5 (0.07) 10.6 (0.09) 10.5 (0.09) 10.4 (0.12) 10.2 (0.14) 10.7 (0.08) 10.5 (0.10) 10.4 (0.12) 10.2 (0.11) 10.4 (0.15) 10.6 (0.15) 10.3 (0.12) 10.3 (0.10) 10.5 (0.10) 10.0 (0.05) 10.2 (0.16) 10.2 (0.13) 10.3 (0.15) 10.2 (0.09) 9.7 (0.15) 10.0 (0.12) 9.8 (0.12) 9.9 (0.07) 9.9 (0.13) 9.8 (0.15) 10.0 (0.11) 9.7 (0.16) 9.0 (0.14) 9.1 (0.12) 8.8 (0.22) 9.0 (0.17) 8.4 (0.22) 8.4 (0.10) 8.4 (0.15) 8.2 (0.18)
SOURCE: IEA’s Trends in International Mathematics and Science Study – TIMSS 2011
Exhibit 8.15: Instruction to Engage Students in Learning
Most Lessons Country
About Half the Lessons
Some Lessons
Average Scale Score
Percent of Students
Average Achievement
Percent of Students
Average Achievement
Percent of Students
Average Achievement
90 (2.2) 85 (3.3) 76 (3.0)
404 (4.0) 369 (4.7) 323 (4.5)
8 (2.2) 14 (3.2) 19 (2.8)
398 (7.3) 367 (6.7) 346 (14.2)
1 (1.0) 0 (0.4) 5 (1.9)
~~ ~~ 353 (22.4)
10.4 (0.13) 10.4 (0.17) 9.5 (0.15)
95 (1.2) 93 (2.3) 92 (3.2) 91 (3.5) 91 (4.4) 88 (4.9) 86 (2.7) 85 (4.0) 85 (2.7) 85 (4.8) 84 (4.6) 83 (5.0) 63 (4.5) xx
484 (3.2) 459 (4.5) 539 (7.1) 532 (5.4) 563 (7.4) 531 (10.3) 546 (2.7) 506 (8.0) 520 (3.0) 483 (9.0) 544 (6.6) 552 (7.0) 518 (3.5) xx
5 (1.2) 7 (2.3) 7 (2.9) 8 (3.4) 9 (4.4) 11 (4.8) 14 (2.7) 13 (3.2) 14 (2.6) 11 (3.8) 15 (4.5) 16 (5.1) 31 (4.1) xx
411 (17.6) 495 (18.2) 495 (45.5) 533 (17.5) 579 (15.1) 501 (33.4) 546 (6.0) 487 (14.0) 525 (8.6) 508 (19.3) 554 (19.2) 556 (9.7) 527 (6.3) xx
0 (0.0) 0 (0.0) 1 (0.1) 1 (1.1) 0 (0.0) 1 (0.1) 0 (0.0) 2 (1.8) 1 (0.7) 4 (3.2) 1 (0.8) 1 (0.7) 6 (1.9) xx
~~ ~~ ~~ ~~ ~~ ~~ ~~ ~~ ~~ 466 (33.6) ~~ ~~ 518 (12.6) xx
11.0 (0.07) 10.7 (0.13) 11.1 (0.19) 10.6 (0.23) 10.5 (0.22) 10.8 (0.30) 10.1 (0.13) 10.2 (0.21) 10.2 (0.14) 10.5 (0.20) 10.5 (0.29) 9.8 (0.25) 8.8 (0.16) xx
Ninth Grade Participants Botswana Honduras South Africa Benchmarking Participants Dubai, UAE Abu Dhabi, UAE Connecticut, US Indiana, US Massachusetts, US North Carolina, US Alberta, Canada California, US Ontario, Canada Alabama, US Colorado, US Minnesota, US Quebec, Canada Florida, US
r s s s s s s s r
How often do you do the following in teaching this class? Every or almost every lesson
1) Summarize what students should have learned from the lesson -------------------------------------------------2) Use questioning to elicit reasons and explanations --3) Encourage all students to improve their performance ----------------------------------------------------4) Praise students for good effort ------------------------------
Some lessons
Never
A A
A A
A A
A A
A A
A A
A A
A A
Most Lessons
About Half the Lessons 8.7
About half the lessons
Some Lessons
5.7
CLASSROOM INSTRUCTION CHAPTER 8
375
SOURCE: IEA’s Trends in International Mathematics and Science Study – TIMSS 2011
Exhibit 8.15: Instruction to Engage Students in Learning (Continued)
Exhibit 8.16: Teachers Relate Lessons to Students’ Daily Lives and Bring Interesting Materials to Class Relate Lessons to Students’ Daily Lives Every Lesson or Almost Every Lesson
Country
Armenia Australia Bahrain Chile Chinese Taipei England Finland Georgia Ghana Hong Kong SAR Hungary Indonesia Iran, Islamic Rep. of Israel Italy Japan Jordan Kazakhstan Korea, Rep. of Lebanon Lithuania Macedonia, Rep. of Malaysia Morocco New Zealand Norway Oman Palestinian Nat’l Auth. Qatar Romania Russian Federation Saudi Arabia Singapore Slovenia Sweden Syrian Arab Republic Thailand Tunisia Turkey Ukraine United Arab Emirates United States International Avg.
s
r
r
s
Bring Interesting Materials to Class
About Half the Lessons or Less
Percent of Students
Average Achievement
Percent of Students
Average Achievement
59 (2.4) 50 (3.6) 61 (3.4) 78 (2.7) 55 (4.0) 42 (3.2) 53 (2.6) 56 (2.5) 77 (3.6) 47 (4.6) 75 (1.8) 86 (2.7) 52 (3.5) 68 (3.7) 41 (3.7) 32 (3.9) 80 (2.8) 73 (2.5) 57 (3.6) 72 (2.3) 62 (2.2) 75 (2.2) 62 (3.5) 70 (2.0) 47 (3.9) 32 (3.9) 66 (3.1) 77 (3.7) 67 (3.8) 81 (2.0) 64 (2.0) 80 (3.4) 46 (2.8) 71 (1.7) 44 (3.8) 73 (3.2) 54 (3.6) 70 (3.1) 76 (2.4) 61 (2.8) 75 (2.1) 64 (2.5) 63 (0.5)
441 (3.7) 531 (8.8) 462 (3.3) 461 (3.1) 558 (3.5) 530 (7.7) 555 (2.9) 421 (3.9) 305 (6.3) 533 (6.0) 523 (3.3) 407 (4.2) 483 (5.2) 514 (4.8) 503 (4.1) 557 (3.1) 452 (5.2) 493 (4.4) 560 (2.3) 408 (5.2) 515 (3.0) 412 (5.7) 428 (6.5) 377 (2.6) 505 (5.7) 494 (4.7) 424 (4.4) 422 (4.0) 427 (5.7) 467 (3.5) 545 (3.8) 433 (4.0) 590 (6.1) 543 (3.0) 516 (4.1) 423 (4.7) 455 (5.2) 441 (2.8) 482 (4.1) 509 (3.5) 459 (2.9) 531 (4.4) 478 (0.7)
41 (2.4) 50 (3.6) 39 (3.4) 22 (2.7) 45 (4.0) 58 (3.2) 47 (2.6) 44 (2.5) 23 (3.6) 53 (4.6) 25 (1.8) 14 (2.7) 48 (3.5) 32 (3.7) 59 (3.7) 68 (3.9) 20 (2.8) 27 (2.5) 43 (3.6) 28 (2.3) 38 (2.2) 25 (2.2) 38 (3.5) 30 (2.0) 53 (3.9) 68 (3.9) 34 (3.1) 23 (3.7) 33 (3.8) 19 (2.0) 36 (2.0) 20 (3.4) 54 (2.8) 29 (1.7) 56 (3.8) 27 (3.2) 46 (3.6) 30 (3.1) 24 (2.4) 39 (2.8) 25 (2.1) 36 (2.5) 37 (0.5)
434 (4.6) 522 (6.1) 439 (4.7) 461 (6.2) 571 (3.9) 534 (6.1) 548 (2.7) 418 (3.6) 306 (11.1) 537 (6.0) 521 (4.7) 419 (9.7) 465 (6.2) 526 (7.1) 501 (4.1) 558 (3.1) 436 (10.3) 484 (7.0) 561 (3.3) 398 (8.2) 513 (3.1) 407 (10.3) 424 (11.2) 376 (4.2) 517 (7.5) 493 (2.9) 411 (7.9) 416 (8.1) 405 (10.1) 456 (6.6) 538 (3.7) 450 (10.0) 591 (5.6) 543 (3.0) 508 (3.7) 434 (7.7) 446 (6.3) 434 (4.3) 488 (6.4) 488 (4.6) 472 (5.8) 527 (4.6) 476 (1.0)
Every Lesson or Almost Every Lesson
s
r
r
s
About Half the Lessons or Less
Percent of Students
Average Achievement
Percent of Students
Average Achievement
27 (2.8) 25 (3.9) 40 (2.9) 34 (4.0) 15 (3.0) 23 (3.4) 17 (1.8) 44 (2.5) 36 (4.2) 19 (4.0) 34 (2.3) 38 (3.6) 29 (3.5) 47 (3.6) 14 (2.8) 15 (3.2) 31 (3.6) 63 (2.7) 35 (3.6) 31 (2.8) 40 (2.2) 59 (2.4) 16 (2.8) 33 (2.2) 15 (2.3) 18 (3.1) 27 (2.6) 45 (3.9) 46 (4.8) 48 (2.6) 43 (1.6) 37 (4.0) 14 (1.7) 29 (2.1) 27 (2.8) 34 (3.9) 36 (3.8) 29 (3.3) 18 (2.4) 39 (2.8) 45 (2.3) 38 (2.7) 32 (0.5)
447 (5.5) 518 (11.9) 475 (5.9) 456 (6.4) 555 (8.7) 530 (13.6) 560 (3.7) 419 (4.5) 302 (10.1) 543 (9.5) 518 (5.0) 415 (5.3) 488 (7.7) 517 (5.6) 503 (6.3) 565 (6.8) 446 (6.0) 490 (4.4) 563 (2.9) 407 (8.1) 516 (3.0) 422 (6.3) 431 (14.5) 385 (3.8) 500 (9.7) 485 (7.6) 423 (7.8) 424 (6.3) 423 (8.4) 467 (3.8) 545 (4.1) 439 (6.1) 600 (13.1) 542 (2.7) 512 (5.5) 433 (6.8) 462 (7.9) 441 (5.4) 490 (12.9) 504 (4.3) 459 (3.8) 536 (5.1) 480 (1.1)
73 (2.8) 75 (3.9) 60 (2.9) 66 (4.0) 85 (3.0) 77 (3.4) 83 (1.8) 56 (2.5) 64 (4.2) 81 (4.0) 66 (2.3) 62 (3.6) 71 (3.5) 53 (3.6) 86 (2.8) 85 (3.2) 69 (3.6) 37 (2.7) 65 (3.6) 69 (2.8) 60 (2.2) 41 (2.4) 84 (2.8) 67 (2.2) 85 (2.3) 82 (3.1) 73 (2.6) 55 (3.9) 54 (4.8) 52 (2.6) 57 (1.6) 63 (4.0) 86 (1.7) 71 (2.1) 73 (2.8) 66 (3.9) 64 (3.8) 71 (3.3) 82 (2.4) 61 (2.8) 55 (2.3) 62 (2.7) 68 (0.5)
435 (3.8) 529 (6.2) 440 (3.2) 463 (3.2) 565 (2.5) 533 (5.9) 550 (2.5) 421 (3.1) 307 (6.9) 533 (4.3) 525 (3.3) 399 (6.4) 469 (4.5) 518 (6.6) 502 (2.9) 556 (2.5) 451 (5.4) 490 (6.5) 559 (2.6) 404 (5.8) 514 (2.9) 395 (6.7) 424 (6.6) 373 (2.6) 513 (5.1) 495 (2.6) 418 (4.6) 417 (4.7) 417 (9.2) 462 (4.3) 541 (3.5) 435 (5.0) 589 (4.6) 543 (3.0) 511 (3.2) 423 (4.6) 444 (5.0) 437 (2.7) 482 (3.6) 499 (3.8) 465 (3.5) 526 (4.2) 476 (0.7)
( ) Standard errors appear in parentheses. Because of rounding some results may appear inconsistent. An “r” indicates data are available for at least 70% but less than 85% of the students. An “s” indicates data are available for at least 50% but less than 70% of the students. An “x” indicates data are available for less than 50% of students.
376
TIMSS 2011 INTERNATIONAL RESULTS IN SCIENCE CHAPTER 8
SOURCE: IEA’s Trends in International Mathematics and Science Study – TIMSS 2011
Reported by Teachers
Relate Lessons to Students’ Daily Lives Every Lesson or Almost Every Lesson
Country
Bring Interesting Materials to Class
About Half the Lessons or Less
Every Lesson or Almost Every Lesson
About Half the Lessons or Less
Percent of Students
Average Achievement
Percent of Students
Average Achievement
Percent of Students
Average Achievement
Percent of Students
Average Achievement
75 (3.6) 81 (3.4) 61 (3.6)
399 (4.1) 370 (4.6) 323 (5.4)
25 (3.6) 19 (3.4) 39 (3.6)
418 (8.7) 365 (8.8) 338 (7.2)
31 (4.0) 23 (2.6) 21 (2.9)
412 (7.4) 372 (7.5) 309 (7.3)
69 (4.0) 77 (2.6) 79 (2.9)
400 (4.1) 369 (4.9) 334 (5.0)
54 (4.2) 57 (4.4) 41 (4.1) 71 (3.9) 74 (4.3) 67 (6.3) 58 (6.0) 63 (8.1) 67 (5.6) xx 70 (5.6) 56 (6.2) 56 (6.0) 69 (8.5)
544 (3.3) 520 (3.7) 518 (4.0) 457 (4.6) 477 (4.7) 486 (10.1) 508 (9.4) 544 (8.1) 529 (7.4) xx 530 (6.1) 559 (9.2) 555 (10.0) 544 (11.3)
46 (4.2) 43 (4.4) 59 (4.1) 29 (3.9) 26 (4.3) 33 (6.3) 42 (6.0) 37 (8.1) 33 (5.6) xx 30 (5.6) 44 (6.2) 44 (6.0) 31 (8.5)
549 (3.2) 523 (3.8) 522 (4.3) 472 (10.4) 492 (10.0) 482 (10.4) 500 (10.2) 548 (9.9) 548 (14.7) xx 536 (7.1) 572 (10.6) 551 (6.7) 491 (16.0)
24 (3.5) 22 (2.9) 29 (4.5) 45 (4.1) 46 (4.6) 48 (6.9) 36 (4.9) 35 (6.1) 43 (7.0) xx 48 (5.6) 37 (5.5) 39 (6.3) 28 (7.0)
544 (4.8) 522 (6.2) 515 (6.4) 458 (6.6) 476 (6.4) 481 (10.2) 521 (8.6) 540 (14.4) 527 (9.9) xx 530 (5.6) 542 (12.5) 562 (9.1) 553 (21.4)
76 (3.5) 78 (2.9) 71 (4.5) 55 (4.1) 54 (4.6) 52 (6.9) 64 (4.9) 65 (6.1) 57 (7.0) xx 52 (5.6) 63 (5.5) 61 (6.3) 72 (7.0)
547 (2.9) 521 (3.1) 523 (3.6) 465 (6.4) 484 (5.8) 488 (9.2) 496 (8.5) 548 (7.5) 540 (9.6) xx 533 (8.4) 578 (6.5) 547 (8.1) 519 (11.8)
Ninth Grade Participants Botswana Honduras South Africa Benchmarking Participants Alberta, Canada Ontario, Canada Quebec, Canada Abu Dhabi, UAE Dubai, UAE Alabama, US California, US Colorado, US Connecticut, US Florida, US Indiana, US Massachusetts, US Minnesota, US North Carolina, US
r s s s s s s r s
r s s s s s s r s
CLASSROOM INSTRUCTION CHAPTER 8
377
SOURCE: IEA’s Trends in International Mathematics and Science Study – TIMSS 2011
Exhibit 8.16: Teachers Relate Lessons to Students’ Daily Lives and Bring Interesting Materials to Class (Continued)
Based on the shorter four-item scale, on average, 80 percent of the eighth grade students had teachers that reported using engaging practices in most lessons, and almost all of the rest had teachers that reported using engaging practices in about half the lessons. Across the eighth grade, ninth grade, and benchmarking participants, students often had somewhat higher average science achievement if their teachers used engaging instruction in Most Lessons rather than About Half the Lessons. Exhibits 8.17 and 8.18 present the results for the TIMSS 2011 Engaged in Science Lessons scale that looks at engagement from the student perspective. This scale asks how much students agree with the following five statements:
I know what my teacher expects me to do;
I think of things not related to the lesson (reverse coded);
My teacher is easy to understand;
I am interested in what my teacher says; and
My teacher gives me interesting things to do.
Students considered to be Engaged had a score on the scale corresponding to “agreeing a lot” with at least three of the statements and “agreeing a little” with the other two, on average. Being in the Not Engaged category was based on a scale score corresponding to, at most, “agreeing a little” with no more than two statements and “disagreeing a little” with the other three, on average. All other students were considered to be Somewhat Engaged. At the fourth grade, internationally, on average, 45 percent of students reported being Engaged during their science lessons, another 47 percent reported being Somewhat Engaged, and only 8 percent reported being Not Engaged. Across the fourth grade, sixth grade, and benchmarking participants, there was a positive relationship between students’ reports about being more engaged and average science achievement. Engaged students had higher achievement than their counterparts who reported being only Somewhat Engaged, and students Not Engaged had the lowest achievement (504 vs. 476 and 457, respectively).
378
TIMSS 2011 INTERNATIONAL RESULTS IN SCIENCE CHAPTER 8
At the eighth grade, internationally, on average, smaller percentages of students than at the fourth grade reported being engaged in their science lessons. In countries teaching general or integrated science, only 29 percent of the eighth grade students, on average, reported being Engaged during their science lessons. The majority (51%) reported being Somewhat Engaged and 21 percent reported being Not Engaged. For the general or integrated science countries, there was a direct relationship between student engagement and average science achievement—the more engaged students reported being, the higher their average science achievement; and this held across the eighth grade, ninth grade, and across benchmarking participants. Among the separate science subject countries, students reported somewhat more engagement in biology and earth science lessons (33% and 31% Engaged, respectively) than in chemistry and physics lessons (26% and 27% Engaged, respectively). In each of the science subjects, students reporting being engaged in their lessons had higher science achievement than those who were only somewhat or not engaged.
CLASSROOM INSTRUCTION CHAPTER 8
379
Reported by Students Students were scored according to their degree of agreement with five statements on the Engaged in Science Lessons scale. Students Engaged in science lessons had a score on the scale of at least 10.1, which corresponds to their “agreeing a lot” with three of the five statements and “agreeing a little” with the other two, on average. Students who were Not Engaged had a score no higher than 7.4, which corresponds to their “disagreeing a little” with three of the five statements and “agreeing a little” with the other two, on average. All other students were Somewhat Engaged in science lessons.
Engaged Country Tunisia Iran, Islamic Rep. of Russian Federation Romania Armenia Malta Portugal Hungary Bahrain Poland United States Ireland Serbia United Arab Emirates Turkey Kuwait Lithuania Kazakhstan Czech Republic Oman Saudi Arabia Norway Slovenia Germany Croatia Australia Spain Georgia Thailand Austria Northern Ireland England Morocco Italy Slovak Republic Azerbaijan Chile Singapore Chinese Taipei Qatar New Zealand Belgium (Flemish) Sweden Netherlands Hong Kong SAR Yemen Denmark Finland Korea, Rep. of Japan International Avg.
r
Somewhat Engaged
Percent of Students
Average Achievement
Percent of Students
Average Achievement
Percent of Students
Average Achievement
65 (1.6) 61 (1.1) 59 (1.1) 58 (1.7) 57 (1.3) 55 (0.8) 54 (1.9) 54 (1.1) 53 (1.3) 52 (1.1) 51 (0.8) 51 (1.3) 51 (1.4) 51 (0.8) 51 (1.2) 51 (1.3) 50 (1.2) 50 (1.7) 49 (1.3) 49 (1.1) 49 (1.4) 48 (1.5) 48 (1.2) 47 (1.2) 47 (1.2) 46 (1.0) 46 (1.5) 46 (1.0) 46 (1.7) 44 (1.0) 44 (1.4) 44 (1.2) 43 (2.0) 43 (1.2) 41 (1.0) 41 (1.5) 40 (1.0) 40 (0.8) 40 (1.2) 39 (1.5) 39 (0.9) 37 (1.1) 37 (1.2) 35 (1.2) 34 (1.2) 31 (1.9) 27 (1.1) 23 (0.9) 19 (0.9) 12 (0.8) 45 (0.2)
373 (5.3) 467 (3.8) 559 (3.6) 531 (5.8) 433 (4.1) 468 (2.0) 535 (4.1) 553 (3.5) 482 (3.0) 515 (2.8) 561 (2.1) 529 (3.5) 525 (3.0) 457 (2.9) 498 (3.4) 382 (5.4) 524 (2.5) 511 (5.0) 540 (3.1) 415 (4.4) 462 (5.3) 503 (2.5) 529 (3.0) 539 (3.2) 520 (2.4) 532 (2.9) 519 (2.8) 480 (3.3) 491 (5.3) 539 (3.2) 531 (3.3) 534 (4.1) 299 (5.7) 534 (3.4) 542 (4.4) 472 (6.8) 505 (3.1) 604 (3.3) 564 (2.4) 448 (5.7) 511 (3.0) 514 (2.4) 538 (3.3) 538 (2.8) 550 (3.7) 245 (7.7) 533 (3.9) 578 (3.7) 605 (3.9) 573 (3.9) 504 (0.6)
32 (1.4) 35 (1.0) 36 (1.1) 37 (1.5) 35 (1.0) 36 (0.8) 44 (1.7) 39 (0.9) 40 (1.0) 42 (1.1) 41 (0.7) 41 (1.0) 43 (1.1) 43 (0.7) 44 (0.9) 42 (1.2) 44 (1.1) 47 (1.7) 43 (1.1) 46 (1.0) 45 (1.3) 44 (1.3) 46 (1.2) 46 (1.0) 46 (1.0) 44 (0.9) 46 (1.3) 51 (1.0) 49 (1.5) 47 (0.9) 49 (1.2) 47 (1.1) 48 (1.8) 50 (1.0) 51 (0.9) 55 (1.4) 52 (0.9) 49 (0.7) 47 (0.9) 52 (1.5) 51 (0.9) 56 (1.0) 55 (0.9) 56 (1.0) 50 (1.1) 58 (1.7) 56 (0.9) 57 (1.1) 58 (0.9) 54 (1.2) 47 (0.2)
308 (6.7) 438 (4.8) 545 (4.1) 480 (7.2) 402 (4.5) 424 (3.4) 507 (4.6) 515 (4.4) 427 (4.4) 497 (3.3) 530 (2.6) 506 (4.2) 508 (4.0) 406 (3.2) 438 (4.5) 329 (4.8) 507 (3.5) 483 (6.0) 533 (3.1) 350 (4.8) 411 (6.6) 488 (3.0) 514 (3.1) 525 (3.4) 514 (2.8) 506 (3.4) 495 (3.9) 448 (4.6) 461 (6.5) 526 (3.4) 509 (3.6) 527 (3.2) 243 (4.3) 520 (3.1) 526 (3.7) 439 (5.5) 468 (2.8) 572 (4.0) 548 (2.9) 376 (4.9) 490 (3.0) 506 (2.4) 534 (3.0) 529 (2.7) 527 (5.3) 206 (7.7) 527 (3.3) 571 (2.8) 590 (2.1) 561 (1.7) 476 (0.6)
3 (0.4) 5 (0.5) 5 (0.4) 5 (0.6) 8 (0.7) 9 (0.4) 2 (0.4) 7 (0.5) 7 (0.8) 6 (0.4) 7 (0.4) 8 (0.7) 5 (0.6) 6 (0.3) 5 (0.5) 7 (0.6) 6 (0.5) 3 (0.3) 8 (0.7) 5 (0.3) 6 (0.6) 8 (0.8) 6 (0.5) 7 (0.6) 7 (0.7) 9 (0.6) 8 (0.7) 3 (0.3) 5 (0.4) 9 (0.7) 8 (0.7) 9 (0.7) 8 (0.9) 6 (0.5) 8 (0.5) 4 (0.4) 8 (0.5) 11 (0.5) 13 (0.9) 8 (0.7) 10 (0.6) 7 (0.5) 8 (0.6) 9 (0.5) 16 (0.8) 11 (1.3) 18 (1.0) 20 (1.0) 23 (1.0) 34 (1.6) 8 (0.1)
258 (14.1) 393 (9.7) 544 (6.9) 436 (17.9) 368 (8.4) 405 (7.2) ~~ 520 (7.5) 413 (11.4) 491 (7.7) 521 (5.1) 503 (6.3) 498 (8.8) 377 (6.0) 366 (10.0) 300 (10.3) 499 (6.0) 462 (16.4) 537 (5.8) 285 (8.4) 367 (12.3) 489 (5.8) 501 (9.4) 516 (7.2) 509 (4.4) 498 (6.9) 500 (5.6) 391 (10.3) 420 (11.6) 526 (4.9) 495 (7.0) 520 (5.6) 219 (10.3) 512 (5.9) 527 (6.0) 397 (12.5) 457 (5.6) 567 (5.3) 528 (4.8) 343 (13.9) 488 (4.7) 500 (3.5) 528 (6.7) 526 (4.4) 528 (4.0) 170 (13.9) 528 (3.7) 565 (3.5) 568 (3.4) 551 (3.1) 457 (1.2)
Centerpoint of scale set at 10. ( ) Standard errors appear in parentheses. Because of rounding some results may appear inconsistent. A tilde (~) indicates insufficient data to report achievement. An “r” indicates data are available for at least 70% but less than 85% of the students.
380
Not Engaged
TIMSS 2011 INTERNATIONAL RESULTS IN SCIENCE CHAPTER 8
Average Scale Score 11.1 (0.07) 10.7 (0.05) 10.6 (0.05) 10.6 (0.07) 10.7 (0.07) 10.4 (0.03) 10.4 (0.07) 10.4 (0.05) 10.5 (0.06) 10.3 (0.04) 10.2 (0.03) 10.2 (0.06) 10.2 (0.07) 10.4 (0.04) 10.3 (0.05) 10.5 (0.05) 10.2 (0.04) 10.4 (0.07) 10.1 (0.06) 10.3 (0.05) 10.3 (0.07) 10.1 (0.07) 10.1 (0.05) 10.0 (0.05) 10.1 (0.05) 10.0 (0.05) 10.0 (0.07) 10.4 (0.04) 10.1 (0.06) 9.9 (0.05) 9.9 (0.05) 9.8 (0.05) 10.0 (0.08) 9.9 (0.05) 9.8 (0.04) 10.1 (0.06) 9.9 (0.04) 9.7 (0.04) 9.7 (0.06) 10.0 (0.06) 9.7 (0.04) 9.6 (0.04) 9.5 (0.05) 9.5 (0.05) 9.4 (0.06) 9.6 (0.09) 9.0 (0.05) 8.8 (0.04) 8.6 (0.04) 8.2 (0.06) --
SOURCE: IEA’s Trends in International Mathematics and Science Study – TIMSS 2011
Exhibit 8.17: Students Engaged in Science Lessons
Engaged Country
Somewhat Engaged
Not Engaged
Average Scale Score
Percent of Students
Average Achievement
Percent of Students
Average Achievement
Percent of Students
Average Achievement
38 (1.5) 37 (1.2) 37 (1.7)
447 (6.6) 436 (5.8) 372 (7.5)
59 (1.5) 52 (1.0) 55 (1.4)
424 (5.9) 341 (5.5) 337 (7.7)
3 (0.4) 11 (0.6) 8 (0.9)
439 (12.0) 273 (9.6) 305 (15.2)
9.9 (0.05) 9.7 (0.05) 9.8 (0.08)
56 (1.8) 55 (1.4) 53 (1.1) 51 (1.8) 51 (1.3) 48 (1.2) 48 (1.2)
556 (4.4) 551 (2.7) 489 (2.7) 440 (5.5) 559 (4.6) 538 (2.9) 525 (2.5)
38 (1.3) 40 (1.3) 42 (1.0) 42 (1.4) 42 (1.2) 44 (1.0) 44 (1.2)
519 (4.7) 533 (3.3) 444 (3.8) 389 (5.2) 534 (3.9) 521 (4.0) 508 (3.5)
5 (0.8) 5 (0.5) 5 (0.4) 7 (0.7) 8 (0.6) 7 (0.6) 8 (0.5)
518 (11.1) 518 (9.6) 401 (8.5) 367 (11.3) 526 (5.9) 508 (7.5) 507 (5.5)
10.5 (0.07) 10.4 (0.06) 10.4 (0.05) 10.4 (0.08) 10.2 (0.06) 10.0 (0.05) 10.0 (0.05)
Sixth Grade Participants Honduras Botswana Yemen Benchmarking Participants North Carolina, US Alberta, Canada Dubai, UAE Abu Dhabi, UAE Florida, US Ontario, Canada Quebec, Canada
How much do you agree with these statements about your science lessons? Agree a lot
Agree a little
Disagree a little
Disagree a lot
1) I know what my teacher expects me to do ---------- A
A
A
A
2) I think of things not related to the lesson* ----------- A
A
A
A
3) My teacher is easy to understand ---------------------- A
A
A
A
4) I am interested in what my teacher says ------------- A
A
A
A
5) My teacher gives me interesting things to do ------ A
A
A
A
* Reverse coded Engaged
Somewhat Engaged 10.1
Not Engaged 7.4
CLASSROOM INSTRUCTION CHAPTER 8
381
SOURCE: IEA’s Trends in International Mathematics and Science Study – TIMSS 2011
Exhibit 8.17: Students Engaged in Science Lessons (Continued)
Reported by Students The general/integrated science panel summarizes responses for countries where students are enrolled in science as a single subject. The remaining panels for biology, chemistry, physics, and earth science summarize responses for countries where students are taught science as separate subjects. For general/integrated science, students were scored according to their degree of agreement with five statements on the Engaged in Science Lessons scale. Students Engaged in science lessons had a score on the scale of at least 11.2, which corresponds to their “agreeing a lot” with three of the five statements and “agreeing a little” with the other two, on average. Students who were Not Engaged had a score no higher than 8.4, which corresponds to their “disagreeing a little” with three of the five statements and “agreeing a little” with the other two, on average. All other students were Somewhat Engaged in science lessons. For biology, chemistry, physics, and earth science, a comparable procedure was used. Students Engaged in General/Integrated Science Lessons
General/Integrated Science Country Tunisia Jordan Palestinian Nat'l Auth. Iran, Islamic Rep. of Oman Ghana United Arab Emirates Saudi Arabia Turkey Bahrain Chile Qatar Israel United States Malaysia England Norway Australia New Zealand Thailand Singapore Italy Hong Kong SAR Chinese Taipei Japan Korea, Rep. of International Avg.
Engaged
Somewhat Engaged
Not Engaged
Average Scale Score
Percent of Students
Average Achievement
Percent of Students
Average Achievement
Percent of Students
Average Achievement
55 (0.9) 46 (1.0) 44 (1.4) 43 (1.1) 42 (0.9) 41 (1.3) 38 (0.9) 36 (1.3) 35 (1.1) 34 (0.7) 33 (1.1) 32 (1.4) 28 (1.1) 28 (0.8) 25 (1.2) 24 (1.1) 23 (1.3) 21 (1.2) 21 (1.2) 21 (1.0) 20 (0.7) 18 (0.9) 17 (1.0) 9 (0.6) 5 (0.5) 4 (0.3) 29 (0.2)
446 (2.6) 483 (3.3) 448 (3.3) 482 (4.7) 460 (3.0) 342 (5.3) 487 (2.6) 462 (4.1) 520 (4.5) 479 (2.8) 472 (2.6) 464 (4.6) 540 (4.3) 543 (3.4) 444 (5.9) 551 (5.4) 514 (4.2) 547 (6.2) 538 (5.7) 463 (4.4) 600 (6.0) 517 (3.6) 556 (4.6) 610 (4.6) 607 (7.3) 626 (5.4) 508 (0.9)
39 (0.7) 46 (0.9) 47 (1.3) 47 (0.8) 50 (0.7) 53 (1.1) 49 (0.6) 51 (1.1) 52 (1.1) 51 (0.8) 53 (0.8) 51 (1.1) 46 (1.0) 50 (0.7) 57 (1.0) 54 (0.9) 54 (1.3) 51 (1.2) 52 (0.9) 70 (1.0) 59 (0.7) 62 (0.8) 59 (1.0) 42 (1.1) 36 (1.5) 39 (1.2) 51 (0.2)
430 (3.0) 436 (4.1) 406 (4.1) 468 (4.0) 406 (3.5) 293 (5.7) 454 (2.7) 427 (3.9) 469 (3.3) 447 (2.5) 456 (2.8) 409 (4.3) 510 (4.6) 526 (2.5) 430 (6.3) 533 (5.6) 495 (3.2) 522 (5.0) 513 (4.6) 449 (4.0) 593 (4.4) 501 (2.9) 537 (3.7) 578 (2.5) 575 (2.7) 582 (2.4) 479 (0.8)
6 (0.5) 8 (0.5) 9 (0.7) 9 (0.6) 8 (0.4) 6 (0.5) 12 (0.6) 12 (1.0) 13 (0.7) 15 (0.8) 14 (0.8) 17 (1.1) 26 (1.3) 22 (0.7) 18 (1.2) 22 (1.3) 23 (1.5) 28 (1.4) 27 (1.6) 9 (0.6) 21 (0.9) 21 (1.0) 24 (1.3) 50 (1.5) 59 (1.7) 57 (1.3) 21 (0.2)
431 (6.0) 395 (8.7) 381 (9.1) 477 (7.2) 349 (7.1) 236 (12.0) 445 (4.5) 411 (8.4) 449 (6.1) 428 (7.7) 463 (4.9) 378 (7.1) 503 (5.0) 506 (4.0) 392 (9.9) 518 (5.9) 475 (3.4) 497 (5.9) 499 (6.2) 447 (7.6) 574 (5.4) 488 (3.3) 518 (4.7) 544 (2.9) 543 (2.6) 541 (2.2) 457 (1.3)
11.3 (0.04) 11.0 (0.04) 10.8 (0.06) 10.8 (0.05) 10.8 (0.04) 10.9 (0.05) 10.6 (0.04) 10.5 (0.06) 10.4 (0.05) 10.4 (0.04) 10.3 (0.05) 10.3 (0.07) 9.8 (0.07) 9.9 (0.04) 9.9 (0.06) 9.8 (0.06) 9.7 (0.07) 9.5 (0.07) 9.5 (0.07) 10.0 (0.04) 9.7 (0.04) 9.6 (0.04) 9.5 (0.06) 8.6 (0.06) 8.2 (0.07) 8.3 (0.05) ––
40 (1.2) 39 (1.1) 35 (1.0)
381 (5.2) 440 (2.8) 372 (3.5)
52 (1.0) 49 (0.9) 54 (0.7)
362 (3.8) 392 (4.3) 320 (3.8)
7 (0.5) 11 (0.7) 11 (0.6)
373 (6.4) 359 (8.9) 322 (8.2)
10.7 (0.05) 10.6 (0.05) 10.5 (0.04)
39 (1.2) 38 (1.5) 33 (1.8) 30 (1.7) 30 (2.0) 28 (1.4) 28 (2.1) 27 (2.0) 26 (1.8) 26 (2.2) 26 (1.1) 25 (1.2) 24 (1.3) 21 (0.9)
501 (2.9) 486 (4.5) 577 (7.1) 552 (5.4) 557 (6.0) 527 (4.8) 549 (7.3) 557 (8.2) 550 (5.8) 578 (4.7) 532 (4.1) 499 (8.1) 561 (3.5) 533 (3.8)
48 (0.8) 50 (1.1) 49 (1.4) 47 (1.6) 52 (1.9) 51 (1.3) 50 (1.2) 51 (1.4) 48 (1.7) 51 (1.3) 54 (1.1) 52 (2.1) 55 (1.2) 56 (1.0)
482 (3.3) 448 (4.3) 566 (5.6) 529 (5.7) 539 (5.1) 495 (5.0) 532 (7.2) 531 (7.7) 532 (5.4) 549 (5.0) 518 (3.0) 482 (5.8) 544 (2.5) 523 (2.5)
13 (1.0) 12 (0.9) 18 (1.9) 23 (2.1) 18 (1.8) 22 (1.4) 23 (2.3) 22 (1.8) 25 (2.2) 23 (1.9) 20 (1.2) 23 (2.0) 21 (1.4) 23 (1.4)
461 (6.2) 445 (7.6) 553 (6.4) 525 (9.0) 528 (6.9) 479 (6.4) 514 (7.8) 510 (8.2) 519 (6.3) 538 (6.0) 514 (3.4) 485 (8.0) 537 (3.6) 504 (4.4)
10.6 (0.06) 10.5 (0.07) 10.2 (0.10) 9.9 (0.11) 10.0 (0.09) 9.9 (0.07) 9.8 (0.12) 9.8 (0.10) 9.7 (0.11) 9.8 (0.11) 9.9 (0.06) 9.8 (0.07) 9.8 (0.07) 9.6 (0.06)
Ninth Grade Participants Honduras Botswana South Africa Benchmarking Participants Dubai, UAE Abu Dhabi, UAE Massachusetts, US Connecticut, US Colorado, US California, US North Carolina, US Florida, US Indiana, US Minnesota, US Ontario, Canada Alabama, US Alberta, Canada Quebec, Canada
Centerpoint of scale set at 10. ( ) Standard errors appear in parentheses. Because of rounding some results may appear inconsistent. A dash (–) indicates comparable data are not available. An “r” indicates data are available for at least 70% but less than 85% of the students.
382
TIMSS 2011 INTERNATIONAL RESULTS IN SCIENCE CHAPTER 8
SOURCE: IEA’s Trends in International Mathematics and Science Study – TIMSS 2011
Exhibit 8.18: Students Engaged in Science Lessons
SOURCE: IEA’s Trends in International Mathematics and Science Study – TIMSS 2011
Exhibit 8.18: Students Engaged in Science Lessons (Continued) How much do you agree with these statements about your lessons? Agree a lot
Agree a little
Disagree a little
Disagree a lot
1) I know what my teacher expects me to do ---------- A
A
A
A
2) I think of things not related to the lesson* ----------- A
A
A
A
3) My teacher is easy to understand ---------------------- A
A
A
A
4) I am interested in what my teacher says ------------- A
A
A
A
5) My teacher gives me interesting things to do ------ A
A
A
A
* Reverse coded Not Engaged
Somewhat Engaged
Engaged
For General/ Integrated Science
11.2
8.4
For Biology
10.9
8.0
For Chemistry
11.2
8.6
For Physics
11.1
8.5
For Earth Science
11.0
8.1
Separate Science Panels Students Engaged in Biology Lessons
Engaged
Biology Country Syrian Arab Republic Armenia Ukraine Georgia Morocco Macedonia, Rep. of Kazakhstan Lebanon Russian Federation Romania Hungary Lithuania Slovenia Indonesia Sweden Finland International Avg.
Somewhat Engaged
Not Engaged
Percent of Students
Average Achievement
Percent of Students
Average Achievement
Percent of Students
Average Achievement
52 (1.3) 52 (1.5) 49 (1.5) 49 (1.3) 46 (0.9) 46 (1.5) 35 (1.8) 34 (1.3) 34 (1.0) 32 (1.3) 28 (1.3) 22 (1.1) 16 (0.8) 15 (0.9) 12 (0.8) 10 (0.6) 33 (0.3)
444 (3.9) 454 (3.4) 512 (3.9) 449 (3.3) 396 (2.5) 430 (4.9) 510 (4.5) 430 (5.7) 549 (4.3) 482 (4.2) 530 (3.7) 518 (3.5) 549 (3.9) 402 (8.4) 533 (4.4) 577 (4.6) 485 (1.1)
42 (1.1) 41 (1.0) 44 (1.2) 44 (1.0) 48 (0.8) 44 (1.2) 59 (1.6) 52 (1.1) 52 (1.0) 50 (1.0) 52 (0.9) 53 (1.1) 56 (1.1) 78 (0.8) 62 (1.0) 55 (1.3) 52 (0.3)
413 (3.9) 423 (3.8) 493 (4.2) 411 (3.6) 365 (2.5) 397 (6.1) 482 (4.6) 397 (5.6) 538 (3.2) 461 (3.8) 517 (4.0) 513 (3.0) 541 (2.9) 406 (4.3) 516 (2.9) 559 (2.5) 465 (1.0)
6 (0.6) 7 (0.7) 7 (0.7) 6 (0.6) 6 (0.3) 11 (1.0) 6 (0.6) 14 (0.7) 14 (0.9) 17 (1.0) 20 (1.5) 25 (1.3) 28 (1.4) 7 (0.7) 26 (1.2) 35 (1.5) 15 (0.2)
402 (7.4) 445 (6.1) 492 (8.9) 382 (7.3) 358 (7.4) 418 (12.8) 487 (8.7) 383 (7.8) 545 (5.4) 457 (6.3) 529 (4.0) 517 (3.5) 545 (4.0) 415 (7.4) 499 (3.2) 541 (2.8) 463 (1.7)
CLASSROOM INSTRUCTION CHAPTER 8
383
Average Scale Score 11.0 (0.06) 10.9 (0.07) 10.7 (0.06) 10.8 (0.06) 10.7 (0.03) 10.5 (0.07) 10.3 (0.07) 10.1 (0.06) 10.0 (0.05) 9.9 (0.07) 9.6 (0.08) 9.3 (0.07) 9.0 (0.06) 9.5 (0.04) 8.9 (0.05) 8.7 (0.05) ––
Exhibit 8.18: Students Engaged in Science Lessons (Continued)
Engaged
Chemistry Country Morocco Syrian Arab Republic Armenia Ukraine Kazakhstan Macedonia, Rep. of Lebanon Russian Federation Romania Hungary Lithuania Slovenia Sweden Finland Indonesia Georgia International Avg.
r
Somewhat Engaged
Not Engaged
Percent of Students
Average Achievement
Percent of Students
Average Achievement
Percent of Students
42 (0.9) 41 (1.2) 39 (1.5) 38 (1.7) 33 (1.6) 33 (1.4) 32 (1.4) 28 (1.0) 22 (1.3) 21 (1.0) 21 (1.0) 17 (0.8) 11 (0.7) 9 (0.7) 8 (0.7) –– 26 (0.3)
397 (2.1) 447 (4.4) 461 (3.4) 519 (4.3) 515 (4.6) 444 (5.6) 435 (5.6) 563 (4.1) 500 (5.0) 541 (3.6) 535 (3.7) 571 (3.8) 541 (5.6) 591 (5.1) 391 (8.4) –– 497 (1.2)
50 (0.8) 48 (1.0) 43 (1.0) 45 (1.2) 57 (1.5) 48 (1.0) 54 (1.1) 49 (0.7) 47 (1.0) 46 (1.0) 47 (0.9) 54 (1.0) 58 (1.0) 45 (1.4) 76 (1.1) –– 51 (0.3)
365 (3.3) 417 (4.0) 427 (3.9) 493 (4.1) 482 (4.5) 396 (5.7) 396 (5.4) 537 (3.7) 459 (3.6) 514 (4.1) 511 (3.1) 544 (3.0) 516 (2.8) 564 (2.7) 399 (4.6) –– 468 (1.0)
9 (0.4) 11 (0.7) 18 (1.2) 17 (1.3) 9 (0.6) 19 (1.5) 15 (1.0) 23 (1.0) 32 (1.6) 33 (1.5) 32 (1.3) 28 (1.4) 30 (1.3) 46 (1.8) 16 (1.1) –– 23 (0.3)
369 (4.7) 412 (7.7) 431 (4.7) 489 (5.0) 472 (6.3) 410 (8.5) 386 (7.7) 531 (4.1) 456 (4.7) 527 (3.2) 508 (3.6) 527 (3.2) 497 (3.1) 537 (2.8) 408 (8.3) –– 464 (1.4)
Students Engaged in Physics Lessons
Engaged
Physics Country Armenia Morocco Syrian Arab Republic Georgia Ukraine Macedonia, Rep. of Russian Federation Kazakhstan Lebanon Hungary Romania Lithuania Sweden Slovenia Indonesia Finland International Avg.
Somewhat Engaged
Average Achievement
Percent of Students
Average Achievement
Percent of Students
48 (1.5) 41 (0.7) 41 (1.3) 40 (1.2) 39 (1.6) 35 (1.2) 33 (1.2) 31 (1.7) 29 (1.4) 24 (1.0) 19 (1.2) 18 (0.9) 11 (0.6) 10 (0.6) 10 (0.7) 8 (0.7) 27 (0.3)
463 (3.5) 397 (2.3) 449 (4.4) 455 (3.6) 522 (4.4) 446 (5.4) 564 (3.9) 515 (5.3) 436 (6.0) 546 (3.5) 496 (4.8) 532 (4.6) 543 (4.7) 578 (5.5) 407 (8.1) 598 (5.6) 497 (1.2)
41 (1.2) 50 (0.7) 47 (1.1) 47 (1.0) 46 (1.1) 48 (0.9) 50 (0.9) 57 (1.4) 54 (1.2) 49 (0.9) 47 (1.2) 46 (0.9) 59 (1.1) 49 (1.2) 77 (0.8) 42 (1.4) 51 (0.3)
422 (3.8) 369 (3.1) 416 (3.8) 411 (3.5) 493 (3.6) 396 (5.8) 537 (3.5) 482 (4.4) 398 (5.7) 519 (3.7) 463 (4.2) 512 (3.1) 517 (3.0) 546 (3.4) 409 (5.1) 564 (2.8) 466 (1.0)
10 (0.7) 9 (0.3) 12 (0.6) 13 (0.9) 15 (1.0) 17 (0.9) 18 (1.0) 11 (0.9) 18 (1.2) 28 (1.2) 34 (1.4) 35 (1.3) 30 (1.2) 41 (1.4) 14 (1.0) 50 (1.7) 22 (0.3)
Percent of Students
Average Achievement
Percent of Students
Average Achievement
Percent of Students
Average Achievement
50 (1.4) 44 (1.5) 44 (1.4) 43 (1.3) 43 (0.7) 40 (1.6) 34 (1.5) 33 (1.4) 29 (1.0) 26 (1.3) 24 (1.4) 18 (0.9) 16 (0.9) 11 (0.7) 10 (0.8) –– 31 (0.3)
455 (3.3) 453 (3.4) 437 (5.2) 445 (4.4) 393 (2.0) 512 (4.5) 511 (4.6) 486 (4.3) 551 (4.0) 526 (3.7) 526 (4.6) 529 (4.9) 553 (4.6) 576 (5.1) 398 (8.1) –– 490 (1.2)
41 (1.1) 47 (1.1) 46 (1.0) 47 (1.0) 49 (0.7) 49 (1.2) 58 (1.3) 49 (1.0) 52 (0.8) 49 (1.0) 49 (0.9) 62 (1.0) 56 (1.3) 55 (1.2) 77 (0.8) –– 52 (0.3)
424 (4.2) 411 (3.1) 393 (5.4) 416 (4.3) 367 (2.8) 497 (3.7) 481 (4.7) 461 (4.3) 540 (3.4) 510 (3.3) 517 (3.7) 513 (3.0) 542 (3.1) 560 (2.5) 405 (4.6) –– 469 (1.0)
9 (0.7) 8 (0.9) 11 (1.0) 10 (0.8) 8 (0.3) 11 (1.0) 8 (0.7) 19 (1.1) 19 (1.1) 25 (1.3) 28 (1.5) 20 (1.0) 28 (1.6) 34 (1.5) 14 (1.0) –– 17 (0.3)
436 (7.5) 396 (6.8) 407 (12.8) 402 (7.0) 372 (5.9) 491 (6.7) 493 (7.7) 449 (5.5) 539 (4.4) 514 (3.3) 533 (3.7) 498 (3.6) 540 (3.5) 536 (2.8) 410 (6.4) –– 468 (1.6)
415 (6.5) 368 (4.6) 418 (7.1) 406 (6.2) 481 (5.5) 398 (9.2) 521 (4.2) 483 (6.9) 389 (7.1) 514 (4.2) 458 (4.4) 511 (2.9) 502 (2.9) 532 (3.2) 416 (6.0) 540 (2.8) 459 (1.4)
Country Armenia Georgia Macedonia, Rep. of Syrian Arab Republic Morocco Ukraine Kazakhstan Romania Russian Federation Lithuania Hungary Sweden Slovenia Finland Indonesia Lebanon International Avg. 384
Somewhat Engaged
TIMSS 2011 INTERNATIONAL RESULTS IN SCIENCE CHAPTER 8
10.9 (0.03) 10.8 (0.05) 10.5 (0.08) 10.5 (0.08) 10.6 (0.06) 10.3 (0.08) 10.5 (0.06) 10.0 (0.05) 9.6 (0.08) 9.5 (0.07) 9.5 (0.06) 9.5 (0.06) 9.3 (0.05) 8.8 (0.07) 9.5 (0.03) ––
–
Average Scale Score
Average Achievement
Students Engaged in Earth Science Lessons
Engaged
–
Not Engaged
Percent of Students
Earth Science
Average Scale Score
Average Achievement
–
Not Engaged
11.0 (0.06) 10.8 (0.03) 10.8 (0.05) 10.7 (0.06) 10.5 (0.08) 10.4 (0.06) 10.3 (0.06) 10.4 (0.07) 10.2 (0.07) 9.7 (0.06) 9.4 (0.07) 9.3 (0.06) 9.3 (0.04) 8.9 (0.05) 9.6 (0.04) 8.6 (0.07)
–
Average Scale Score
–
10.9 (0.06) 10.7 (0.06) 10.6 (0.07) 10.7 (0.05) 10.7 (0.03) 10.4 (0.07) 10.4 (0.07) 10.1 (0.08) 9.9 (0.06) 9.6 (0.08) 9.4 (0.08) 9.4 (0.05) 9.1 (0.07) 8.8 (0.05) 9.3 (0.04) ––
–
SOURCE: IEA’s Trends in International Mathematics and Science Study – TIMSS 2011
Students Engaged in Chemistry Lessons
Students Ready to Learn Instruction Limited by Students Lacking Prerequisite Knowledge or Skills The characteristics of the students themselves can be very important to the classroom atmosphere. To begin, students need the prerequisite science skills before they can make gains in achievement. Because prior knowledge guides learning, effective science teachers assess students’ knowledge, skills, and conceptual understanding, and link new ideas, skills, and competencies to prior understandings. Lack of prerequisite knowledge and skills are psychological barriers to further science learning, because it is well known that students’ new learning depends on that prior knowledge: “Every new thing that a person learns must be attached to what the person already knows” (McLaughlin et al., 2005, p. 5). Exhibit 8.19 presents teachers’ reports at the fourth grade about whether their science instruction was limited by students lacking prerequisite knowledge or skills. On average, internationally, 28 percent of the fourth grade students were in classes where students had the necessary prerequisite skills for science instruction to proceed according to teachers’ plans, and 60 percent were in classes where instruction was limited to some extent. It is consistent with teachers’ reports that the students in classes where instruction was progressing unimpeded had higher average science achievement than did their counterparts in classes where instruction was limited to some extent (501 vs. 485). Also consistent with teachers’ reports, average science achievement was substantially lower (460) for the fourth grade students in classrooms where instruction was limited “a lot” because students lacked the prerequisite knowledge or skills. This overall pattern also was evidenced at the sixth grade and for the benchmarking participants. Exhibit 8.20 presents teachers’ reports at the eighth grade about whether their science instruction was limited by students lacking prerequisite knowledge or skills. On average, internationally, just 20 percent of the eighth grade students were in classes where students had the necessary prerequisite skills for science instruction to proceed according to teachers’ plans. According to their teachers, 61 percent were in classes where instruction was limited to some extent and 19 percent in classes where instruction was limited “a lot.” As students progress through school, the curriculum becomes increasingly advanced and, not surprisingly, greater percentages of students fall behind, which typically results in some differentiation in instruction for different groups of students. Especially, taking into account some type of tailored curriculum and instruction
CLASSROOM INSTRUCTION CHAPTER 8
385
8.19:Limited Instruction Limited by Students Lacking Prerequisite Exhibit 8.19:Exhibit Instruction by Students Lacking Prerequisite Knowledge or Skills Knowledge or Skills Students in Classrooms Where Teachers Report Instruction Is Limited by Students Lacking Prerequisite Knowledge or Skills Country
Not At All
Kazakhstan Japan Norway Russian Federation Slovak Republic Denmark Finland Belgium (Flemish) Georgia Sweden Chinese Taipei Ireland Azerbaijan Hong Kong SAR Croatia Slovenia Netherlands Australia Czech Republic Austria Korea, Rep. of Singapore Spain Romania Qatar Hungary Bahrain England Armenia Italy Northern Ireland Serbia Portugal Malta New Zealand United Arab Emirates Oman Germany Poland Saudi Arabia Kuwait United States Lithuania Iran, Islamic Rep. of Chile Yemen Thailand Tunisia Morocco Turkey International Avg.
r
r r
r
r
Some
Percent of Students
Average Achievement
Percent of Students
Average Achievement
Percent of Students
Average Achievement
64 (3.6) 53 (4.1) 46 (5.1) 44 (3.7) 42 (3.4) 41 (3.5) 41 (3.5) 41 (3.3) 39 (3.7) 39 (4.6) 38 (4.2) 37 (3.7) 36 (3.8) 35 (4.7) 35 (3.2) 32 (4.0) 32 (4.1) 31 (3.5) 31 (3.7) 30 (3.0) 29 (4.0) 28 (2.6) 28 (3.7) 28 (3.5) 28 (5.0) 28 (3.2) 26 (4.8) 26 (3.4) 26 (3.3) 25 (3.1) 25 (3.6) 24 (3.4) 24 (3.5) 24 (0.1) 23 (3.2) 23 (2.1) 23 (2.1) 22 (3.0) 20 (2.9) 18 (3.0) 17 (3.2) 16 (2.0) 16 (2.0) 16 (2.6) 15 (3.1) 14 (3.3) 12 (2.3) 11 (2.0) 7 (1.7) 6 (1.7) 28 (0.5)
497 (6.0) 561 (2.6) 496 (3.0) 555 (4.8) 550 (3.2) 540 (3.1) 577 (2.6) 515 (2.8) 461 (5.9) 544 (5.0) 558 (3.6) 534 (4.0) 460 (10.0) 547 (6.0) 517 (3.1) 534 (4.0) 543 (4.0) 542 (6.7) 546 (3.8) 546 (3.3) 587 (4.0) 620 (5.3) 517 (4.8) 533 (8.8) 414 (11.2) 557 (6.6) 458 (8.9) 560 (5.8) 422 (7.0) 519 (5.5) 530 (7.1) 528 (4.6) 535 (6.9) 451 (2.5) 515 (4.8) 456 (7.1) 384 (7.0) 546 (4.8) 510 (6.5) 452 (11.5) 370 (11.9) 566 (5.1) 529 (5.9) 495 (8.8) 500 (9.2) 215 (14.4) 520 (13.9) 358 (13.6) 282 (18.2) 502 (12.0) 501 (1.1)
30 (3.6) 44 (4.1) 53 (5.1) 44 (3.2) 52 (3.3) 55 (3.5) 57 (3.4) 50 (3.4) 59 (3.7) 54 (4.6) 58 (4.4) 55 (4.0) 62 (3.9) 58 (4.9) 61 (3.4) 57 (3.7) 62 (4.3) 59 (4.4) 65 (3.4) 55 (2.6) 56 (4.3) 60 (3.2) 62 (3.7) 67 (3.5) 62 (4.9) 63 (3.5) 66 (4.9) 62 (4.2) 70 (3.4) 54 (3.6) 69 (3.8) 70 (3.6) 65 (3.9) 66 (0.1) 65 (3.1) 66 (2.6) 52 (2.6) 68 (3.2) 71 (3.4) 64 (3.5) 72 (4.0) 65 (2.6) 74 (2.7) 64 (3.7) 65 (3.9) 68 (4.2) 70 (3.8) 58 (3.8) 55 (3.8) 60 (3.5) 60 (0.5)
484 (10.4) 556 (2.7) 493 (3.6) 553 (5.3) 522 (5.5) 524 (3.4) 565 (3.4) 507 (2.8) 452 (5.4) 532 (4.2) 550 (2.8) 512 (4.7) 431 (6.9) 536 (3.3) 516 (2.6) 516 (3.5) 526 (3.2) 513 (4.1) 535 (3.1) 532 (3.2) 588 (2.4) 580 (4.1) 507 (3.1) 499 (7.1) 388 (7.6) 531 (5.0) 448 (4.5) 525 (4.6) 414 (4.5) 527 (4.5) 514 (3.4) 514 (3.9) 520 (4.7) 448 (2.2) 497 (2.7) 426 (3.6) 381 (5.5) 529 (3.1) 505 (2.6) 430 (7.4) 346 (5.9) 548 (2.5) 513 (2.8) 453 (5.2) 481 (4.1) 207 (8.7) 472 (5.8) 353 (7.6) 270 (6.8) 474 (6.1) 485 (0.7)
5 (1.8) 3 (1.3) 1 (0.6) 12 (2.6) 6 (1.2) 4 (1.2) 2 (0.6) 8 (1.8) 2 (1.0) 7 (1.7) 4 (1.4) 8 (1.9) 2 (1.0) 7 (2.4) 4 (1.6) 11 (2.3) 6 (2.3) 10 (2.4) 4 (1.4) 14 (2.6) 14 (3.0) 12 (1.7) 10 (2.2) 5 (1.4) 11 (2.1) 9 (2.1) 8 (2.0) 13 (3.0) 4 (1.7) 21 (3.2) 6 (2.1) 6 (2.5) 10 (2.1) 10 (0.1) 12 (1.6) 12 (1.5) 25 (2.7) 11 (2.1) 10 (2.0) 17 (3.4) 12 (2.7) 19 (2.0) 10 (2.1) 20 (2.9) 20 (3.2) 18 (3.2) 18 (3.4) 31 (3.7) 38 (4.3) 34 (3.4) 11 (0.3)
540 (14.4) 551 (2.1) ~~ 538 (6.8) 492 (17.5) 499 (26.8) ~~ 486 (8.8) ~~ 508 (10.1) 510 (7.9) 463 (7.5) ~~ 458 (35.4) 511 (9.9) 501 (3.9) 508 (9.2) 482 (7.8) 490 (25.3) 497 (5.1) 577 (4.6) 509 (9.9) 468 (9.5) 417 (46.6) 380 (15.1) 483 (13.4) 437 (10.6) 493 (9.2) 412 (21.0) 528 (5.1) 500 (9.6) 491 (13.3) 503 (8.4) 429 (4.6) 464 (8.5) 407 (7.3) 366 (6.9) 488 (9.9) 490 (7.8) 397 (13.5) 328 (12.9) 517 (4.8) 500 (5.8) 419 (10.4) 467 (9.2) 201 (17.0) 443 (15.6) 330 (9.1) 252 (9.9) 436 (7.4) 460 (2.1)
( ) Standard errors appear in parentheses. Because of rounding some results may appear inconsistent. A tilde (~) indicates insufficient data to report achievement. An “r” indicates data are available for at least 70% but less than 85% of the students.
386
A Lot
TIMSS 2011 INTERNATIONAL RESULTS IN SCIENCE CHAPTER 8
SOURCE: IEA’s Trends in International Mathematics and Science Study – TIMSS 2011
Reported by Teachers
Students in Classrooms Where Teachers Report Instruction Is Limited by Students Lacking Prerequisite Knowledge or Skills Country
Not At All
Some
A Lot
Percent of Students
Average Achievement
Percent of Students
Average Achievement
Percent of Students
Average Achievement
20 (3.7) 16 (3.3) 8 (2.4)
456 (17.9) 348 (15.7) 456 (31.5)
68 (4.1) 67 (4.6) 57 (4.2)
422 (6.9) 348 (8.1) 387 (7.7)
12 (2.8) 17 (3.6) 35 (3.8)
444 (12.6) 325 (18.0) 328 (8.7)
38 (3.4) 29 (4.3) 21 (4.2) 19 (2.7) 17 (3.4) 11 (3.2) 7 (2.4)
493 (7.2) 530 (4.7) 547 (7.4) 542 (6.3) 435 (16.3) 581 (14.6) 556 (19.7)
54 (3.5) 57 (4.8) 65 (4.8) 64 (3.6) 69 (4.3) 62 (5.8) 61 (5.0)
456 (6.6) 513 (3.4) 544 (3.1) 530 (3.5) 410 (6.1) 546 (4.7) 541 (4.8)
7 (0.9) 13 (2.8) 14 (3.1) 18 (3.0) 14 (3.2) 27 (5.4) 32 (4.9)
423 (13.6) 502 (4.8) 522 (9.4) 506 (5.7) 406 (14.1) 520 (7.2) 526 (7.8)
Sixth Grade Participants Honduras Yemen Botswana Benchmarking Participants Dubai, UAE Quebec, Canada Alberta, Canada Ontario, Canada Abu Dhabi, UAE Florida, US North Carolina, US
r r s
CLASSROOM INSTRUCTION CHAPTER 8
387
SOURCE: IEA’s Trends in International Mathematics and Science Study – TIMSS 2011
Exhibit 8.19: Instruction Limited by Students Lacking Prerequisite Knowledge or Skills (Continued)
8.20:Limited Instruction Limited by Students Lacking Prerequisite Exhibit 8.20:Exhibit Instruction by Students Lacking Prerequisite Knowledge or Skills Knowledge or Skills Students in Classrooms Where Teachers Report Instruction Is Limited by Students Lacking Prerequisite Knowledge or Skills Country
Not At All
Kazakhstan Japan Russian Federation Sweden Australia Korea, Rep. of England Macedonia, Rep. of Malaysia Finland New Zealand Singapore United Arab Emirates Israel Hong Kong SAR Norway Slovenia Hungary Lebanon Ukraine Romania Qatar Bahrain Chile Armenia Italy United States Chinese Taipei Lithuania Indonesia Morocco Saudi Arabia Oman Thailand Tunisia Syrian Arab Republic Palestinian Nat'l Auth. Iran, Islamic Rep. of Georgia Jordan Ghana Turkey International Avg.
r s r
s
Some
A Lot
Percent of Students
Average Achievement
Percent of Students
Average Achievement
Percent of Students
Average Achievement
54 (2.6) 44 (4.5) 41 (2.3) 33 (3.4) 32 (3.7) 31 (3.6) 29 (3.2) 29 (2.4) 27 (3.8) 27 (2.6) 27 (2.9) 26 (2.3) 23 (2.1) 21 (2.7) 21 (3.5) 21 (3.7) 19 (1.6) 19 (2.0) 18 (2.6) 18 (2.3) 18 (1.8) 18 (2.1) 18 (2.6) 17 (2.8) 16 (2.1) 15 (2.9) 15 (2.1) 15 (2.9) 14 (1.4) 13 (3.6) 13 (1.7) 13 (2.9) 12 (1.6) 11 (2.4) 10 (2.5) 10 (2.2) 9 (2.5) 9 (2.1) 8 (1.1) 6 (1.7) 5 (1.6) 3 (1.3) 20 (0.4)
496 (5.5) 571 (3.1) 560 (3.8) 529 (3.4) 560 (9.7) 558 (3.8) 562 (8.0) 390 (8.3) 473 (10.2) 569 (3.5) 547 (6.8) 624 (8.7) 479 (6.5) 548 (9.7) 558 (7.6) 501 (4.4) 549 (3.4) 543 (5.6) 421 (12.2) 513 (6.1) 477 (6.8) 451 (13.0) 476 (10.1) 482 (8.3) 453 (8.2) 520 (6.9) 556 (9.3) 585 (7.6) 531 (5.0) 402 (19.7) 397 (6.0) 440 (11.7) 438 (10.1) 475 (16.2) 454 (12.5) 441 (10.7) 465 (12.9) 512 (16.9) 444 (5.9) 448 (17.9) 302 (24.2) 551 (54.4) 496 (2.0)
40 (2.7) 51 (4.6) 44 (2.7) 59 (3.6) 58 (3.5) 54 (3.9) 62 (3.2) 60 (2.3) 55 (4.1) 63 (2.6) 55 (2.9) 66 (2.6) 64 (2.6) 53 (3.8) 70 (4.4) 72 (4.0) 67 (1.9) 68 (2.1) 65 (3.3) 47 (2.9) 68 (2.1) 62 (4.5) 64 (2.6) 57 (4.4) 77 (2.0) 59 (3.6) 67 (2.7) 64 (4.0) 68 (1.7) 67 (4.1) 41 (2.4) 65 (3.7) 59 (3.4) 71 (3.5) 64 (3.4) 64 (3.4) 52 (4.0) 60 (3.5) 74 (2.4) 55 (4.0) 78 (3.4) 51 (3.5) 61 (0.5)
482 (5.6) 548 (3.3) 535 (4.0) 506 (3.3) 516 (5.9) 561 (2.7) 526 (6.4) 424 (6.1) 432 (6.3) 550 (2.3) 504 (5.3) 584 (4.8) 459 (3.1) 523 (4.8) 532 (4.5) 492 (3.2) 543 (2.9) 526 (2.9) 408 (6.0) 506 (4.5) 465 (3.6) 420 (8.0) 454 (2.8) 463 (4.2) 437 (3.6) 505 (3.0) 532 (4.0) 565 (3.5) 516 (2.5) 403 (4.8) 382 (2.9) 438 (4.5) 419 (5.1) 454 (4.8) 439 (3.0) 427 (4.4) 423 (4.9) 477 (4.6) 418 (3.3) 459 (4.8) 313 (6.4) 498 (4.9) 478 (0.7)
6 (1.4) 6 (2.1) 15 (1.4) 7 (1.9) 10 (2.0) 15 (2.9) 9 (1.7) 11 (1.6) 18 (3.1) 10 (1.7) 19 (2.4) 7 (1.3) 13 (1.8) 25 (3.3) 9 (2.6) 8 (2.1) 14 (1.5) 12 (1.6) 17 (2.5) 34 (2.9) 14 (1.6) 20 (3.9) 18 (2.6) 26 (3.8) 7 (1.6) 26 (3.5) 18 (2.0) 21 (3.4) 18 (1.5) 20 (3.2) 46 (2.1) 22 (3.6) 30 (3.2) 19 (2.9) 25 (3.4) 26 (3.4) 39 (4.3) 31 (3.5) 18 (2.3) 39 (3.8) 17 (3.0) 46 (3.3) 19 (0.4)
503 (12.1) 541 (6.0) 519 (6.0) 470 (10.3) 481 (14.4) 562 (4.8) 482 (18.8) 380 (14.4) 336 (13.3) 522 (6.6) 480 (11.9) 533 (20.1) 447 (9.4) 482 (9.0) 505 (19.1) 485 (12.3) 534 (5.3) 474 (7.1) 379 (11.3) 489 (5.0) 445 (7.6) 384 (15.3) 428 (8.4) 443 (5.4) 419 (8.4) 483 (6.9) 500 (6.7) 543 (4.6) 497 (5.1) 414 (6.7) 367 (3.5) 430 (8.1) 413 (7.6) 427 (8.8) 431 (4.3) 417 (8.5) 407 (5.8) 458 (6.5) 418 (5.3) 435 (7.6) 279 (9.2) 462 (4.6) 455 (1.5)
( ) Standard errors appear in parentheses. Because of rounding some results may appear inconsistent. A tilde (~) indicates insufficient data to report achievement. An “r” indicates data are available for at least 70% but less than 85% of the students. An “s” indicates data are available for at least 50% but less than 70% of the students. An “x” indicates data are available for less than 50% of students.
388
TIMSS 2011 INTERNATIONAL RESULTS IN SCIENCE CHAPTER 8
SOURCE: IEA’s Trends in International Mathematics and Science Study – TIMSS 2011
Reported by Teachers
Students in Classrooms Where Teachers Report Instruction Is Limited by Students Lacking Prerequisite Knowledge or Skills Country
Not At All
Some
A Lot
Percent of Students
Average Achievement
Percent of Students
Average Achievement
Percent of Students
Average Achievement
20 (3.7) 15 (3.2) 9 (2.4)
379 (10.3) 438 (10.5) 340 (21.0)
51 (4.6) 42 (4.3) 59 (3.9)
366 (4.9) 408 (5.9) 334 (5.8)
29 (4.5) 43 (4.4) 33 (3.9)
369 (10.5) 388 (4.9) 317 (6.8)
29 (3.7) 26 (2.7) 23 (3.2) 22 (5.0) 22 (3.6) 22 (6.3) 20 (3.6) 17 (5.3) 17 (4.9) 16 (5.9) 15 (3.8) 13 (3.4) 2 (1.7) xx
539 (5.7) 511 (7.5) 536 (5.5) 568 (11.8) 562 (5.5) 599 (14.0) 478 (12.2) 498 (15.9) 552 (12.4) 542 (12.3) 563 (13.6) 553 (19.5) ~~ xx
53 (4.1) 62 (4.5) 64 (3.8) 64 (4.6) 67 (3.9) 67 (7.3) 64 (4.0) 65 (6.5) 69 (6.2) 69 (6.9) 55 (6.4) 68 (4.6) 68 (7.8) xx
514 (4.1) 470 (5.2) 519 (3.4) 556 (6.0) 543 (2.7) 563 (10.1) 461 (4.9) 482 (10.0) 554 (6.7) 536 (6.6) 548 (8.5) 507 (8.4) 545 (12.4) xx
18 (3.4) 12 (3.9) 13 (2.5) 14 (3.8) 11 (2.7) 11 (4.6) 15 (2.9) 18 (6.2) 13 (4.0) 15 (3.8) 30 (6.6) 19 (3.5) 30 (7.5) xx
511 (7.8) 467 (15.1) 500 (7.3) 518 (27.8) 533 (6.7) 510 (31.8) 438 (9.8) 481 (13.1) 492 (14.3) 495 (12.3) 498 (15.5) 468 (16.7) 491 (15.7) xx
Ninth Grade Participants Honduras Botswana South Africa Benchmarking Participants Quebec, Canada Dubai, UAE Ontario, Canada Minnesota, US Alberta, Canada Massachusetts, US Abu Dhabi, UAE Alabama, US Colorado, US Indiana, US Connecticut, US California, US North Carolina, US Florida, US
r r s s s s s s s
CLASSROOM INSTRUCTION CHAPTER 8
389
SOURCE: IEA’s Trends in International Mathematics and Science Study – TIMSS 2011
Exhibit 8.20: Instruction Limited by Students Lacking Prerequisite Knowledge or Skills (Continued)
for groups of students, it is distressing that, according to their teachers, relatively few students at the eighth grade are receiving the full instructional benefit that could be provided. Eighth grade students in classes where instruction was not limited had higher average science achievement than did their counterparts in classes where instruction was limited to some extent (496 vs. 478). Also consistent with teachers’ reports, average science achievement was substantially lower (455) for eighth grade students in classrooms where instruction was limited “a lot” because students lacked the prerequisite knowledge or skills. This pattern also was evidenced at the ninth grade and for the benchmarking participants. Instruction Limited by Students Suffering from Lack of Nutrition or Sleep The importance of a healthy breakfast is widely advertised, including the benefit of doing better in school. Unfortunately, some children in many countries around the world suffer from hunger, and a growing body of research, mostly in developing countries, is providing evidence that malnutrition has a negative impact on educational achievement. Similarly, a number of studies in a variety of countries have shown sleep duration and quality to be related to academic functioning at school. For example, a Dutch researcher found that chronic sleep reduction can affect school achievement directly and indirectly via motivation and engagement (Meijer, 2008). Exhibit 8.21 presents teachers’ reports at the fourth grade about the degree to which their science instruction was limited by students’ lack of nutrition or not having enough sleep. On average, internationally, 71 percent of the fourth grade students were in classrooms where instruction was “not at all” limited because students were lacking in basic nutrition. These fourth grade students had higher average science achievement than their peers in classrooms where instruction was limited “some” or “a lot” due to lack of basic nutrition (493 vs. 467). It is of considerable concern that 29 percent of the fourth grade students, on average, were reported to be suffering from lack of basic nutrition; and this percentage is much higher in some countries, including those that participated at the sixth grade. Teachers reported that 54 percent of the fourth grade students, on average, were in classrooms where instruction was “not at all” limited by students suffering from not enough sleep. However, it is unfortunate that 46 percent,
390
TIMSS 2011 INTERNATIONAL RESULTS IN SCIENCE CHAPTER 8
on average, were in classrooms where instruction was limited “some” or “a lot” by students suffering from lack of sleep. The achievement gap for sleep deprivation was somewhat less than that related to lack of nutrition, but the fourth grade students suffering from some amount of sleep deprivation did have lower average science achievement than their more alert counterparts (by 11 points on average). Again, there was considerable variation across countries in teachers’ reports about the percentages of fourth grade students suffering from not enough sleep. According to their teachers, in a number of TIMSS 2011 countries and benchmarking participants, the majority of students were at least somewhat sleep deprived. Exhibit 8.22 presents the eighth grade teachers’ reports about the degree to which their instruction was limited by students’ lack of nutrition or not having enough sleep. On average, internationally, 64 percent of the eighth grade students were in classrooms where instruction was “not at all” limited because students were lacking in basic nutrition. These eighth grade students had higher average science achievement than their peers in classrooms where instruction was limited “some” or “a lot” due to lack of basic nutrition (485 vs. 461). More than one-third (36%) of the eighth grade students, on average, were reported to be suffering from lack of basic nutrition; and this percentage was much higher in some countries, including those that participated at the ninth grade. Teachers reported that 42 percent of the eighth grade students, on average, were in classrooms where instruction was “not at all” limited by students suffering from not enough sleep. However, again, it is a matter of considerable concern that the majority of eighth grade students (58%), on average, were in classrooms where instruction was limited “some” or “a lot” by students suffering from lack of sleep. Similar to the results at fourth grade, the achievement gap for sleep deprivation was somewhat less than that related to lack of nutrition, but the eighth grade students suffering from some amount of sleep deprivation did have lower average science achievement than their counterparts (by 11 points). Again, there was considerable variation across countries in teachers’ reports about the percentages of eighth grade students suffering from not enough sleep. According to their teachers, however, in a number of TIMSS 2011 countries and benchmarking participants, as much as two-thirds of students were at least somewhat sleep deprived.
CLASSROOM INSTRUCTION CHAPTER 8
391
Exhibit 8.21: Instruction Limited by Students Suffering from Lack of Nutrition or Sleep Students in Classrooms Where Teachers Report Instruction Is Limited by Students Suffering from Lack of Basic Nutrition Country
Not At All
Armenia Australia Austria Azerbaijan Bahrain Belgium (Flemish) Chile Chinese Taipei Croatia Czech Republic Denmark England Finland Georgia Germany Hong Kong SAR Hungary Iran, Islamic Rep. of Ireland Italy Japan Kazakhstan Korea, Rep. of Kuwait Lithuania Malta Morocco Netherlands New Zealand Northern Ireland Norway Oman Poland Portugal Qatar Romania Russian Federation Saudi Arabia Serbia Singapore Slovak Republic Slovenia Spain Sweden Thailand Tunisia Turkey United Arab Emirates United States Yemen International Avg.
r
r r
r
r
Students in Classrooms Where Teachers Report Instruction Is Limited by Students Suffering from Not Enough Sleep
Some or A Lot
Percent of Students
Average Achievement
Percent of Students
Average Achievement
33 (3.9) 73 (3.0) –– 60 (3.5) 61 (4.5) 95 (1.5) 58 (3.5) 76 (3.8) 83 (2.8) 99 (0.9) 83 (2.8) 79 (3.0) 91 (2.2) 46 (4.1) 85 (2.7) 89 (2.4) 72 (2.9) 30 (3.6) 79 (3.0) 72 (3.5) 99 (0.6) 81 (3.2) 82 (3.4) 64 (4.1) 82 (3.0) 89 (0.1) 21 (3.0) 91 (2.6) 63 (2.7) 80 (3.1) 74 (4.5) 46 (3.0) 88 (2.2) 86 (2.8) 60 (3.2) 50 (3.6) 82 (2.5) 47 (4.1) 84 (2.8) 84 (1.8) 97 (0.9) 88 (2.0) 89 (2.3) 97 (1.2) 70 (4.1) 49 (4.0) 26 (2.8) 67 (2.3) 61 (2.2) 13 (3.2) 71 (0.4)
427 (7.0) 531 (3.4) –– 448 (7.8) 452 (5.6) 511 (2.1) 496 (3.7) 556 (2.6) 517 (2.2) 536 (2.5) 533 (3.1) 537 (4.4) 572 (2.5) 469 (4.6) 533 (2.9) 537 (4.4) 542 (3.9) 483 (6.9) 522 (3.9) 526 (3.1) 559 (1.9) 495 (6.0) 588 (2.3) 354 (6.4) 516 (3.0) 449 (1.9) 292 (12.7) 532 (2.7) 516 (2.6) 524 (3.4) 497 (2.7) 392 (6.3) 505 (2.8) 523 (4.1) 415 (7.5) 528 (6.6) 557 (3.7) 438 (7.1) 516 (3.1) 591 (3.4) 533 (3.8) 522 (2.8) 508 (3.0) 535 (3.3) 483 (5.8) 359 (7.4) 483 (9.1) 441 (3.8) 554 (2.5) 212 (21.4) 493 (0.8)
67 (3.9) 27 (3.0) –– 40 (3.5) 39 (4.5) 5 (1.5) 42 (3.5) 24 (3.8) 17 (2.8) 1 (0.9) 17 (2.8) 21 (3.0) 9 (2.2) 54 (4.1) 15 (2.7) 11 (2.4) 28 (2.9) 70 (3.6) 21 (3.0) 28 (3.5) 1 (0.0) 19 (3.2) 18 (3.4) 36 (4.1) 18 (3.0) 11 (0.1) 79 (3.0) 9 (2.6) 37 (2.7) 20 (3.1) 26 (4.5) 54 (3.0) 12 (2.2) 14 (2.8) 40 (3.2) 50 (3.6) 18 (2.5) 53 (4.1) 16 (2.8) 16 (1.8) 3 (0.9) 12 (2.0) 11 (2.3) 3 (1.2) 30 (4.1) 51 (4.0) 74 (2.8) 33 (2.3) 39 (2.2) 87 (3.2) 29 (0.4)
412 (4.7) 488 (6.6) –– 431 (8.6) 446 (5.4) 474 (8.7) 460 (5.1) 537 (4.8) 512 (6.3) ~~ 520 (6.1) 505 (5.0) 550 (6.6) 444 (5.8) 503 (7.0) 517 (8.0) 510 (7.9) 440 (4.7) 495 (6.8) 528 (6.0) ~~ 496 (12.4) 580 (2.9) 337 (8.2) 504 (5.8) 426 (3.7) 255 (6.0) 512 (8.3) 468 (4.0) 489 (5.7) 488 (4.7) 366 (4.8) 500 (5.2) 517 (10.4) 363 (9.9) 481 (9.2) 527 (5.9) 422 (8.6) 519 (8.8) 538 (9.3) 499 (21.3) 505 (5.8) 490 (7.0) 518 (15.9) 449 (11.1) 333 (6.6) 455 (5.4) 409 (4.8) 531 (3.2) 206 (8.2) 467 (1.1)
Not At All
r
r r
r
r
Some or A Lot
Percent of Students
Average Achievement
Percent of Students
Average Achievement
52 (4.6) 36 (3.7) 42 (3.4) 82 (2.9) 47 (4.9) 62 (3.6) 37 (4.3) 63 (4.1) 44 (3.5) 67 (3.8) 53 (3.9) 36 (4.3) 39 (4.0) 64 (4.3) 52 (3.3) 56 (4.7) 48 (3.4) 41 (3.6) 38 (3.6) 52 (4.4) 77 (3.3) 88 (2.9) 73 (3.5) 36 (3.8) 54 (3.3) 79 (0.1) 40 (3.7) 54 (4.3) 30 (2.9) 39 (4.7) 53 (4.4) 49 (3.0) 62 (3.1) 67 (4.0) 40 (4.5) 62 (3.8) 72 (2.7) 32 (3.5) 52 (4.0) 64 (2.4) 80 (2.7) 48 (4.5) 62 (3.9) 60 (4.1) 68 (4.2) 69 (3.6) 35 (3.0) 47 (2.3) 27 (2.1) 55 (4.4) 54 (0.5)
422 (5.8) 536 (4.8) 540 (3.3) 443 (6.4) 445 (4.7) 514 (2.5) 499 (5.6) 552 (2.7) 513 (3.2) 539 (3.1) 534 (3.4) 545 (6.1) 576 (3.8) 455 (4.2) 539 (3.0) 541 (4.6) 544 (4.7) 457 (5.9) 530 (5.2) 526 (3.7) 559 (2.1) 491 (5.5) 587 (2.6) 359 (8.6) 519 (3.7) 447 (1.9) 267 (8.3) 537 (2.8) 517 (3.9) 532 (3.9) 496 (3.1) 388 (6.0) 506 (3.2) 524 (5.4) 402 (8.7) 509 (5.9) 555 (3.9) 431 (7.9) 516 (3.9) 593 (4.2) 536 (3.6) 524 (3.6) 512 (3.7) 541 (3.6) 478 (6.1) 345 (6.5) 465 (5.7) 447 (4.3) 559 (3.5) 221 (8.9) 492 (0.7)
48 (4.6) 64 (3.7) 58 (3.4) 18 (2.9) 53 (4.9) 38 (3.6) 63 (4.3) 37 (4.1) 56 (3.5) 33 (3.8) 47 (3.9) 64 (4.3) 61 (4.0) 36 (4.3) 48 (3.3) 44 (4.7) 52 (3.4) 59 (3.6) 62 (3.6) 48 (4.4) 23 (3.3) 12 (2.9) 27 (3.5) 64 (3.8) 46 (3.3) 21 (0.1) 60 (3.7) 46 (4.3) 70 (2.9) 61 (4.7) 47 (4.4) 51 (3.0) 38 (3.1) 33 (4.0) 60 (4.5) 38 (3.8) 28 (2.7) 68 (3.5) 48 (4.0) 36 (2.4) 20 (2.7) 52 (4.5) 38 (3.9) 40 (4.1) 32 (4.2) 31 (3.6) 65 (3.0) 53 (2.3) 73 (2.1) 45 (4.4) 46 (0.5)
409 (5.5) 509 (5.2) 524 (3.6) 427 (9.6) 453 (5.5) 500 (3.4) 470 (4.5) 551 (3.5) 519 (2.6) 531 (4.3) 525 (4.2) 521 (4.4) 566 (2.6) 455 (7.0) 517 (4.3) 527 (8.2) 523 (5.6) 450 (5.2) 508 (4.3) 526 (4.5) 556 (3.5) 523 (14.1) 585 (3.1) 341 (6.1) 510 (3.1) 443 (3.3) 261 (6.6) 522 (3.4) 489 (3.0) 507 (4.3) 493 (3.4) 368 (4.4) 504 (3.7) 517 (6.0) 390 (7.4) 498 (10.9) 543 (5.8) 426 (7.4) 518 (3.9) 566 (6.4) 515 (10.8) 516 (3.5) 496 (4.0) 524 (5.5) 462 (10.8) 348 (8.9) 461 (5.8) 416 (3.9) 539 (2.6) 189 (9.8) 481 (0.9)
( ) Standard errors appear in parentheses. Because of rounding some results may appear inconsistent. A dash (–) indicates comparable data not available. A tilde (~) indicates insufficient data to report achievement. An “r” indicates data are available for at least 70% but less than 85% of the students. An “s” indicates data are available for at least 50% but less than 70% of the students.
392
TIMSS 2011 INTERNATIONAL RESULTS IN SCIENCE CHAPTER 8
SOURCE: IEA’s Trends in International Mathematics and Science Study – TIMSS 2011
Reported by Teachers
Students in Classrooms Where Teachers Report Instruction Is Limited by Students Suffering from Lack of Basic Nutrition Country
Not At All
Students in Classrooms Where Teachers Report Instruction Is Limited by Students Suffering from Not Enough Sleep
Some or A Lot
Not At All
Some or A Lot
Percent of Students
Average Achievement
Percent of Students
Average Achievement
Percent of Students
Average Achievement
Percent of Students
Average Achievement
60 (3.9) 28 (4.0) 22 (4.0)
393 (8.9) 466 (11.0) 365 (14.6)
40 (3.9) 72 (4.0) 78 (4.0)
340 (7.3) 420 (6.8) 340 (8.5)
41 (4.3) 64 (4.3) 55 (4.5)
388 (9.1) 439 (6.9) 360 (9.6)
59 (4.3) 36 (4.3) 45 (4.5)
360 (8.5) 420 (10.7) 326 (9.7)
60 (4.7) 63 (3.8) 74 (3.8) 61 (4.2) 86 (1.9) 63 (4.6) 65 (5.5)
550 (3.4) 536 (3.3) 522 (3.1) 420 (7.0) 478 (3.8) 549 (5.8) 543 (4.7)
40 (4.7) 37 (3.8) 26 (3.8) 39 (4.2) 14 (1.9) 37 (4.6) 35 (5.5)
528 (4.3) 514 (4.4) 502 (4.7) 405 (7.4) 406 (9.2) 534 (6.7) 527 (8.2)
29 (4.5) 26 (3.5) 38 (3.8) 44 (4.6) 65 (2.7) 27 (4.2) 19 (3.0)
559 (5.4) 540 (6.0) 526 (3.9) 421 (9.1) 483 (3.9) 556 (8.4) 539 (8.1)
71 (4.5) 74 (3.5) 62 (3.8) 56 (4.6) 35 (2.7) 73 (4.2) 81 (3.0)
535 (2.9) 523 (3.1) 511 (2.9) 408 (6.7) 439 (6.9) 539 (4.6) 537 (5.3)
Sixth Grade Participants Botswana Honduras Yemen Benchmarking Participants Alberta, Canada Ontario, Canada Quebec, Canada Abu Dhabi, UAE Dubai, UAE Florida, US North Carolina, US
r
r s
r
r s
CLASSROOM INSTRUCTION CHAPTER 8
393
SOURCE: IEA’s Trends in International Mathematics and Science Study – TIMSS 2011
Exhibit 8.21: Instruction Limited by Students Suffering from Lack of Nutrition or Sleep (Continued)
Exhibit 8.22: Instruction Limited by Students Suffering from Lack of Nutrition or Sleep Students in Classrooms Where Teachers Report Instruction Is Limited by Students Suffering from Lack of Basic Nutrition Country
Not At All
Armenia Australia Bahrain Chile Chinese Taipei England Finland Georgia Ghana Hong Kong SAR Hungary Indonesia Iran, Islamic Rep. of Israel Italy Japan Jordan Kazakhstan Korea, Rep. of Lebanon Lithuania Macedonia, Rep. of Malaysia Morocco New Zealand Norway Oman Palestinian Nat’l Auth. Qatar Romania Russian Federation Saudi Arabia Singapore Slovenia Sweden Syrian Arab Republic Thailand Tunisia Turkey Ukraine United Arab Emirates United States International Avg.
s
r
r
s
Students in Classrooms Where Teachers Report Instruction Is Limited by Students Suffering from Not Enough Sleep
Some or A Lot
Percent of Students
Average Achievement
Percent of Students
Average Achievement
38 (2.5) 76 (2.8) 53 (3.4) 55 (4.4) 83 (3.0) 75 (2.4) 90 (1.2) 39 (2.8) 34 (4.3) 86 (3.3) 82 (2.0) 70 (3.5) 30 (3.3) 82 (2.5) 90 (2.4) 99 (0.9) 30 (3.4) 81 (2.5) 73 (3.4) 65 (3.3) 80 (1.6) 76 (2.1) 74 (3.3) 30 (2.4) 71 (3.0) 58 (3.7) 38 (3.4) 24 (3.5) 52 (4.3) 60 (2.9) 82 (1.7) 39 (4.2) 89 (1.9) 86 (1.5) 93 (1.7) 44 (3.8) 73 (3.2) 56 (3.7) 38 (3.3) 81 (2.6) 61 (2.5) 60 (2.4) 64 (0.5)
446 (4.6) 540 (6.1) 469 (4.6) 476 (4.0) 565 (2.5) 538 (5.4) 553 (2.5) 430 (3.6) 333 (11.9) 539 (4.2) 531 (3.0) 404 (5.8) 499 (8.0) 527 (4.5) 504 (2.5) 558 (2.4) 451 (10.1) 494 (4.3) 559 (2.3) 402 (6.1) 517 (2.7) 420 (5.9) 442 (6.3) 394 (3.8) 529 (5.3) 497 (3.1) 424 (5.4) 436 (8.0) 439 (8.9) 470 (4.6) 547 (3.3) 436 (7.7) 596 (4.2) 543 (2.7) 513 (2.9) 428 (6.2) 451 (5.2) 446 (3.4) 501 (7.9) 504 (3.9) 475 (3.5) 538 (4.2) 485 (0.8)
62 (2.5) 24 (2.8) 47 (3.4) 45 (4.4) 17 (3.0) 25 (2.4) 10 (1.2) 61 (2.8) 66 (4.3) 14 (3.3) 18 (2.0) 30 (3.5) 70 (3.3) 18 (2.5) 10 (2.4) 1 (0.9) 70 (3.4) 19 (2.5) 27 (3.4) 35 (3.3) 20 (1.6) 24 (2.1) 26 (3.3) 70 (2.4) 29 (3.0) 42 (3.7) 62 (3.4) 76 (3.5) 48 (4.3) 40 (2.9) 18 (1.7) 61 (4.2) 11 (1.9) 14 (1.5) 7 (1.7) 56 (3.8) 27 (3.2) 44 (3.7) 62 (3.3) 19 (2.6) 39 (2.5) 40 (2.4) 36 (0.5)
433 (4.0) 484 (8.9) 436 (4.4) 444 (4.1) 557 (8.3) 513 (11.4) 545 (4.9) 414 (4.0) 293 (6.5) 520 (10.7) 488 (6.4) 407 (7.2) 464 (4.1) 478 (10.5) 491 (11.3) ~~ 448 (4.8) 478 (7.2) 562 (3.6) 413 (7.6) 504 (3.8) 379 (9.7) 379 (12.3) 370 (2.6) 469 (6.9) 489 (4.5) 417 (4.1) 416 (3.5) 395 (5.9) 457 (4.4) 522 (5.1) 437 (4.2) 538 (22.6) 544 (4.4) 490 (9.9) 425 (5.3) 450 (6.5) 429 (3.1) 472 (3.8) 489 (5.1) 442 (3.9) 519 (5.0) 461 (1.2)
Not At All Percent of Students
53 (2.6) s 37 (3.6) 31 (2.8) 26 (3.1) 23 (3.6) r 37 (3.4) 18 (1.9) 47 (3.1) 26 (3.4) 17 (3.2) 43 (2.4) 47 (4.5) 35 (3.6) 47 (3.8) 68 (3.9) 65 (3.6) 42 (4.2) 85 (2.1) 28 (3.0) 36 (3.5) 60 (1.9) r 51 (2.5) 59 (4.1) 38 (2.4) 37 (3.8) 33 (3.8) 47 (3.4) 27 (2.9) 34 (4.1) 55 (2.4) 67 (2.6) 23 (3.4) 30 (2.7) 47 (2.3) r 43 (3.5) 48 (3.8) 51 (4.4) 44 (3.5) 30 (3.2) 78 (2.7) 40 (2.6) s 15 (1.8) 42 (0.5)
Some or A Lot
Average Achievement
Percent of Students
Average Achievement
441 (4.2) 535 (6.4) 473 (6.2) 484 (5.7) 555 (6.8) 549 (5.4) 560 (3.2) 420 (4.0) 309 (8.5) 549 (14.7) 531 (3.5) 403 (7.9) 487 (6.3) 535 (5.9) 502 (3.3) 558 (2.7) 451 (8.1) 490 (4.3) 560 (4.0) 402 (7.5) 516 (2.7) 411 (6.8) 448 (6.8) 379 (3.2) 531 (6.5) 502 (3.8) 424 (5.9) 415 (8.1) 452 (14.1) 465 (4.8) 547 (3.3) 439 (7.9) 611 (8.3) 543 (2.7) 517 (3.9) 429 (6.0) 451 (6.4) 439 (3.6) 492 (9.6) 502 (3.9) 477 (4.4) 534 (7.7) 484 (1.0)
47 (2.6) 63 (3.6) 69 (2.8) 74 (3.1) 77 (3.6) 63 (3.4) 82 (1.9) 53 (3.1) 74 (3.4) 83 (3.2) 57 (2.4) 53 (4.5) 65 (3.6) 53 (3.8) 32 (3.9) 35 (3.6) 58 (4.2) 15 (2.1) 72 (3.0) 64 (3.5) 40 (1.9) 49 (2.5) 41 (4.1) 62 (2.4) 63 (3.8) 67 (3.8) 53 (3.4) 73 (2.9) 66 (4.1) 45 (2.4) 33 (2.6) 77 (3.4) 70 (2.7) 53 (2.3) 57 (3.5) 52 (3.8) 49 (4.4) 56 (3.5) 70 (3.2) 22 (2.7) 60 (2.6) 85 (1.8) 58 (0.5)
434 (4.5) 522 (7.6) 445 (2.6) 453 (3.2) 566 (2.8) 522 (7.7) 550 (2.7) 421 (4.3) 305 (7.1) 532 (3.5) 517 (4.0) 407 (5.5) 468 (4.9) 503 (5.6) 501 (4.8) 557 (4.1) 448 (4.8) 494 (8.8) 559 (2.1) 407 (6.2) 512 (3.4) 408 (6.5) 394 (8.9) 375 (2.6) 500 (5.5) 489 (3.2) 416 (4.6) 423 (3.6) 401 (5.8) 464 (3.8) 533 (4.3) 436 (4.8) 582 (5.4) 543 (3.5) 507 (3.9) 424 (5.4) 451 (5.2) 439 (4.0) 479 (3.8) 496 (5.0) 452 (3.0) 529 (3.6) 473 (0.8)
( ) Standard errors appear in parentheses. Because of rounding some results may appear inconsistent. A tilde (~) indicates insufficient data to report achievement. An “r” indicates data are available for at least 70% but less than 85% of the students. An “s” indicates data are available for at least 50% but less than 70% of the students. An “x” indicates data are available for less than 50% of students.
394
TIMSS 2011 INTERNATIONAL RESULTS IN SCIENCE CHAPTER 8
SOURCE: IEA’s Trends in International Mathematics and Science Study – TIMSS 2011
Reported by Teachers
Students in Classrooms Where Teachers Report Instruction Is Limited by Students Suffering from Lack of Basic Nutrition Country
Not At All
Students in Classrooms Where Teachers Report Instruction Is Limited by Students Suffering from Not Enough Sleep
Some or A Lot
Not At All
Some or A Lot
Percent of Students
Average Achievement
Percent of Students
Average Achievement
Percent of Students
Average Achievement
Percent of Students
Average Achievement
64 (4.1) 25 (4.2) 38 (3.0)
410 (4.7) 392 (11.5) 351 (8.7)
36 (4.1) 75 (4.2) 62 (3.0)
392 (5.8) 362 (4.1) 316 (5.4)
40 (4.0) 34 (4.6) 31 (3.4)
409 (6.9) 367 (9.5) 330 (8.5)
60 (4.0) 66 (4.6) 69 (3.4)
400 (4.5) 371 (4.9) 329 (5.4)
57 (4.8) 64 (3.9) 72 (3.7) 60 (4.0) 64 (4.5) 81 (6.8) 52 (6.0) 65 (7.8) 63 (6.2) xx 56 (6.9) 68 (5.8) 57 (5.0) 58 (8.1)
554 (3.3) 528 (3.8) 529 (3.6) 469 (6.3) 506 (4.7) 489 (9.1) 519 (7.8) 553 (7.4) 546 (9.6) xx 536 (7.1) 582 (7.2) 561 (6.4) 534 (13.6)
43 (4.8) 36 (3.9) 28 (3.7) 40 (4.0) 36 (4.5) 19 (6.8) 48 (6.0) 35 (7.8) 37 (6.2) xx 44 (6.9) 32 (5.8) 43 (5.0) 42 (8.1)
536 (3.3) 509 (3.6) 500 (5.5) 452 (4.7) 434 (9.9) 468 (11.3) 491 (11.6) 532 (13.1) 520 (10.0) xx 525 (8.2) 528 (13.0) 543 (9.8) 520 (15.9)
16 (3.3) 23 (3.6) 40 (4.3) 39 (4.2) 47 (4.6) 13 (3.7) 23 (5.6) 19 (4.9) 24 (5.5) xx 14 (4.3) 16 (5.9) 15 (5.1) 14 (4.1)
562 (6.3) 533 (5.7) 529 (5.7) 469 (8.1) 503 (5.3) 526 (10.0) 519 (11.3) 548 (8.4) 544 (14.3) xx 525 (14.7) 583 (17.5) 550 (6.6) 533 (17.1)
84 (3.3) 77 (3.6) 60 (4.3) 61 (4.2) 53 (4.6) 87 (3.7) 77 (5.6) 81 (4.9) 76 (5.5) xx 86 (4.3) 84 (5.9) 85 (5.1) 86 (4.1)
543 (2.6) 517 (3.2) 515 (3.4) 456 (4.7) 461 (6.0) 479 (7.6) 500 (9.1) 545 (7.5) 533 (8.1) xx 532 (5.1) 567 (8.3) 553 (6.7) 527 (11.6)
Ninth Grade Participants Botswana Honduras South Africa Benchmarking Participants Alberta, Canada Ontario, Canada Quebec, Canada Abu Dhabi, UAE Dubai, UAE Alabama, US California, US Colorado, US Connecticut, US Florida, US Indiana, US Massachusetts, US Minnesota, US North Carolina, US
r s s s s s s r s
r s s s s s s r s
CLASSROOM INSTRUCTION CHAPTER 8
395
SOURCE: IEA’s Trends in International Mathematics and Science Study – TIMSS 2011
Exhibit 8.22: Instruction Limited by Students Suffering from Lack of Nutrition or Sleep (Continued)
Exhibit 8.23: Instruction Limited by Disruptive or Uninterested Students
Country Armenia Australia Austria Azerbaijan Bahrain Belgium (Flemish) Chile Chinese Taipei Croatia Czech Republic Denmark England Finland Georgia Germany Hong Kong SAR Hungary Iran, Islamic Rep. of Ireland Italy Japan Kazakhstan Korea, Rep. of Kuwait Lithuania Malta Morocco Netherlands New Zealand Northern Ireland Norway Oman Poland Portugal Qatar Romania Russian Federation Saudi Arabia Serbia Singapore Slovak Republic Slovenia Spain Sweden Thailand Tunisia Turkey United Arab Emirates United States Yemen International Avg.
r
r r
r
r
Students in Classrooms Where Teachers Report Instruction Is Limited by Disruptive Students Some or Not At All A Lot
Students in Classrooms Where Teachers Report Instruction Is Limited by Uninterested Students Some or Not At All A Lot
Percent of Students
Percent of Students
95 (1.6) 86 (2.7) 90 (2.2) 99 (0.7) 77 (4.0) 92 (2.1) 72 (3.8) 96 (1.6) 93 (1.9) 88 (2.6) 88 (1.9) 94 (1.9) 90 (2.3) 97 (1.2) 89 (2.0) 89 (2.8) 91 (2.1) 88 (2.4) 90 (2.5) 76 (3.3) 94 (2.0) 99 (0.7) 62 (3.7) 77 (3.5) 81 (2.3) 83 (0.1) 86 (3.6) 90 (2.8) 89 (1.5) 95 (2.0) 91 (2.8) 78 (2.7) 85 (2.6) 88 (2.4) 80 (3.1) 98 (0.8) 94 (1.8) 86 (3.0) 90 (2.2) 91 (1.9) 96 (1.0) 66 (3.6) 87 (2.6) 94 (1.8) 94 (2.4) 79 (3.5) 84 (2.4) 86 (1.7) 86 (1.6) 85 (3.2) 87 (0.3)
Average Achievement
Percent of Students
Average Achievement
417 (4.2) 523 (3.8) 533 (3.1) 440 (5.6) 451 (4.0) 510 (2.1) 489 (2.9) 551 (2.3) 516 (2.2) 538 (2.6) 530 (2.7) 532 (3.6) 571 (2.6) 456 (3.9) 532 (3.0) 537 (3.7) 535 (4.1) 455 (4.0) 518 (3.4) 527 (3.3) 558 (2.0) 495 (5.1) 587 (2.6) 352 (5.4) 514 (2.7) 449 (2.0) 265 (5.3) 531 (2.6) 502 (2.5) 519 (2.9) 496 (2.5) 384 (4.7) 505 (2.8) 522 (4.4) 410 (4.9) 504 (6.1) 552 (3.7) 431 (6.0) 516 (3.1) 585 (3.4) 532 (4.0) 524 (3.2) 511 (2.9) 537 (3.1) 475 (6.3) 347 (6.1) 463 (5.1) 436 (2.7) 548 (2.2) 206 (8.1) 488 (0.6)
5 (1.6) 14 (2.7) 10 (2.2) 1 (0.7) 23 (4.0) 8 (2.1) 28 (3.8) 4 (1.6) 7 (1.9) 12 (2.6) 12 (1.9) 6 (1.9) 10 (2.3) 3 (1.2) 11 (2.0) 11 (2.8) 9 (2.1) 12 (2.4) 10 (2.5) 24 (3.3) 6 (2.0) 1 (0.7) 38 (3.7) 23 (3.5) 19 (2.3) 17 (0.1) 14 (3.6) 10 (2.8) 11 (1.5) 5 (2.0) 9 (2.8) 22 (2.7) 15 (2.6) 12 (2.4) 20 (3.1) 2 (0.8) 6 (1.8) 14 (3.0) 10 (2.2) 9 (1.9) 4 (1.0) 34 (3.6) 13 (2.6) 6 (1.8) 6 (2.4) 21 (3.5) 16 (2.4) 14 (1.7) 14 (1.6) 15 (3.2) 13 (0.3)
406 (12.6) 497 (6.2) 518 (7.3) ~~ 441 (8.7) 492 (8.2) 462 (6.5) 557 (13.6) 520 (6.2) 527 (10.2) 529 (10.7) 494 (10.2) 562 (5.2) 423 (23.5) 503 (7.6) 513 (16.9) 519 (8.1) 440 (14.2) 502 (9.8) 521 (7.3) 563 (7.4) ~~ 585 (3.0) 333 (10.7) 517 (6.1) 438 (3.5) 248 (13.2) 527 (5.1) 455 (5.7) 485 (23.3) 481 (8.3) 358 (6.3) 506 (6.5) 519 (10.5) 330 (11.5) ~~ 550 (10.7) 415 (17.2) 520 (6.2) 566 (15.9) 512 (14.3) 514 (3.7) 475 (9.2) 506 (11.2) 438 (21.8) 340 (10.4) 461 (8.6) 401 (8.8) 524 (6.5) 211 (15.5) 472 (1.6)
r
r r
r
r
88 (2.8) 94 (1.7) 93 (2.2) 96 (1.2) 80 (3.5) 97 (1.3) 82 (3.4) 97 (1.4) 95 (1.4) 95 (1.4) 93 (1.5) 96 (1.7) 98 (0.7) 95 (1.7) 97 (1.3) 96 (1.5) 93 (1.8) 81 (3.2) 96 (1.6) 87 (2.6) 97 (1.3) 97 (1.4) 81 (3.5) 79 (3.2) 85 (2.4) 91 (0.1) 70 (4.0) 98 (0.8) 97 (0.9) 98 (1.2) 98 (1.1) 74 (2.8) 93 (1.7) 85 (2.9) 76 (3.2) 93 (2.0) 95 (1.8) 81 (3.7) 87 (2.6) 92 (1.4) 94 (1.6) 84 (2.4) 83 (3.0) 97 (1.4) 89 (3.0) 77 (3.5) 67 (3.1) 88 (1.6) 91 (1.1) 79 (3.7) 89 (0.3)
Average Achievement
Percent of Students
Average Achievement
417 (4.5) 521 (3.6) 533 (2.7) 441 (5.5) 456 (4.0) 510 (2.0) 483 (3.2) 552 (2.3) 517 (2.0) 539 (2.3) 530 (2.6) 532 (3.5) 571 (2.5) 455 (4.0) 529 (2.9) 535 (4.2) 535 (3.9) 460 (4.4) 517 (3.4) 527 (2.9) 559 (2.0) 495 (5.2) 587 (2.4) 353 (5.6) 516 (2.7) 448 (2.1) 273 (6.1) 530 (2.5) 499 (2.4) 517 (3.1) 494 (2.5) 379 (4.1) 505 (2.6) 522 (4.6) 408 (5.2) 508 (6.2) 553 (3.6) 434 (5.6) 516 (3.2) 587 (3.3) 534 (3.4) 521 (3.0) 512 (2.8) 534 (3.2) 479 (4.9) 352 (6.2) 475 (4.5) 436 (2.8) 547 (2.3) 208 (7.9) 489 (0.6)
12 (2.8) 6 (1.7) 7 (2.2) 4 (1.2) 20 (3.5) 3 (1.3) 18 (3.4) 3 (1.4) 5 (1.4) 5 (1.4) 7 (1.5) 4 (1.7) 2 (0.7) 5 (1.7) 3 (1.3) 4 (1.5) 7 (1.8) 19 (3.2) 4 (1.6) 13 (2.6) 3 (1.3) 3 (1.4) 19 (3.5) 21 (3.2) 15 (2.4) 9 (0.1) 30 (4.0) 2 (0.8) 3 (0.9) 2 (1.2) 2 (1.1) 26 (2.8) 7 (1.7) 15 (2.9) 24 (3.2) 7 (2.0) 5 (1.8) 19 (3.7) 13 (2.6) 8 (1.4) 6 (1.6) 16 (2.4) 17 (3.0) 3 (1.4) 11 (3.0) 23 (3.5) 33 (3.1) 12 (1.6) 9 (1.1) 21 (3.7) 11 (0.3)
408 (8.1) 494 (11.7) 513 (8.4) 408 (19.2) 425 (9.3) 473 (13.2) 470 (8.5) 540 (20.2) 504 (6.6) 500 (19.3) 532 (17.0) 491 (9.6) ~~ 444 (15.2) 517 (10.3) 522 (9.6) 507 (16.2) 422 (10.1) 509 (8.1) 516 (9.4) 561 (8.8) 498 (20.9) 585 (4.0) 327 (10.9) 508 (7.4) 432 (4.7) 241 (7.5) ~~ 455 (15.5) ~~ ~~ 373 (9.1) 497 (9.8) 519 (8.7) 353 (11.8) 458 (23.1) 534 (7.9) 409 (14.3) 519 (8.9) 531 (16.8) 497 (18.5) 514 (4.2) 475 (7.0) 533 (14.0) 419 (22.2) 324 (11.5) 436 (9.3) 395 (8.4) 515 (6.7) 203 (14.9) 463 (1.9)
( ) Standard errors appear in parentheses. Because of rounding some results may appear inconsistent. A tilde (~) indicates insufficient data to report achievement. An “r” indicates data are available for at least 70% but less than 85% of the students. An “s” indicates data are available for at least 50% but less than 70% of the students.
396
TIMSS 2011 INTERNATIONAL RESULTS IN SCIENCE CHAPTER 8
SOURCE: IEA’s Trends in International Mathematics and Science Study – TIMSS 2011
Reported by Teachers
Country
Students in Classrooms Where Teachers Report Instruction Is Limited by Disruptive Students Some or Not At All A Lot
Students in Classrooms Where Teachers Report Instruction Is Limited by Uninterested Students Some or Not At All A Lot
Percent of Students
Percent of Students
Average Achievement
Percent of Students
Average Achievement
90 (2.5) 95 (1.3) 87 (2.8)
375 (6.8) 432 (6.3) 344 (7.7)
10 (2.5) 5 (1.3) 13 (2.8)
344 (19.7) 437 (11.8) 349 (17.3)
85 (3.1) 81 (2.6) 78 (4.1) 84 (3.5) 94 (1.1) 87 (3.9) 83 (4.7)
545 (3.0) 528 (3.4) 518 (3.2) 419 (5.3) 473 (3.5) 547 (4.1) 542 (4.5)
15 (3.1) 19 (2.6) 22 (4.1) 16 (3.5) 6 (1.1) 13 (3.9) 17 (4.7)
524 (4.5) 529 (4.7) 509 (4.6) 390 (12.4) 406 (10.7) 515 (14.4) 516 (11.8)
Average Achievement
Percent of Students
Average Achievement
82 (3.3) 89 (2.6) 81 (3.4)
382 (7.1) 432 (6.7) 348 (7.2)
18 (3.3) 11 (2.6) 19 (3.4)
327 (10.5) 430 (11.2) 329 (17.2)
95 (1.8) 93 (2.1) 91 (2.5) 87 (3.0) 95 (0.8) 88 (2.6) 85 (3.2)
543 (2.9) 530 (3.1) 517 (2.9) 418 (5.7) 475 (3.1) 546 (3.9) 538 (5.1)
5 (1.8) 7 (2.1) 9 (2.5) 13 (3.0) 5 (0.8) 12 (2.6) 15 (3.2)
513 (8.4) 501 (6.6) 506 (5.7) 389 (8.9) 364 (14.8) 522 (15.5) 531 (10.5)
Sixth Grade Participants Botswana Honduras Yemen Benchmarking Participants Alberta, Canada Ontario, Canada Quebec, Canada Abu Dhabi, UAE Dubai, UAE Florida, US North Carolina, US
r
r s
r
r s
CLASSROOM INSTRUCTION CHAPTER 8
397
SOURCE: IEA’s Trends in International Mathematics and Science Study – TIMSS 2011
Exhibit 8.23: Instruction Limited by Disruptive or Uninterested Students (Continued)
Exhibit 8.24: Instruction Limited by Disruptive or Uninterested Students
Country Armenia Australia Bahrain Chile Chinese Taipei England Finland Georgia Ghana Hong Kong SAR Hungary Indonesia Iran, Islamic Rep. of Israel Italy Japan Jordan Kazakhstan Korea, Rep. of Lebanon Lithuania Macedonia, Rep. of Malaysia Morocco New Zealand Norway Oman Palestinian Nat’l Auth. Qatar Romania Russian Federation Saudi Arabia Singapore Slovenia Sweden Syrian Arab Republic Thailand Tunisia Turkey Ukraine United Arab Emirates United States International Avg.
s
r
r
s
Students in Classrooms Where Teachers Report Instruction Is Limited by Disruptive Students Some or Not At All A Lot
Students in Classrooms Where Teachers Report Instruction Is Limited by Uninterested Students Some or Not At All A Lot
Percent of Students
Percent of Students
91 (1.6) 87 (2.4) 79 (2.8) 63 (3.8) 81 (3.3) 83 (2.7) 86 (2.3) 91 (1.5) 91 (2.4) 95 (1.7) 88 (1.4) 97 (1.2) 91 (1.8) 65 (3.9) 80 (3.2) 97 (1.3) 70 (3.8) 98 (0.7) 63 (3.7) 84 (2.2) 74 (1.8) 91 (1.3) 97 (1.3) 73 (2.4) 82 (2.6) 94 (1.8) 82 (2.5) 67 (3.8) 85 (2.2) 92 (1.2) 87 (1.3) 83 (3.0) 89 (1.9) 71 (2.1) 88 (2.2) 76 (3.5) 95 (1.8) 74 (3.3) 69 (3.3) 86 (2.4) 84 (1.9) 83 (1.8) 83 (0.4)
Average Achievement
Percent of Students
Average Achievement
439 (3.5) 533 (6.2) 459 (3.0) 470 (3.5) 568 (2.8) 538 (5.9) 554 (2.5) 419 (3.2) 310 (5.5) 537 (3.3) 526 (3.0) 404 (4.5) 476 (4.3) 532 (4.8) 506 (2.8) 558 (2.5) 459 (4.8) 491 (4.2) 561 (2.7) 407 (5.0) 519 (2.8) 412 (5.6) 424 (6.4) 376 (2.7) 519 (4.7) 495 (2.6) 424 (4.2) 424 (4.4) 426 (4.4) 466 (3.6) 546 (3.6) 438 (4.5) 596 (4.5) 544 (2.7) 515 (2.8) 428 (4.8) 450 (4.1) 439 (2.8) 491 (4.7) 504 (3.9) 464 (2.6) 534 (3.6) 481 (0.6)
9 (1.6) 13 (2.4) 21 (2.8) 37 (3.8) 19 (3.3) 17 (2.7) 14 (2.3) 9 (1.5) 9 (2.4) 5 (1.7) 12 (1.4) 3 (1.2) 9 (1.8) 35 (3.9) 20 (3.2) 3 (1.3) 30 (3.8) 2 (0.7) 37 (3.7) 16 (2.2) 26 (1.8) 9 (1.3) 3 (1.3) 27 (2.4) 18 (2.6) 6 (1.8) 18 (2.5) 33 (3.8) 15 (2.2) 8 (1.2) 13 (1.3) 17 (3.0) 11 (1.9) 29 (2.1) 12 (2.2) 24 (3.5) 5 (1.8) 26 (3.3) 31 (3.3) 14 (2.4) 16 (1.9) 17 (1.8) 17 (0.4)
426 (7.3) 488 (10.5) 433 (6.5) 444 (5.2) 547 (5.9) 506 (11.1) 537 (4.0) 434 (6.3) 274 (17.7) 486 (34.9) 502 (6.5) 450 (15.9) 457 (11.6) 492 (7.8) 487 (9.0) 542 (12.2) 425 (7.8) ~~ 558 (3.1) 403 (12.3) 503 (3.4) 387 (12.6) 458 (30.1) 377 (4.1) 476 (8.6) 471 (16.8) 398 (7.8) 413 (5.8) 372 (10.7) 455 (6.1) 520 (4.9) 431 (6.9) 543 (13.8) 539 (4.1) 481 (8.5) 421 (8.2) 459 (12.5) 437 (5.2) 467 (4.9) 484 (7.6) 450 (6.9) 509 (7.9) 462 (1.8)
s
r
r
s
84 (1.8) 91 (1.9) 73 (3.5) 62 (3.9) 65 (4.2) 90 (2.0) 89 (1.7) 86 (1.8) 94 (2.0) 84 (3.1) 87 (1.7) 91 (2.0) 73 (2.8) 72 (3.6) 69 (3.7) 97 (1.4) 64 (3.4) 97 (0.8) 74 (3.4) 84 (2.6) 77 (1.7) 85 (1.6) 86 (2.6) 53 (2.1) 86 (2.5) 97 (2.0) 62 (3.1) 59 (3.8) 79 (2.7) 86 (1.9) 87 (1.6) 81 (3.2) 88 (1.9) 76 (2.1) 92 (1.9) 67 (3.5) 87 (2.7) 74 (3.7) 57 (3.5) 65 (3.1) 80 (2.3) 82 (2.2) 79 (0.4)
Average Achievement
Percent of Students
Average Achievement
440 (3.4) 531 (5.9) 465 (3.5) 468 (3.6) 572 (3.6) 534 (5.7) 554 (2.4) 420 (3.1) 309 (5.6) 542 (3.5) 526 (3.0) 403 (4.7) 483 (4.1) 529 (4.5) 509 (2.9) 558 (2.5) 460 (5.2) 491 (4.2) 561 (2.4) 408 (5.2) 519 (2.5) 414 (5.6) 437 (6.2) 384 (3.0) 518 (5.0) 495 (2.6) 431 (4.4) 423 (4.9) 430 (4.3) 468 (3.7) 547 (3.5) 441 (4.5) 596 (4.4) 545 (2.6) 513 (3.0) 433 (5.0) 453 (4.3) 442 (3.0) 496 (5.3) 509 (4.5) 468 (2.7) 534 (3.7) 482 (0.6)
16 (1.8) 9 (1.9) 27 (3.5) 38 (3.9) 35 (4.2) 10 (2.0) 11 (1.7) 14 (1.8) 6 (2.0) 16 (3.1) 13 (1.7) 9 (2.0) 27 (2.8) 28 (3.6) 31 (3.7) 3 (1.4) 36 (3.4) 3 (0.8) 26 (3.4) 16 (2.6) 23 (1.7) 15 (1.6) 14 (2.6) 47 (2.1) 14 (2.5) 3 (2.0) 38 (3.1) 41 (3.8) 21 (2.7) 14 (1.9) 13 (1.6) 19 (3.2) 12 (1.9) 24 (2.1) 8 (1.9) 33 (3.5) 13 (2.7) 26 (3.7) 43 (3.5) 35 (3.1) 20 (2.3) 18 (2.2) 21 (0.4)
424 (5.2) 480 (13.1) 423 (6.1) 448 (5.1) 549 (4.0) 511 (10.9) 536 (5.9) 419 (6.1) 261 (24.9) 497 (14.4) 498 (7.2) 429 (8.9) 453 (7.2) 489 (9.1) 487 (5.9) 533 (7.4) 429 (7.6) 499 (20.0) 557 (3.0) 394 (12.0) 498 (4.8) 387 (11.0) 358 (14.9) 368 (3.4) 474 (9.6) 449 (41.0) 401 (6.3) 417 (4.8) 375 (8.2) 446 (6.5) 516 (5.9) 416 (7.7) 545 (12.2) 537 (4.3) 486 (6.5) 412 (6.1) 430 (10.4) 429 (3.9) 466 (4.5) 486 (4.8) 438 (7.3) 515 (6.8) 456 (1.7)
( ) Standard errors appear in parentheses. Because of rounding some results may appear inconsistent. A tilde (~) indicates insufficient data to report achievement. An “r” indicates data are available for at least 70% but less than 85% of the students. An “s” indicates data are available for at least 50% but less than 70% of the students. An “x” indicates data are available for less than 50% of students.
398
TIMSS 2011 INTERNATIONAL RESULTS IN SCIENCE CHAPTER 8
SOURCE: IEA’s Trends in International Mathematics and Science Study – TIMSS 2011
Reported by Teachers
Country
Students in Classrooms Where Teachers Report Instruction Is Limited by Disruptive Students Some or Not At All A Lot
Students in Classrooms Where Teachers Report Instruction Is Limited by Uninterested Students Some or Not At All A Lot
Percent of Students
Percent of Students
Average Achievement
Percent of Students
Average Achievement
67 (3.7) 81 (3.9) 78 (3.3)
406 (4.5) 372 (4.9) 328 (4.4)
33 (3.7) 19 (3.9) 22 (3.3)
400 (6.5) 360 (10.1) 338 (10.7)
85 (2.7) 85 (2.8) 71 (3.5) 79 (3.7) 85 (4.0) 79 (6.1) 76 (4.6) 88 (4.0) 79 (5.2) xx 85 (4.4) 89 (4.0) 87 (4.6) 76 (6.4)
547 (2.7) 523 (2.9) 528 (3.4) 466 (5.2) 488 (3.6) 490 (8.9) 513 (7.4) 549 (5.8) 549 (7.8) xx 535 (5.2) 570 (8.8) 558 (5.8) 536 (11.4)
15 (2.7) 15 (2.8) 29 (3.5) 21 (3.7) 15 (4.0) 21 (6.1) 24 (4.6) 12 (4.0) 21 (5.2) xx 15 (4.4) 11 (4.0) 13 (4.6) 24 (6.4)
541 (5.6) 510 (7.3) 502 (6.1) 443 (6.2) 441 (17.1) 468 (12.4) 479 (14.1) 520 (19.4) 486 (15.4) xx 509 (14.8) 525 (33.2) 524 (34.2) 502 (20.0)
Average Achievement
Percent of Students
Average Achievement
46 (3.9) 71 (3.9) 73 (3.5)
421 (5.6) 370 (5.2) 327 (4.5)
54 (3.9) 29 (3.9) 27 (3.5)
390 (5.0) 368 (7.7) 335 (8.6)
91 (2.2) 89 (2.6) 80 (3.1) 74 (3.8) 84 (4.0) 66 (8.2) 78 (4.7) 84 (5.8) 82 (4.9) xx 83 (4.2) 93 (3.3) 92 (2.5) 74 (6.8)
548 (2.5) 523 (2.8) 524 (3.3) 466 (5.3) 490 (3.6) 496 (8.5) 511 (8.1) 547 (6.7) 543 (8.3) xx 531 (5.2) 576 (6.4) 556 (5.9) 534 (12.7)
9 (2.2) 11 (2.6) 20 (3.1) 26 (3.8) 16 (4.0) 34 (8.2) 22 (4.7) 16 (5.8) 18 (4.9) xx 17 (4.2) 7 (3.3) 8 (2.5) 26 (6.8)
530 (8.3) 504 (7.7) 507 (7.4) 446 (6.3) 431 (18.4) 465 (11.2) 484 (10.7) 534 (15.4) 503 (17.9) xx 531 (14.4) 488 (37.0) 527 (10.2) 512 (17.9)
Ninth Grade Participants Botswana Honduras South Africa Benchmarking Participants Alberta, Canada Ontario, Canada Quebec, Canada Abu Dhabi, UAE Dubai, UAE Alabama, US California, US Colorado, US Connecticut, US Florida, US Indiana, US Massachusetts, US Minnesota, US North Carolina, US
r s s s s s s r s
r s s s s s s r s
CLASSROOM INSTRUCTION CHAPTER 8
399
SOURCE: IEA’s Trends in International Mathematics and Science Study – TIMSS 2011
Exhibit 8.24: Instruction Limited by Disruptive or Uninterested Students (Continued)
Instruction Limited by Disruptive or Uninterested Students The importance of classroom management and maintaining a positive and productive classroom environment is widely recognized as central to highquality teaching (Bill & Melinda Gates Foundation, 2010). Yet, even the most experienced and effective teachers can encounter discipline problems. Exhibit 8.23 presents teachers’ reports about the extent to which their fourth grade classroom instruction in science was limited by disruptive or uninterested students. As good news, internationally, on average, teachers reported their instruction was rarely limited by either disruptive or bored students, with 87 to 89 percent of the fourth grade students in classrooms with some or no problems. However, the 11 to 13 percent of students in classrooms with a lot of student behavior problems did have lower average science achievement (from 16–26 points). Across the fourth grade, sixth grade, and benchmarking participants there was some variation in teachers’ reports about disruptive and uninterested students. In general, however, teachers reported that their fourth grade students around the world appear relatively well behaved and attentive during their science lessons. Exhibit 8.24 presents teachers’ reports about the extent to which their eighth grade classroom instruction in science was limited by disruptive or uninterested students. Internationally, on average, teachers reported their instruction was limited “some or not at all” by disruptive students for 83 percent of the students and by bored students for 79 percent of the students. Although most of the eighth grade students were in science classrooms with attentive students, the 17 to 21 percent of students in classrooms with “a lot” of student behavior problems had lower average science achievement (from 19–26 points). Across the eighth grade, ninth grade, and benchmarking participants there was some variation in teachers’ reports. Compared to the fourth grade, however, boredom appears to be an emerging problem in science classes at the eighth grade. It is difficult to know whether students are bored because they cannot do the science, or whether they just find science boring.
400
TIMSS 2011 INTERNATIONAL RESULTS IN SCIENCE CHAPTER 8
Classroom Resources and Activities for Teaching Science Resources Teachers Use for Teaching Science Exhibit 8.25 contains teachers’ reports about the classroom materials used for teaching science at the fourth grade. On average, internationally, textbooks were used most often as the basis for science instruction, for 70 percent of the fourth grade students, and workbooks or worksheets were used the next most often, for 41 percent of the students. Science equipment and materials were used as the basis of instruction for 36 percent of the fourth grade students, and relying on computer software was relatively rare, used for only 11 percent of the students, on average. Teachers reported that all of the materials TIMSS asked about were used to some extent as supplementary resources for science instruction at the fourth grade, with science equipment and materials the most popular, used with 60 percent of the students, followed by workbooks or worksheets used with 56 percent of the students, on average. Teachers reported using computer software as a supplementary resource for 53 percent of the fourth grade students, on average. As shown in Exhibit 8.26, textbooks also were the most frequent basis of science instruction at the eighth grade, used with 74 percent of the students internationally, on average. However, in contrast to the fourth grade, science equipment and materials were the next most frequently reported basis for instruction, used with 43 percent of the eighth grade students. Workbooks or worksheets were less frequently used than at the fourth grade (35% of students on average) but still heavily used in some countries. Computer software was more frequently reported as a basis for instruction than at the fourth grade, but was not used with many students—only 16 percent, on average. All of the following materials except textbooks were popular as supplementary instructional resources at the eighth grade: workbooks or worksheets, with 60 percent of students; science equipment and materials, with 54 percent; and computer software, with 61 percent.
CLASSROOM INSTRUCTION CHAPTER 8
401
Exhibit 8.25: Resources Teachers Use for Teaching Science Percent of Students Whose Teachers Use Textbooks
Country
As Basis for Instruction
Armenia Australia Austria Azerbaijan Bahrain Belgium (Flemish) Chile Chinese Taipei Croatia Czech Republic Denmark England Finland Georgia Germany Hong Kong SAR Hungary Iran, Islamic Rep. of Ireland Italy Japan Kazakhstan Korea, Rep. of Kuwait Lithuania Malta Morocco Netherlands New Zealand Northern Ireland Norway Oman Poland Portugal Qatar Romania Russian Federation Saudi Arabia Serbia Singapore Slovak Republic Slovenia Spain Sweden Thailand Tunisia Turkey United Arab Emirates United States Yemen International Avg.
r r
r
s r
r r r
r
r
97 (1.0) 12 (2.4) 46 (3.3) 95 (1.7) 82 (4.7) 37 (3.9) 32 (4.2) 96 (1.7) 94 (1.3) 81 (3.3) 43 (4.2) 4 (1.0) 94 (1.8) 99 (0.5) 28 (2.9) 95 (1.6) 89 (2.6) 94 (1.9) 38 (3.6) 70 (3.6) 82 (3.3) 87 (3.2) 96 (1.7) 93 (2.0) 92 (1.7) 34 (0.1) 91 (2.1) 74 (4.2) 5 (1.4) 9 (2.4) 83 (3.7) 58 (3.1) 69 (3.8) 62 (5.0) 75 (2.9) 94 (1.7) 94 (1.7) 96 (1.6) 77 (2.9) 68 (2.7) 92 (1.8) 89 (2.4) 87 (2.5) 36 (4.4) 69 (4.4) 44 (5.0) 93 (1.5) 75 (2.0) 46 (2.6) 89 (2.7) 70 (0.4)
Workbooks or Worksheets
As a Supplement
2 (0.8) 34 (3.6) 45 (3.2) 5 (1.6) 18 (4.7) 40 (4.0) 68 (4.1) 4 (1.7) 6 (1.3) 17 (3.2) 51 (4.2) 45 (5.0) 6 (1.5) 0 (0.4) 48 (3.5) 3 (1.6) 11 (2.6) 6 (1.9) 50 (3.7) 28 (3.5) 17 (3.2) 11 (2.9) 3 (1.6) 5 (1.8) 8 (1.7) 18 (0.1) 8 (1.9) 13 (3.0) 43 (3.0) 52 (4.6) 15 (3.5) 40 (3.0) 26 (3.5) 38 (5.0) 20 (3.1) 6 (1.7) 6 (1.7) 4 (1.5) 23 (2.9) 27 (2.5) 8 (1.8) 10 (2.2) 12 (2.5) 55 (4.3) 31 (4.4) 55 (4.9) 6 (1.4) 18 (2.1) 40 (2.6) 11 (2.7) 22 (0.4)
As Basis for Instruction
r r
r
s r
r r r
r
r
6 (1.7) 16 (3.2) 33 (2.9) 34 (3.8) 51 (4.5) 74 (3.6) 37 (4.1) 44 (4.1) 29 (3.4) 45 (3.8) 24 (3.8) 4 (1.6) 40 (3.0) 54 (4.1) 58 (3.5) 46 (4.7) 70 (3.3) 15 (3.3) 12 (2.3) 23 (3.3) 17 (3.2) 13 (2.8) 86 (2.9) 77 (3.7) 70 (3.6) 34 (0.1) 68 (3.4) 72 (4.4) 9 (1.8) 16 (3.0) 39 (5.2) 46 (3.1) 58 (3.8) 34 (4.0) 57 (2.9) 36 (4.1) 48 (4.2) 52 (4.0) 16 (3.1) 69 (2.6) 39 (3.0) 50 (3.8) 34 (3.7) 19 (3.8) 47 (4.5) 66 (3.8) 43 (3.0) 53 (2.4) 23 (2.0) 47 (4.7) 41 (0.5)
As a Supplement
58 (4.1) 76 (3.7) 66 (2.9) 65 (3.9) 48 (4.6) 26 (3.7) 58 (4.4) 56 (4.1) 71 (3.4) 52 (3.8) 65 (4.1) 82 (3.5) 54 (3.3) 46 (4.1) 41 (3.5) 54 (4.6) 28 (3.4) 79 (3.5) 85 (2.6) 76 (3.2) 76 (3.6) 86 (2.9) 13 (3.0) 23 (3.7) 30 (3.5) 58 (0.1) 28 (3.4) 26 (4.3) 81 (2.4) 82 (3.2) 61 (5.2) 54 (3.1) 42 (3.9) 64 (4.1) 42 (3.1) 64 (4.2) 51 (4.1) 47 (3.9) 82 (3.2) 31 (2.6) 59 (3.2) 48 (3.9) 64 (3.7) 68 (4.7) 52 (4.5) 33 (3.6) 56 (3.1) 46 (2.4) 71 (1.9) 50 (4.7) 56 (0.5)
Computer Software for Science Instruction
Science Equipment and Materials As Basis for Instruction
r r
r
s r
r r r
r
r
8 (2.6) 53 (4.4) 17 (2.4) 17 (3.0) 59 (4.3) 23 (3.4) 16 (3.2) 48 (4.2) 12 (2.4) 24 (3.8) 39 (3.7) 62 (4.9) 7 (1.9) 4 (1.5) 23 (2.9) 19 (3.3) 30 (3.4) 42 (3.5) 55 (3.8) 9 (2.0) 62 (4.0) 21 (3.2) 50 (4.0) 91 (2.3) 12 (2.2) 54 (0.1) 59 (5.0) 4 (1.8) 46 (3.3) 33 (4.8) 13 (2.7) 42 (2.9) 12 (2.6) 35 (4.9) 62 (3.2) 26 (3.1) 9 (1.9) 72 (3.9) 15 (2.7) 60 (2.5) 16 (2.4) 45 (3.8) 5 (1.9) 44 (4.7) 50 (4.4) 91 (2.5) 33 (3.3) 64 (2.0) 46 (2.7) 43 (4.8) 36 (0.5)
As a Supplement
73 (3.3) 46 (4.4) 81 (2.4) 78 (3.3) 39 (4.4) 76 (3.4) 62 (4.5) 52 (4.2) 88 (2.4) 75 (3.9) 60 (3.7) 38 (4.9) 90 (2.4) 77 (3.2) 75 (2.9) 80 (3.5) 69 (3.5) 57 (3.5) 45 (3.8) 74 (3.2) 38 (4.0) 75 (3.6) 50 (4.1) 9 (2.3) 84 (2.3) 39 (0.1) 28 (4.4) 78 (5.0) 50 (3.1) 66 (4.8) 82 (3.3) 56 (2.9) 70 (3.2) 60 (4.8) 38 (3.2) 72 (3.0) 88 (2.2) 24 (3.7) 79 (3.2) 40 (2.5) 83 (2.5) 55 (3.8) 82 (3.2) 53 (4.8) 48 (4.5) 7 (2.1) 65 (3.4) 35 (2.0) 53 (2.7) 37 (4.5) 60 (0.5)
As Basis for Instruction
r r
r
s r
r r r
r
r
3 (1.3) 7 (2.3) 2 (0.7) 7 (2.0) 28 (3.2) 5 (1.8) 6 (2.2) 28 (3.8) 4 (1.0) 4 (1.6) 9 (2.7) 15 (3.5) 1 (0.6) 2 (0.9) 1 (0.0) 36 (4.2) 5 (1.5) 2 (0.6) 8 (2.1) 3 (1.3) 2 (1.1) 10 (2.8) 36 (3.8) 28 (3.8) 10 (1.8) 28 (0.1) 7 (2.0) 3 (1.0) 13 (2.2) 11 (2.8) 12 (3.1) 6 (1.2) 3 (1.3) 4 (1.2) 44 (4.7) 5 (1.8) 3 (1.2) 36 (4.0) 3 (1.0) 19 (2.0) 5 (1.5) 4 (1.3) 4 (1.8) 3 (1.4) 12 (3.2) 10 (2.3) 19 (2.8) 31 (2.1) 8 (1.3) 2 (1.2) 11 (0.3)
( ) Standard errors appear in parentheses. Because of rounding some results may appear inconsistent. An “r” indicates data are available for at least 70% but less than 85% of the students. An “s” indicates data are available for at least 50% but less than 70% of the students.
402
TIMSS 2011 INTERNATIONAL RESULTS IN SCIENCE CHAPTER 8
As a Supplement
41 (4.5) 59 (4.4) 52 (3.7) 33 (3.6) 64 (3.7) 70 (3.6) 60 (4.6) 69 (3.7) 42 (3.3) 63 (3.9) 79 (3.5) 74 (3.6) 61 (3.1) 45 (4.1) 40 (3.2) 59 (4.4) 37 (3.6) 22 (3.8) 63 (3.3) 35 (3.6) 52 (4.2) 72 (3.6) 55 (3.7) 66 (3.9) 67 (2.9) 54 (0.1) 12 (2.6) 31 (5.5) 61 (3.4) 69 (4.1) 59 (5.0) 75 (2.7) 49 (4.1) 64 (4.5) 41 (5.1) 47 (3.8) 56 (2.9) 47 (4.5) 20 (3.1) 78 (2.3) 66 (3.0) 72 (3.4) 64 (3.2) 30 (4.4) 59 (4.3) 30 (4.4) 56 (3.1) 53 (2.3) 56 (2.6) 9 (2.1) 53 (0.5)
SOURCE: IEA’s Trends in International Mathematics and Science Study – TIMSS 2011
Reported by Teachers
Percent of Students Whose Teachers Use Textbooks
Country
As Basis for Instruction
Workbooks or Worksheets
As a Supplement
As Basis for Instruction
Computer Software for Science Instruction
Science Equipment and Materials
As a Supplement
As Basis for Instruction
As a Supplement
As Basis for Instruction
As a Supplement
Sixth Grade Participants Botswana Honduras Yemen
r
67 (4.7) 93 (2.2) 81 (3.7)
33 (4.7) 6 (2.0) 19 (3.7)
r
17 (3.8) 35 (4.0) 59 (3.5)
43 (4.9) 61 (4.3) 36 (3.6)
r
48 (4.7) 14 (3.3) 40 (4.4)
46 (4.9) 48 (3.9) 40 (3.9)
r
2 (1.1) 3 (1.4) 1 (0.6)
8 (2.4) 24 (4.3) 7 (1.8)
r r
2 (1.1) 33 (3.7) 23 (3.7) 70 (3.6) 57 (3.7) 64 (5.5) 26 (6.2)
22 (3.1) 54 (3.5) 40 (4.5) 16 (3.4) 36 (3.8) 34 (5.3) 45 (6.2)
r r
23 (3.1) 28 (3.4) 42 (4.3) 63 (3.8) 28 (1.8) 24 (4.8) 8 (3.5)
70 (3.6) 69 (3.4) 52 (4.5) 36 (3.8) 71 (1.9) 68 (5.4) 79 (5.2)
r r
72 (3.3) 36 (3.8) 31 (4.0) 68 (3.6) 56 (2.6) 32 (6.3) 62 (7.4)
28 (3.3) 61 (3.8) 66 (4.2) 31 (3.6) 44 (2.6) 62 (6.1) 34 (6.9)
r r
7 (2.0) 7 (1.7) 2 (1.2) 34 (4.0) 25 (2.4) 24 (5.6) 14 (4.3)
80 (3.6) 51 (3.9) 26 (3.4) 52 (4.4) 61 (2.3) 53 (5.5) 62 (6.2)
Benchmarking Participants Alberta, Canada Ontario, Canada Quebec, Canada Abu Dhabi, UAE Dubai, UAE Florida, US North Carolina, US
r s r
r s r
r s r
CLASSROOM INSTRUCTION CHAPTER 8
r s r
403
SOURCE: IEA’s Trends in International Mathematics and Science Study – TIMSS 2011
Exhibit 8.25: Resources Teachers Use for Teaching Science (Continued)
Exhibit 8.26: Resources Teachers Use for Teaching Science Percent of Students Whose Teachers Use Textbooks
Country
As Basis for Instruction
Armenia Australia Bahrain Chile Chinese Taipei England Finland Georgia Ghana Hong Kong SAR Hungary Indonesia Iran, Islamic Rep. of Israel Italy Japan Jordan Kazakhstan Korea, Rep. of Lebanon Lithuania Macedonia, Rep. of Malaysia Morocco New Zealand Norway Oman Palestinian Nat’l Auth. Qatar Romania Russian Federation Saudi Arabia Singapore Slovenia Sweden Syrian Arab Republic Thailand Tunisia Turkey Ukraine United Arab Emirates United States International Avg.
s
r
r
r
s
96 (0.8) 45 (3.5) 86 (2.3) 44 (4.3) 92 (1.9) 8 (1.9) 78 (2.0) 96 (0.9) 60 (3.3) 87 (3.4) 87 (1.4) 97 (1.2) 93 (1.9) 75 (2.9) 79 (3.1) 71 (3.9) 92 (2.1) 80 (2.0) 88 (2.5) 73 (3.0) 92 (1.4) 82 (2.1) 83 (2.5) 35 (2.2) 16 (2.9) 92 (2.5) 67 (3.1) 89 (2.5) 59 (3.2) 85 (1.8) 82 (1.4) 91 (2.5) 52 (2.3) 84 (1.5) 76 (3.0) 88 (2.4) 72 (3.4) 54 (3.6) 89 (2.0) 85 (1.8) 80 (1.7) 36 (3.2) 74 (0.4)
Workbooks or Worksheets
As a Supplement
4 (0.8) 51 (3.3) 14 (2.3) 56 (4.3) 7 (1.7) 78 (2.7) 22 (2.0) 4 (0.9) 39 (3.4) 12 (3.2) 13 (1.4) 3 (1.2) 7 (1.9) 20 (2.5) 20 (3.1) 29 (3.9) 8 (2.1) 19 (2.0) 12 (2.5) 26 (3.0) 8 (1.4) 17 (2.0) 16 (2.3) 64 (2.2) 77 (2.9) 8 (2.4) 33 (3.1) 11 (2.5) 39 (3.0) 15 (1.8) 18 (1.4) 7 (2.0) 39 (2.5) 15 (1.6) 23 (3.0) 12 (2.3) 27 (3.5) 44 (3.6) 11 (2.0) 15 (1.8) 17 (1.7) 60 (3.1) 24 (0.4)
As Basis for Instruction
s
r
r
r
s
29 (2.3) 34 (2.9) 49 (3.1) 28 (3.4) 31 (4.1) 21 (3.0) 26 (2.0) 55 (2.7) 18 (3.1) 42 (4.2) 47 (2.2) 22 (3.7) 7 (1.6) 63 (3.9) 20 (2.9) 30 (4.1) 36 (3.6) 17 (1.6) 34 (3.8) 56 (3.5) 40 (1.9) 16 (1.8) 39 (3.8) 50 (2.2) 23 (3.3) 25 (3.8) 33 (3.3) 35 (3.8) 61 (3.2) 53 (2.4) 18 (1.4) 46 (4.3) 66 (2.7) 38 (2.2) 14 (2.5) 39 (4.2) 47 (4.2) 53 (3.8) 44 (3.3) 17 (1.7) 51 (2.1) 12 (2.1) 35 (0.5)
As a Supplement
67 (2.5) 65 (2.9) 51 (3.1) 62 (4.0) 66 (4.0) 76 (3.2) 67 (2.3) 44 (2.8) 60 (3.6) 58 (4.2) 43 (2.2) 78 (3.7) 76 (2.6) 35 (3.8) 75 (3.1) 69 (4.0) 63 (3.6) 80 (1.7) 59 (4.1) 41 (3.5) 52 (2.2) 65 (2.7) 61 (3.8) 43 (2.3) 74 (3.5) 73 (4.0) 65 (3.3) 65 (3.8) 37 (3.0) 45 (2.4) 73 (1.6) 50 (4.1) 34 (2.7) 55 (2.3) 77 (3.0) 54 (4.1) 53 (4.2) 44 (3.7) 56 (3.3) 80 (1.8) 47 (2.1) 82 (2.3) 60 (0.5)
Computer Software for Science Instruction
Science Equipment and Materials As Basis for Instruction
s
r
r
r r
s
16 (1.8) 47 (4.3) 47 (2.9) 25 (3.4) 13 (2.4) 62 (3.7) 38 (2.1) 15 (1.7) 34 (3.8) 56 (4.2) 44 (2.2) 52 (4.1) 37 (3.9) 68 (3.6) 10 (2.3) 65 (4.2) 42 (3.2) 37 (2.4) 41 (3.8) 46 (3.6) 23 (1.6) 26 (2.1) 40 (3.4) 81 (2.0) 48 (3.9) 33 (4.1) 43 (3.3) 59 (3.9) 60 (3.3) 50 (2.5) 31 (1.6) 65 (4.0) 32 (2.8) 26 (1.8) 63 (3.3) 59 (3.3) 37 (3.9) 83 (2.6) 35 (3.2) 29 (2.4) 58 (2.4) 48 (3.0) 43 (0.5)
As a Supplement
78 (2.0) 53 (4.3) 50 (3.1) 65 (4.1) 86 (2.5) 37 (3.7) 62 (2.2) 77 (1.5) 50 (3.9) 44 (4.2) 55 (2.1) 47 (4.0) 60 (3.7) 29 (3.3) 73 (3.6) 35 (4.2) 55 (3.3) 62 (2.4) 57 (3.8) 49 (3.6) 73 (1.9) 69 (2.2) 59 (3.4) 15 (2.0) 52 (3.9) 66 (4.1) 57 (3.4) 40 (3.9) 38 (3.1) 47 (2.4) 67 (1.7) 30 (3.8) 67 (2.8) 69 (1.8) 37 (3.3) 39 (3.1) 63 (3.9) 13 (2.4) 62 (3.4) 67 (2.5) 41 (2.4) 52 (3.0) 54 (0.5)
As Basis for Instruction
s
r
r
r
s
5 (0.9) 12 (2.3) 28 (2.8) 13 (2.7) 9 (2.1) 29 (3.2) 3 (0.6) 3 (0.8) 1 (0.7) 32 (4.4) 7 (1.0) 4 (1.5) 7 (1.7) 27 (3.3) 4 (1.5) 3 (1.5) 11 (2.3) 24 (2.2) 50 (3.8) 13 (2.2) 13 (1.5) 20 (2.0) 33 (3.8) 14 (1.6) 14 (2.8) 4 (1.7) 11 (1.8) 8 (2.4) 45 (4.2) 16 (1.8) 13 (0.9) 42 (4.2) 23 (2.4) 20 (2.0) 1 (0.6) 21 (3.5) 10 (2.7) 7 (2.0) 17 (2.8) 4 (0.9) 30 (2.3) 19 (2.3) 16 (0.4)
( ) Standard errors appear in parentheses. Because of rounding some results may appear inconsistent. An “r” indicates data are available for at least 70% but less than 85% of the students. An “s” indicates data are available for at least 50% but less than 70% of the students. An “x” indicates data are available for less than 50% of students.
404
TIMSS 2011 INTERNATIONAL RESULTS IN SCIENCE CHAPTER 8
As a Supplement
75 (2.2) 77 (2.7) 70 (3.0) 67 (3.9) 69 (3.6) 67 (3.2) 64 (2.1) 66 (2.6) 16 (3.3) 62 (4.8) 55 (2.5) 59 (4.0) 34 (3.3) 53 (3.7) 47 (3.9) 49 (4.1) 66 (3.4) 73 (2.2) 46 (3.9) 47 (3.2) 74 (1.7) 67 (2.3) 59 (3.8) 46 (2.5) 70 (3.5) 79 (3.5) 77 (2.6) 70 (3.4) 47 (4.6) 63 (2.5) 75 (1.5) 45 (4.5) 69 (2.4) 74 (2.0) 47 (3.8) 35 (4.1) 74 (3.9) 45 (3.8) 72 (3.1) 65 (3.2) 59 (2.4) 67 (2.4) 61 (0.5)
SOURCE: IEA’s Trends in International Mathematics and Science Study – TIMSS 2011
Reported by Teachers
Percent of Students Whose Teachers Use Textbooks
Country
As Basis for Instruction
Workbooks or Worksheets
As a Supplement
As Basis for Instruction
Computer Software for Science Instruction
Science Equipment and Materials
As a Supplement
As Basis for Instruction
As a Supplement
As Basis for Instruction
As a Supplement
Ninth Grade Participants Botswana Honduras South Africa
43 (4.5) 68 (4.1) 66 (3.6)
57 (4.4) 28 (3.8) 28 (3.2)
47 (3.9) 54 (4.2) 41 (4.4) 70 (3.5) 74 (2.4) 34 (6.2) 53 (5.8) 30 (7.4) 24 (4.9) xx 37 (6.3) 39 (7.8) 34 (6.5) 34 (8.0)
50 (3.9) 44 (4.1) 55 (4.6) 26 (3.7) 21 (2.3) 62 (6.4) 46 (5.8) 64 (6.5) 72 (5.1) xx 60 (6.1) 57 (7.6) 63 (7.1) 60 (8.4)
34 (4.0) 29 (4.4) 39 (3.8)
46 (4.1) 60 (5.2) 52 (3.7)
20 (3.0) 15 (3.0) 44 (4.3) 58 (3.5) 35 (2.4) 7 (3.1) 22 (4.0) 6 (3.4) 13 (4.1) xx 14 (5.2) 13 (4.6) 19 (5.7) 21 (7.3)
75 (3.4) 78 (3.3) 53 (4.4) 39 (3.6) 63 (2.4) 90 (3.2) 73 (4.6) 89 (4.1) 85 (4.5) xx 82 (6.3) 85 (4.8) 76 (5.9) 74 (7.5)
73 (4.0) 25 (4.5) 20 (3.0)
25 (3.9) 65 (5.1) 69 (3.6)
41 (3.8) 34 (3.5) 46 (4.2) 59 (3.6) 53 (4.6) 50 (7.9) 36 (5.4) 63 (6.7) 52 (6.3) xx 40 (5.7) 62 (7.2) 60 (6.5) 38 (6.9)
58 (3.9) 66 (3.5) 53 (4.2) 39 (3.7) 47 (4.6) 50 (7.9) 64 (5.4) 37 (6.7) 47 (6.4) xx 60 (5.7) 38 (7.2) 40 (6.5) 62 (6.9)
1 (1.0) 1 (0.6) 3 (1.0)
35 (4.2) 22 (3.3) 17 (2.9)
24 (3.4) 5 (1.9) 6 (1.9) 31 (3.9) 34 (4.6) 17 (5.1) 18 (4.2) 7 (3.1) 20 (5.6) xx 8 (3.0) 11 (3.6) 21 (5.7) 22 (5.1)
60 (3.7) 69 (4.1) 40 (4.1) 57 (4.4) 61 (4.6) 77 (6.1) 65 (4.9) 82 (3.6) 65 (6.0) xx 77 (5.5) 69 (6.6) 71 (6.7) 68 (7.3)
Benchmarking Participants Alberta, Canada Ontario, Canada Quebec, Canada Abu Dhabi, UAE Dubai, UAE Alabama, US California, US Colorado, US Connecticut, US Florida, US Indiana, US Massachusetts, US Minnesota, US North Carolina, US
r r s s s s s s r s
r r s s s s s s r s
r r s s s s s s r s
CLASSROOM INSTRUCTION CHAPTER 8
r r s s s s s s r s
405
SOURCE: IEA’s Trends in International Mathematics and Science Study – TIMSS 2011
Exhibit 8.26: Resources Teachers Use for Teaching Science (Continued)
Teacher Emphasis on Science Investigation As noted in the TIMSS 2011 Science Assessment Framework, one of the ways in which students have been encouraged to build upon their knowledge and understanding of science is through the process of scientific inquiry, and, as documented in the TIMSS 2011 Encyclopedia, the contemporary science curricula of many countries place considerable emphasis on engaging students in this process. For example, the most recent recommendations for effective instructional practices of the US National Research Council include an emphasis on inquiry activities (National Research Council, 2011). A recent meta-analysis across 138 studies indicated that using some level of inquirybased instruction had a positive relationship with student understanding and retention of science content. In particular, instruction emphasizing active thinking and drawing conclusions from data or providing hands-on experience with scientific phenomena were associated with increased likelihood of scientific understanding (Minner, Levy, & Century, 2009). Previous TIMSS studies have presented teachers’ reports about the frequency with which they engaged in a range of inquiry-related activities. TIMSS 2011 takes this approach further, using IRT scales to summarize teacher reports at the fourth and eighth grades. The Emphasize Science Investigation scale at the fourth grade is based on teacher reports of how often, in teaching science, teachers ask students to engage in the following six activities:
406
Observe natural phenomena such as the weather or a plant growing and describe what they see;
Watch me (the teacher) demonstrate an experiment or investigation;
Design or plan experiments or investigations;
Conduct experiments or investigations;
Give explanations about something they are studying; and
Relate what they are learning in science to their daily lives.
TIMSS 2011 INTERNATIONAL RESULTS IN SCIENCE CHAPTER 8
Exhibit 8.27 presents the results for the fourth grade assessment. Students were categorized according to their teachers’ responses, with About Half the Lessons or More corresponding to teachers who used all six activities in “about half the lessons,” on average. All other students had teachers who emphasized science investigation in Less than Half the Lessons. As shown in the exhibit, teachers of science at the fourth grade vary widely across countries in their use of inquiry activities, with the percentage of students taught by teachers emphasizing science investigation in About Half the Lessons or More ranging from 4 percent in Norway to 80 to 86 percent in Iran and Tunisia. On average across the fourth grade countries, 40 percent of students were taught by teachers emphasizing science investigation in half tof he lessons or more, and 60 percent had teachers emphasizing investigation less frequently. This pattern was similar among the sixth grade and benchmarking participants. There was no relationship between emphasis on science investigation and average science achievement. Exhibit 8.28 presents the results for the eighth grade on the Emphasize Science Investigation scale, which includes the six instructional activities from the fourth grade scale and one additional activity more suited to eighth grade students: “Use scientific formulas and laws to solve routine problems.” Compared to the fourth grade, there was greater use of investigation in science instruction, with almost half of the students (48%) taught by teachers emphasizing investigation in About Half the Lessons or More. Although on average across countries, science achievement was somewhat higher among students whose teachers more frequently emphasize inquiry activities (479 vs. 474), both the frequency of inquiry activity use and its relationship with science achievement varied considerably across the eighth grade, ninth grade, and benchmarking participants.
CLASSROOM INSTRUCTION CHAPTER 8
407
Reported by Teachers Students were scored according to their teachers’ responses to how often they used each of six instructional activities on the Emphasize Science Investigation scale. Students with teachers who emphasized science investigation in About Half the Lessons or More had a score on the scale of at least 10.7, which corresponds to their teachers using all six activities in “about half the lessons,” on average. All other students had teachers who emphasized science investigation in Less than Half the Lessons.
About Half the Lessons or More
Country Tunisia Iran, Islamic Rep. of United Arab Emirates Oman Thailand Bahrain Kuwait Saudi Arabia Romania Qatar Korea, Rep. of Morocco Turkey Chinese Taipei Japan Azerbaijan Singapore Italy Kazakhstan Chile Serbia Ireland Georgia United States England Armenia Portugal Australia Slovenia Yemen Russian Federation Slovak Republic Lithuania Denmark Malta Sweden Spain Hungary Croatia Czech Republic New Zealand Finland Northern Ireland Germany Hong Kong SAR Poland Austria Belgium (Flemish) Netherlands Norway International Avg.
r
r
r r r r
s r
r
r
Less than Half the Lessons
Percent of Students
Average Achievement
Percent of Students
Average Achievement
86 (2.8) 80 (2.6) 75 (2.0) 75 (3.1) 74 (4.2) 74 (4.2) 73 (3.6) 70 (4.0) 65 (3.6) 63 (3.6) 58 (4.8) 57 (4.8) 55 (3.6) 54 (3.9) 51 (4.2) 51 (4.0) 50 (2.6) 49 (3.2) 47 (3.9) 45 (4.2) 45 (3.8) 43 (3.6) 43 (3.7) 41 (2.9) 41 (4.7) 36 (4.5) 34 (4.1) 34 (4.0) 33 (3.2) 32 (4.6) 32 (3.3) 29 (3.3) 27 (3.4) 26 (4.0) 25 (0.1) 24 (4.1) 23 (3.5) 22 (3.1) 21 (2.7) 20 (3.3) 20 (2.4) 13 (2.3) 13 (3.1) 12 (2.5) 12 (3.0) 11 (2.3) 8 (1.8) 7 (1.6) 5 (2.2) 4 (1.6) 40 (0.5)
349 (5.9) 452 (4.7) 426 (3.2) 384 (4.3) 482 (5.4) 454 (4.5) 349 (5.9) 434 (5.7) 508 (6.4) 394 (8.0) 588 (2.7) 265 (7.2) 472 (5.6) 557 (2.9) 558 (2.3) 434 (7.2) 585 (4.6) 523 (4.1) 498 (6.9) 478 (5.2) 518 (3.8) 519 (4.5) 455 (5.7) 548 (3.3) 535 (7.5) 409 (6.5) 525 (7.2) 535 (5.9) 517 (3.5) 210 (10.2) 554 (5.1) 534 (6.6) 518 (5.2) 536 (4.9) 446 (3.3) 535 (6.3) 512 (6.0) 527 (7.9) 513 (4.7) 538 (4.7) 498 (6.5) 580 (4.9) 510 (12.2) 520 (7.2) 536 (9.3) 494 (9.1) 534 (8.1) 518 (8.9) 542 (9.2) 493 (9.2) 488 (0.9)
14 (2.8) 20 (2.6) 25 (2.0) 25 (3.1) 26 (4.2) 26 (4.2) 27 (3.6) 30 (4.0) 35 (3.6) 37 (3.6) 42 (4.8) 43 (4.8) 45 (3.6) 46 (3.9) 49 (4.2) 49 (4.0) 50 (2.6) 51 (3.2) 53 (3.9) 55 (4.2) 55 (3.8) 57 (3.6) 57 (3.7) 59 (2.9) 59 (4.7) 64 (4.5) 66 (4.1) 66 (4.0) 67 (3.2) 68 (4.6) 68 (3.3) 71 (3.3) 73 (3.4) 74 (4.0) 75 (0.1) 76 (4.1) 77 (3.5) 78 (3.1) 79 (2.7) 80 (3.3) 80 (2.4) 87 (2.3) 87 (3.1) 88 (2.5) 88 (3.0) 89 (2.3) 92 (1.8) 93 (1.6) 95 (2.2) 96 (1.6) 60 (0.5)
323 (11.2) 455 (8.9) 442 (6.1) 361 (8.3) 441 (13.6) 436 (9.3) 341 (8.1) 419 (11.5) 497 (10.1) 391 (11.3) 585 (2.9) 256 (7.7) 451 (7.4) 546 (3.3) 559 (3.0) 442 (9.3) 582 (4.9) 528 (3.5) 493 (7.6) 484 (4.4) 514 (4.7) 513 (4.4) 455 (5.2) 541 (3.2) 524 (4.4) 420 (5.1) 520 (4.1) 511 (4.7) 522 (3.6) 206 (9.2) 551 (4.4) 530 (4.1) 513 (2.9) 527 (3.8) 447 (1.9) 535 (3.7) 504 (3.4) 535 (4.3) 517 (2.3) 536 (2.9) 499 (2.4) 570 (2.7) 518 (4.0) 531 (2.9) 535 (4.4) 506 (2.5) 531 (3.0) 508 (2.0) 530 (2.4) 494 (2.5) 484 (0.9)
Average Scale Score 12.1 (0.17) 11.9 (0.13) 11.5 (0.10) 11.4 (0.10) 11.3 (0.17) 11.3 (0.19) 11.2 (0.14) 11.2 (0.17) 11.0 (0.13) 10.9 (0.12) 10.7 (0.16) 10.8 (0.21) 10.6 (0.15) 10.4 (0.17) 10.4 (0.16) 10.4 (0.10) 10.4 (0.11) 10.5 (0.11) 10.4 (0.11) 10.4 (0.15) 10.5 (0.12) 10.0 (0.13) 10.2 (0.08) 9.9 (0.10) 10.0 (0.15) 10.0 (0.13) 9.8 (0.22) 9.1 (0.21) 9.8 (0.11) 9.6 (0.17) 10.0 (0.09) 9.8 (0.10) 9.9 (0.10) 9.1 (0.15) 9.5 (0.00) 9.0 (0.19) 9.8 (0.10) 9.5 (0.12) 9.9 (0.08) 9.4 (0.10) 8.6 (0.13) 9.1 (0.10) 8.0 (0.16) 8.8 (0.11) 8.7 (0.12) 8.7 (0.13) 8.2 (0.10) 8.6 (0.10) 8.3 (0.14) 7.5 (0.15)
Centerpoint of scale set at 10. ( ) Standard errors appear in parentheses. Because of rounding some results may appear inconsistent. An “r” indicates data are available for at least 70% but less than 85% of the students. An “s” indicates data are available for at least 50% but less than 70% of the students.
408
TIMSS 2011 INTERNATIONAL RESULTS IN SCIENCE CHAPTER 8
SOURCE: IEA’s Trends in International Mathematics and Science Study – TIMSS 2011
Exhibit 8.27: Teachers Emphasize Science Investigation Exhibit 8.27: Teachers Emphasize Science Investigation
About Half the Lessons or More
Country
Less than Half the Lessons Average Achievement
Average Scale Score
Percent of Students
Average Achievement
Percent of Students
48 (4.6) 45 (4.4) 29 (4.3)
377 (10.8) 442 (7.4) 354 (12.0)
52 (4.6) 55 (4.4) 71 (4.3)
371 (7.8) 421 (9.9) 341 (8.8)
10.6 (0.19) 10.4 (0.14) 9.7 (0.15)
78 (3.9) 73 (2.0) 48 (4.5) 44 (6.2) 42 (5.6) 36 (4.6) 32 (3.7)
413 (5.2) 454 (4.2) 545 (4.4) 534 (7.0) 546 (7.1) 522 (3.8) 527 (5.2)
22 (3.9) 27 (2.0) 52 (4.5) 56 (6.2) 58 (5.6) 64 (4.6) 68 (3.7)
415 (14.2) 494 (6.6) 539 (4.4) 537 (5.4) 542 (5.7) 513 (3.0) 527 (3.4)
11.6 (0.17) 11.4 (0.10) 10.0 (0.14) 9.9 (0.23) 10.0 (0.24) 9.7 (0.18) 9.4 (0.12)
Sixth Grade Participants Botswana Honduras Yemen Benchmarking Participants Abu Dhabi, UAE Dubai, UAE Alberta, Canada North Carolina, US Florida, US Quebec, Canada Ontario, Canada
r r r s
In teaching science to the students in this class, how often do you usually ask them to do the following? Every or almost every lesson
About half the lessons
Some lessons
Never
5) Give explanations about something they are studying ---- A
A A A A A
A A A A A
A A A A A
6) Relate what they are learning in science to their daily lives ---------------------------------------------------------------- A
A
A
A
1) Observe natural phenomena such as the weather or a plant growing and describe what they see ------------------ A 2) Watch me demonstrate an experiment or investigation --- A 3) Design or plan experiments or investigations ---------------- A 4) Conduct experiments or investigations ------------------------ A
About Half the Lessons or More
SOURCE: IEA’s Trends in International Mathematics and Science Study – TIMSS 2011
Exhibit 8.27: Teachers Emphasize Science Investigation (Continued)
Less than Half the Lessons 10.7
T5r42193
CLASSROOM INSTRUCTION CHAPTER 8
409
Reported by Teachers Students were scored according to their teachers’ responses to how often they used each of seven instructional activities on the Emphasize Science Investigation scale. Students with teachers who emphasized science investigation in About Half the Lessons or More had a score on the scale of at least 10.2, which corresponds to their teachers using all seven activities in “about half the lessons,” on average. All other students had teachers who emphasized science investigation in Less than Half the Lessons.
About Half the Lessons or More
Country Jordan Tunisia Palestinian Nat'l Auth. Oman Lebanon Qatar Saudi Arabia Thailand Ghana Romania Iran, Islamic Rep. of Morocco United Arab Emirates Syrian Arab Republic Turkey Kazakhstan Indonesia Malaysia Bahrain Ukraine Macedonia, Rep. of United States Chile Georgia Israel Russian Federation England Armenia Hong Kong SAR Korea, Rep. of New Zealand Australia Finland Japan Italy Singapore Hungary Sweden Lithuania Chinese Taipei Slovenia Norway International Avg.
r s
r
s
r
Less than Half the Lessons
Percent of Students
Average Achievement
Percent of Students
Average Achievement
82 (2.9) 74 (3.6) 72 (3.7) 71 (3.2) 70 (2.5) 69 (3.3) 67 (3.7) 67 (4.2) 67 (4.2) 65 (2.2) 65 (3.3) 64 (2.3) 62 (2.5) 59 (3.7) 59 (3.6) 58 (2.4) 54 (3.6) 53 (3.8) 52 (2.7) 52 (2.7) 51 (2.2) 47 (2.4) 47 (4.1) 47 (2.2) 38 (3.4) 38 (2.1) 37 (2.9) 36 (2.4) 36 (4.0) 35 (3.8) 35 (3.6) 34 (3.2) 32 (2.0) 32 (4.3) 29 (3.1) 29 (2.7) 28 (2.1) 26 (3.3) 24 (1.7) 21 (3.4) 20 (1.4) 5 (1.9) 48 (0.5)
453 (4.9) 440 (3.0) 429 (4.2) 425 (4.3) 405 (5.6) 423 (6.4) 438 (4.8) 449 (5.0) 310 (7.2) 466 (3.9) 479 (4.8) 380 (2.8) 458 (3.3) 424 (5.0) 482 (5.4) 492 (5.3) 405 (7.0) 433 (7.4) 462 (3.6) 503 (3.8) 419 (6.2) 537 (5.2) 462 (3.8) 420 (3.8) 505 (7.4) 548 (3.1) 544 (9.1) 443 (4.8) 553 (6.1) 565 (3.3) 510 (7.1) 523 (10.6) 558 (2.9) 559 (4.2) 502 (4.7) 595 (9.2) 523 (3.7) 508 (6.6) 512 (4.1) 552 (6.4) 545 (3.1) 468 (18.1) 479 (0.9)
18 (2.9) 26 (3.6) 28 (3.7) 29 (3.2) 30 (2.5) 31 (3.3) 33 (3.7) 33 (4.2) 33 (4.2) 35 (2.2) 35 (3.3) 36 (2.3) 38 (2.5) 41 (3.7) 41 (3.6) 42 (2.4) 46 (3.6) 47 (3.8) 48 (2.7) 48 (2.7) 49 (2.2) 53 (2.4) 53 (4.1) 53 (2.2) 62 (3.4) 62 (2.1) 63 (2.9) 64 (2.4) 64 (4.0) 65 (3.8) 65 (3.6) 66 (3.2) 68 (2.0) 68 (4.3) 71 (3.1) 71 (2.7) 72 (2.1) 74 (3.3) 76 (1.7) 79 (3.4) 80 (1.4) 95 (1.9) 52 (0.5)
436 (10.5) 433 (4.6) 403 (6.4) 406 (9.5) 405 (7.6) 410 (13.5) 434 (6.0) 453 (9.0) 299 (8.9) 462 (4.8) 465 (6.3) 370 (3.4) 468 (4.7) 430 (5.9) 483 (5.9) 489 (5.1) 406 (5.3) 417 (9.6) 444 (3.1) 498 (4.1) 407 (6.5) 524 (4.2) 459 (4.4) 420 (3.3) 526 (5.4) 539 (3.7) 525 (6.4) 435 (3.6) 526 (5.1) 557 (2.4) 513 (6.3) 528 (6.0) 549 (2.6) 557 (3.0) 502 (3.4) 588 (5.2) 522 (3.3) 512 (3.0) 515 (2.7) 567 (2.8) 542 (2.9) 495 (2.5) 474 (0.9)
Centerpoint of scale set at 10. ( ) Standard errors appear in parentheses. Because of rounding some results may appear inconsistent. An “r” indicates data are available for at least 70% but less than 85% of the students. An “s” indicates data are available for at least 50% but less than 70% of the students. An “x” indicates data are available for less than 50% of students.
410
TIMSS 2011 INTERNATIONAL RESULTS IN SCIENCE CHAPTER 8
Average Scale Score 11.3 (0.14) 11.1 (0.16) 11.3 (0.18) 11.0 (0.12) 11.0 (0.12) 10.9 (0.18) 10.7 (0.16) 10.7 (0.16) 11.1 (0.22) 10.8 (0.10) 10.7 (0.11) 10.8 (0.08) 10.7 (0.12) 10.3 (0.12) 10.5 (0.13) 10.5 (0.09) 10.3 (0.12) 10.2 (0.14) 10.4 (0.09) 10.1 (0.07) 10.3 (0.11) 9.7 (0.10) 10.0 (0.14) 10.1 (0.08) 9.5 (0.15) 9.7 (0.07) 9.4 (0.12) 9.7 (0.06) 9.4 (0.16) 9.6 (0.10) 9.3 (0.11) 9.2 (0.14) 9.3 (0.09) 9.3 (0.16) 9.4 (0.11) 9.1 (0.09) 9.2 (0.07) 8.8 (0.13) 9.3 (0.05) 8.6 (0.17) 8.7 (0.06) 7.5 (0.16)
SOURCE: IEA’s Trends in International Mathematics and Science Study – TIMSS 2011
Exhibit 8.28: Teachers Emphasize Science Investigation Exhibit 8.28: Teachers Emphasize Science Investigation
About Half the Lessons or More
Country
Less than Half the Lessons
Average Scale Score
Percent of Students
Average Achievement
Percent of Students
Average Achievement
53 (4.5) 52 (4.3) 38 (3.8)
375 (6.9) 405 (5.6) 316 (7.9)
47 (4.5) 48 (4.3) 62 (3.8)
363 (6.0) 403 (5.7) 339 (6.2)
10.3 (0.17) 10.3 (0.17) 9.8 (0.16)
62 (4.2) 61 (6.4) 60 (5.1) 55 (5.5) 47 (8.1) 43 (6.5) 40 (6.1) 38 (5.8) 37 (7.2) 34 (6.2) 29 (3.8) 27 (3.4) 22 (3.6) xx
459 (5.4) 483 (10.8) 474 (5.5) 546 (8.7) 516 (17.3) 531 (6.7) 508 (11.1) 540 (11.5) 558 (16.4) 588 (11.6) 548 (4.3) 518 (5.4) 520 (5.3) xx
38 (4.2) 39 (6.4) 40 (5.1) 45 (5.5) 53 (8.1) 57 (6.5) 60 (6.1) 62 (5.8) 63 (7.2) 66 (6.2) 71 (3.8) 73 (3.4) 78 (3.6) xx
465 (7.0) 488 (9.5) 490 (6.9) 541 (9.0) 536 (13.3) 532 (5.7) 503 (8.3) 535 (9.0) 550 (5.1) 552 (8.2) 545 (2.7) 521 (3.6) 521 (3.4) xx
10.4 (0.17) 10.5 (0.30) 10.8 (0.27) 9.9 (0.19) 9.6 (0.23) 9.6 (0.19) 9.3 (0.25) 9.5 (0.22) 9.4 (0.22) 8.9 (0.30) 9.2 (0.13) 9.2 (0.12) 8.8 (0.12) xx
Ninth Grade Participants Honduras Botswana South Africa Benchmarking Participants Abu Dhabi, UAE Alabama, US Dubai, UAE Colorado, US North Carolina, US Indiana, US California, US Connecticut, US Minnesota, US Massachusetts, US Alberta, Canada Quebec, Canada Ontario, Canada Florida, US
s r s s s s s r s r
SOURCE: IEA’s Trends in International Mathematics and Science Study – TIMSS 2011
Exhibit 8.28: Teachers Emphasize Science Investigation (Continued)
In teaching science to the students in this class, how often do you usually ask them to do the following? Every or almost every lesson
About half the lessons
Some lessons
Never
A A A A
A A A A
A A A A
6) Give explanations about something they are studying ---- A
A A
A A
A A
7) Relate what they are learning in science to their daily lives ---------------------------------------------------------------- A
A
A
A
1) Observe natural phenomena and describe what they see ------------------------------------------------------------------ A 2) Watch me demonstrate an experiment or investigation --- A 3) Design or plan experiments or investigations ---------------- A 4) Conduct experiments or investigations ------------------------ A 5) Use scientific formulas and laws to solve routine problems ---------------------------------------------------------------- A
About Half the Lessons or More
Less than Half the Lessons 10.2
CLASSROOM INSTRUCTION CHAPTER 8
411
Computer Activities During Science Lessons According to the TIMSS 2011 Encyclopedia, countries are investing in technology as a way to enhance teaching and learning. Availability of computers and other technology in the science classroom can facilitate successful implementation of the curriculum. For example, as described in the Contextual Framework chapter of the TIMSS 2011 Assessment Frameworks, computers and the Internet provide students ways to explore concepts in-depth, trigger enthusiasm and motivation for learning, enable students to learn at their own pace, and provide students with access to vast information sources. Besides giving students access to the Internet, computers can serve a number of other educational purposes. While initially limited to learning drills and practice, they are now used in a variety of ways including tutorials, simulations, games, and applications. New software enables students to pose their own problems and explore and discover mathematics and scientific properties on their own. Computer software for modeling and visualization of ideas can open a whole new world to students and help them connect these ideas to their language and symbol systems. A recent study summarizing 25 metaanalyses determined that computer use in the classroom has a significant positive effect on achievement at all grade levels and in all subjects (Tamim, Bernard, Borokhovski, Abrami, & Schmidt, 2011). Exhibit 8.29 contains teachers’ reports about the prevalence and types of computer-based activities used as part of science instruction at fourth grade. The range of computer availability across countries was very large, from 7 percent of the students in Iran to 85 percent in New Zealand. Internationally, on average, less than half (47%) of the fourth grade students had computers available during their science lessons. Average science achievement was equivalent between those fourth grade students with computers available and those without computers available. Teachers reported that 24 to 25 percent of the fourth grade students, on average, were asked to use a computer at least monthly to do scientific procedures or experiments or to study natural phenomena through simulations. Somewhat larger percentages were asked to use a computer at least monthly to look up ideas and information (41%) and to practice skills and procedures (31%). The range in computer availability across the benchmarking participants reflected the fourth grade results across countries. However, the students participating at the sixth grade had less access to computers for science instruction than did the fourth grade TIMSS students, on average.
412
TIMSS 2011 INTERNATIONAL RESULTS IN SCIENCE CHAPTER 8
At the eighth grade, reports about computer availability and use were similar to those at the fourth grade (see Exhibit 8.30). Internationally, on average, less than half (46%) of the eighth grade students had computers available during their science lessons, ranging from 12 percent in Ghana to 84 percent in Kazakhstan. Students with computers available during their lessons had slightly higher science achievement than students without computers available. Approximately one-third (28–39%) of the eighth grade students, on average, were asked to do the following on at least a monthly basis: look up ideas and information, do scientific procedures or experiments, study natural phenomena through simulations, process and analyze data, and practice skills and procedures. As would be anticipated, computer use in science lessons varied considerably across countries at the eighth grade, as well as for the benchmarking participants. Countries participating at the ninth grade had less computer availability, including South Africa, Botswana, and Honduras.
CLASSROOM INSTRUCTION CHAPTER 8
413
Reported by Teachers
Computers Available for Science Lessons Percent of Students
Country
Yes
New Zealand Belgium (Flemish) Denmark Northern Ireland Australia Malta Japan England Austria Norway Sweden Kazakhstan Finland United States Netherlands Chinese Taipei Singapore Ireland Hong Kong SAR Germany Chile Czech Republic Qatar Lithuania Portugal Slovak Republic Slovenia Azerbaijan United Arab Emirates Spain Bahrain Turkey Hungary Korea, Rep. of Kuwait Russian Federation Italy Thailand Romania Georgia Saudi Arabia Poland Oman Armenia Tunisia Yemen Croatia Serbia Morocco Iran, Islamic Rep. of International Avg.
r r r
r r r
r
r
r
85 (2.3) 84 (2.9) 81 (2.6) 78 (3.5) 77 (3.4) 74 (0.1) 74 (3.7) 74 (4.3) 73 (3.4) 72 (3.9) 68 (4.7) 67 (3.6) 66 (3.1) 65 (2.6) 64 (4.7) 63 (4.1) 62 (2.5) 62 (3.6) 61 (4.3) 61 (3.5) 59 (4.3) 53 (4.0) 51 (3.6) 49 (3.8) 47 (5.3) 45 (3.2) 41 (3.7) 41 (3.6) 40 (2.7) 40 (3.8) 37 (4.1) 36 (3.4) 36 (3.5) 35 (3.6) 34 (4.0) 33 (3.7) 31 (3.2) 29 (4.0) 28 (3.5) 25 (2.9) 24 (3.3) 19 (3.1) 18 (2.1) 18 (3.2) 16 (3.1) 15 (3.1) 15 (2.3) 13 (2.6) 9 (2.2) 7 (1.8) 47 (0.5)
Percent of Students Whose Teachers Have Them Use Computers At Least Monthly
Average Achievement Yes
No
497 (2.8) 510 (2.1) 530 (3.3) 519 (3.6) 520 (4.5) 438 (2.2) 558 (2.2) 531 (3.8) 533 (2.8) 494 (2.9) 538 (3.2) 484 (6.3) 572 (2.9) 544 (2.8) 527 (3.3) 553 (3.0) 579 (4.3) 518 (4.5) 531 (5.1) 533 (3.4) 485 (4.2) 537 (3.8) 382 (8.4) 517 (4.4) 528 (7.6) 537 (4.0) 523 (3.4) 446 (8.3) 427 (4.7) 510 (4.7) 454 (6.1) 491 (4.8) 523 (6.2) 589 (3.5) 347 (7.6) 556 (6.6) 528 (4.0) 469 (9.3) 509 (11.2) 464 (8.0) 421 (10.0) 496 (5.4) 390 (9.4) 418 (7.0) 317 (12.0) 196 (22.0) 514 (4.9) 511 (8.9) 285 (12.5) 512 (17.5) 488 (1.0)
505 (5.5) 502 (6.4) 526 (7.5) 511 (6.3) 519 (6.0) 471 (2.7) 562 (3.5) 519 (9.3) 527 (6.0) 495 (3.4) 528 (6.5) 513 (9.6) 570 (3.2) 544 (3.7) 534 (3.9) 549 (3.9) 590 (6.0) 513 (5.0) 541 (5.7) 523 (4.0) 475 (5.3) 536 (2.9) 406 (9.1) 512 (3.2) 516 (4.2) 527 (5.9) 518 (3.4) 434 (7.7) 429 (3.8) 502 (3.4) 447 (4.8) 447 (5.9) 539 (4.5) 586 (2.3) 347 (6.3) 550 (3.8) 525 (3.5) 472 (7.4) 502 (6.7) 452 (4.6) 432 (6.9) 507 (2.9) 375 (4.8) 416 (4.9) 350 (5.6) 212 (7.7) 516 (2.3) 516 (3.4) 257 (5.5) 448 (4.2) 486 (0.8)
To Do Scientific Procedures or Experiments
To Look Up Ideas and Information
s r r
r r r
r
r
r
79 (2.5) 78 (3.3) 71 (3.4) 73 (3.9) 72 (3.8) 65 (0.1) 40 (4.2) 68 (5.0) 60 (3.5) 61 (4.6) 49 (4.6) 62 (3.7) 59 (3.7) 51 (2.5) 58 (5.0) 53 (4.1) 56 (2.8) 55 (3.9) 49 (4.2) 54 (3.2) 51 (4.0) 45 (4.1) 50 (3.7) 45 (4.1) 46 (5.3) 42 (3.2) 37 (3.6) 30 (3.7) 36 (2.5) 33 (3.5) 36 (4.1) 35 (3.4) 34 (3.5) 25 (3.3) 31 (4.1) 28 (2.8) 28 (3.1) 26 (3.9) 23 (3.5) 23 (2.9) 21 (3.2) 16 (2.8) 15 (1.9) 13 (2.6) 14 (3.0) 8 (2.7) 13 (2.2) 10 (2.1) 5 (1.6) 5 (1.5) 41 (0.5)
s r r
r r r
r
r
r
42 (3.3) 21 (3.3) 25 (3.7) 47 (4.0) 42 (3.4) 50 (0.1) 15 (3.1) 40 (4.8) 20 (2.6) 22 (3.9) 11 (3.1) 58 (3.5) 17 (2.7) 31 (2.1) 13 (3.4) 44 (4.0) 44 (2.8) 29 (3.5) 43 (3.9) 14 (2.4) 33 (3.4) 22 (3.4) 45 (3.6) 30 (3.3) 29 (3.9) 17 (2.3) 12 (2.1) 24 (3.7) 33 (2.5) 21 (3.2) 32 (4.1) 34 (3.3) 14 (2.5) 20 (3.0) 28 (3.9) 20 (2.5) 21 (2.8) 20 (3.5) 21 (3.2) 13 (2.5) 15 (3.0) 7 (2.0) 11 (1.6) 11 (2.5) 12 (2.8) 7 (2.7) 7 (1.5) 7 (1.5) 4 (1.3) 6 (1.6) 24 (0.4)
To Study Natural Phenomena Through Simulations
s r s
r r r
r
r
r
47 (2.9) 26 (3.4) 37 (4.5) 42 (4.3) 48 (4.2) 39 (0.1) 35 (4.3) 51 (5.1) 20 (2.8) 22 (3.6) 10 (2.5) 52 (3.7) 15 (2.2) 34 (2.0) 16 (3.4) 46 (4.1) 39 (3.0) 35 (3.4) 39 (4.3) 15 (2.4) 37 (4.0) 16 (3.0) 45 (3.4) 21 (2.8) 30 (4.2) 24 (2.7) 20 (2.7) 28 (3.7) 33 (2.6) 20 (3.3) 32 (3.9) 28 (3.4) 15 (2.6) 23 (3.4) 29 (4.1) 19 (2.4) 18 (2.7) 24 (3.7) 21 (3.3) 15 (2.7) 15 (2.6) 11 (2.5) 12 (1.9) 10 (2.4) 11 (2.5) 8 (2.8) 5 (1.4) 7 (1.6) 4 (1.0) 4 (1.3) 25 (0.4)
( ) Standard errors appear in parentheses. Because of rounding some results may appear inconsistent. An “r” indicates data are available for at least 70% but less than 85% of the students. An “s” indicates data are available for at least 50% but less than 70% of the students.
414
TIMSS 2011 INTERNATIONAL RESULTS IN SCIENCE CHAPTER 8
To Practice Skills and Procedures
s r r
r r r
r
r
r
40 (3.3) 56 (3.8) 45 (3.9) 53 (4.4) 38 (3.5) 59 (0.1) 18 (3.1) 43 (4.8) 32 (3.3) 38 (4.4) 21 (3.5) 64 (3.5) 42 (3.5) 34 (2.3) 27 (4.5) 46 (4.2) 49 (2.9) 30 (3.5) 43 (4.0) 23 (2.9) 42 (3.8) 37 (4.2) 47 (3.3) 41 (3.8) 39 (4.3) 43 (3.2) 21 (3.0) 30 (3.7) 33 (2.4) 29 (3.5) 35 (4.0) 35 (3.3) 27 (3.2) 23 (3.3) 30 (4.0) 31 (3.5) 23 (2.9) 23 (3.7) 23 (3.5) 22 (2.9) 18 (3.2) 13 (2.8) 12 (1.7) 13 (2.7) 14 (3.0) 7 (2.7) 12 (2.3) 8 (1.9) 7 (1.8) 5 (1.5) 31 (0.5)
SOURCE: IEA’s Trends in International Mathematics and Science Study – TIMSS 2011
Exhibit 8.29: Computer Activities During Science Lessons
Computers Available for Science Lessons Percent of Students
Country
Yes
Percent of Students Whose Teachers Have Them Use Computers At Least Monthly
Average Achievement Yes
No
13 (3.2) 6 (1.6) 6 (1.4)
368 (15.3) 416 (34.0) 447 (7.0)
342 (8.0) 371 (6.2) 431 (6.6)
79 (4.5) 79 (5.9) 75 (4.1) 52 (3.8) 50 (4.0) 47 (3.9) 39 (4.4)
541 (4.5) 537 (5.7) 544 (3.5) 531 (3.9) 522 (3.6) 465 (7.2) 411 (9.3)
552 (12.5) 534 (11.0) 535 (4.6) 522 (4.2) 511 (3.4) 465 (7.3) 414 (7.0)
To Do Scientific Procedures or Experiments
To Look Up Ideas and Information
To Study Natural Phenomena Through Simulations
To Practice Skills and Procedures
Sixth Grade Participants Yemen Botswana Honduras
5 (2.1) 3 (0.7) 5 (1.5)
5 (2.0) 3 (0.7) 5 (1.5)
5 (2.0) 3 (0.7) 4 (1.7)
4 (1.8) 3 (0.7) 5 (1.5)
Benchmarking Participants Florida, US North Carolina, US Alberta, Canada Ontario, Canada Quebec, Canada Dubai, UAE Abu Dhabi, UAE
s r r r
s r r r r
66 (5.3) 75 (6.1) 69 (4.3) 48 (3.9) 47 (3.9) 43 (3.9) 38 (4.4)
s r r r r
49 (4.8) 50 (6.6) 43 (4.6) 25 (3.4) 25 (3.3) 36 (4.0) 36 (4.5)
CLASSROOM INSTRUCTION CHAPTER 8
s r r r r
50 (5.4) 50 (7.7) 48 (4.8) 25 (3.1) 23 (3.0) 38 (3.9) 34 (4.4)
415
s r r r r
50 (5.8) 38 (6.5) 49 (4.4) 29 (3.6) 28 (3.8) 38 (3.9) 36 (4.3)
SOURCE: IEA’s Trends in International Mathematics and Science Study – TIMSS 2011
Exhibit 8.29: Computer Activities During Science Lessons (Continued)
Reported by Teachers
Computers Available for Science Lessons Percent of Students
Country
Yes
Kazakhstan Norway Macedonia, Rep. of Australia Chile Korea, Rep. of United States England Finland Sweden Romania Singapore Lithuania Russian Federation Georgia Japan Ukraine Jordan Hungary Armenia Qatar Slovenia Israel United Arab Emirates Turkey Chinese Taipei Palestinian Nat’l Auth. New Zealand Bahrain Italy Hong Kong SAR Syrian Arab Republic Saudi Arabia Indonesia Thailand Iran, Islamic Rep. of Oman Morocco Tunisia Malaysia Lebanon Ghana International Avg.
r s s r r
r
84 (2.3) 77 (3.6) 71 (2.8) 71 (2.8) 70 (3.5) 68 (3.5) 67 (2.7) 63 (3.3) 59 (2.5) 57 (3.8) 57 (3.0) 56 (2.5) 55 (2.3) 52 (2.7) 52 (3.1) 50 (4.3) 50 (3.7) 49 (3.5) 48 (2.6) 48 (3.2) 48 (3.0) 47 (2.4) 46 (4.2) 42 (2.3) 40 (3.5) 40 (4.3) 40 (3.7) 39 (4.1) 38 (3.1) 36 (3.2) 34 (4.1) 33 (4.3) 31 (3.9) 31 (4.1) 31 (4.1) 31 (3.3) 21 (2.7) 19 (1.7) 19 (3.2) 17 (3.3) 14 (1.8) 12 (2.8) 46 (0.5)
Percent of Students Whose Teachers Have Them Use Computers At Least Monthly
Average Achievement Yes
489 (4.4) 495 (2.9) 411 (5.9) 522 (6.2) 460 (3.5) 562 (2.4) 536 (4.1) 529 (7.6) 552 (2.8) 514 (3.4) 468 (4.5) 584 (6.2) 511 (3.2) 546 (4.2) 420 (4.9) 559 (3.6) 503 (4.8) 457 (5.8) 515 (4.6) 447 (4.4) 426 (10.4) 543 (2.8) 530 (6.2) 462 (3.8) 499 (6.9) 557 (4.9) 432 (6.2) 499 (6.5) 466 (4.8) 509 (5.0) 526 (8.1) 420 (7.6) 446 (8.4) 390 (9.5) 455 (7.9) 500 (8.7) 440 (7.7) 397 (5.7) 449 (8.0) 447 (13.1) 421 (12.1) 308 (14.8) 481 (1.0)
To Look Up Ideas and Information
No
500 (8.5) 490 (5.3) 409 (9.8) 536 (9.2) 463 (5.2) 556 (3.6) 516 (5.8) 538 (5.7) 553 (2.7) 509 (4.4) 460 (4.6) 598 (6.3) 518 (3.1) 539 (3.7) 419 (3.9) 557 (3.4) 498 (4.1) 441 (6.0) 528 (4.0) 430 (4.3) 409 (6.4) 543 (3.2) 508 (6.2) 461 (3.5) 473 (3.9) 568 (3.1) 412 (4.1) 519 (6.4) 446 (3.1) 497 (3.2) 540 (4.6) 427 (4.9) 433 (4.3) 411 (4.5) 449 (5.3) 462 (4.0) 414 (4.0) 372 (2.4) 436 (2.7) 421 (6.8) 402 (4.8) 307 (6.0) 475 (0.8)
r s s r r
r
r
81 (2.3) 72 (3.9) 66 (3.0) 66 (3.6) 60 (3.9) 52 (3.4) 59 (2.7) 57 (3.1) 49 (2.7) 53 (3.7) 52 (3.1) 42 (2.5) 49 (2.4) 45 (2.6) 50 (3.3) 15 (3.1) 43 (3.8) 48 (3.6) 45 (2.4) 44 (3.3) 47 (2.6) 40 (2.3) 39 (4.1) 41 (2.3) 38 (3.4) 24 (3.5) 38 (3.8) 37 (4.0) 34 (3.2) 30 (3.0) 24 (4.0) 28 (4.1) 30 (3.9) 21 (3.5) 28 (3.8) 21 (3.4) 21 (2.7) 15 (1.6) 11 (2.7) 17 (3.2) 10 (1.8) 5 (1.5) 39 (0.5)
To Study Natural Phenomena Through Simulations
To Do Scientific Procedures or Experiments
r s s r r
r
r
r
77 (2.6) 35 (4.0) 59 (3.0) 40 (4.5) 43 (3.7) 51 (3.4) 39 (2.6) 25 (2.5) 18 (2.2) 14 (3.0) 43 (2.9) 27 (2.5) 33 (2.2) 26 (2.2) 41 (3.1) 2 (1.2) 21 (2.7) 44 (3.6) 25 (2.0) 34 (3.1) 43 (2.5) 21 (1.9) 24 (3.5) 37 (2.3) 35 (3.2) 24 (3.6) 34 (3.6) 13 (2.5) 33 (3.4) 13 (2.5) 23 (3.9) 28 (3.9) 29 (3.8) 19 (3.5) 23 (3.6) 23 (3.4) 13 (2.1) 13 (1.6) 6 (2.0) 15 (3.0) 9 (1.8) 4 (1.4) 28 (0.5)
r s s r r
r
r
73 (2.9) 42 (4.4) 61 (3.0) 44 (3.8) 42 (3.7) 49 (3.7) 44 (2.4) 37 (2.9) 20 (2.3) 17 (2.8) 43 (2.9) 31 (2.7) 28 (2.0) 27 (2.3) 41 (3.1) 13 (2.8) 20 (2.9) 42 (3.8) 29 (2.2) 29 (2.8) 44 (2.9) 30 (2.2) 28 (3.7) 36 (2.5) 36 (3.6) 21 (3.5) 33 (3.8) 25 (3.7) 32 (3.1) 14 (2.4) 19 (3.7) 28 (4.1) 29 (3.9) 19 (3.7) 25 (3.7) 18 (2.9) 16 (2.3) 15 (1.5) 10 (2.5) 17 (3.2) 9 (1.6) 4 (1.3) 30 (0.5)
To Process and Analyze Data
r s s r r
r
r
r
79 (2.5) 34 (4.1) 63 (3.0) 49 (3.9) 54 (4.0) 45 (3.2) 46 (2.4) 41 (3.2) 31 (2.4) 30 (3.7) 42 (2.9) 26 (2.4) 41 (2.4) 34 (2.6) 45 (3.3) 8 (2.4) 24 (3.0) 39 (3.6) 30 (2.3) 39 (3.0) 40 (2.9) 29 (2.2) 27 (3.7) 36 (2.4) 31 (3.2) 18 (3.2) 28 (3.6) 21 (3.2) 30 (3.1) 20 (2.9) 22 (3.8) 28 (4.1) 27 (3.8) 19 (3.5) 26 (3.7) 17 (3.0) 15 (2.4) 12 (1.5) 11 (2.5) 15 (3.0) 9 (1.7) 4 (1.4) 31 (0.5)
( ) Standard errors appear in parentheses. Because of rounding some results may appear inconsistent. An “r” indicates data are available for at least 70% but less than 85% of the students. An “s” indicates data are available for at least 50% but less than 70% of the students. An “x” indicates data are available for less than 50% of students.
416
TIMSS 2011 INTERNATIONAL RESULTS IN SCIENCE CHAPTER 8
To Practice Skills and Procedures
r s s r r
r
r
r
82 (2.4) 54 (4.4) 64 (3.0) 47 (4.5) 48 (3.7) 48 (3.6) 43 (2.6) 31 (3.5) 36 (2.5) 23 (3.5) 51 (3.1) 31 (2.6) 44 (2.4) 47 (2.6) 47 (3.1) 4 (1.5) 37 (3.5) 46 (3.5) 36 (2.4) 43 (3.2) 46 (2.7) 31 (2.3) 34 (3.8) 38 (2.2) 33 (3.4) 23 (3.6) 34 (3.7) 23 (3.4) 35 (3.1) 18 (2.6) 19 (3.9) 26 (4.0) 30 (3.9) 17 (3.3) 24 (3.4) 19 (2.9) 17 (2.5) 13 (1.5) 11 (2.4) 14 (2.9) 10 (1.8) 5 (1.5) 33 (0.5)
SOURCE: IEA’s Trends in International Mathematics and Science Study – TIMSS 2011
Exhibit 8.30: Computer Activities During Science Lessons
Computers Available for Science Lessons Percent of Students
Country
Yes
Percent of Students Whose Teachers Have Them Use Computers At Least Monthly
Average Achievement Yes
To Look Up Ideas and Information
No
To Study Natural Phenomena Through Simulations
To Do Scientific Procedures or Experiments
To Process and Analyze Data
To Practice Skills and Procedures
Ninth Grade Participants South Africa Botswana Honduras
17 (2.6) 13 (3.0) 9 (3.0)
325 (13.3) 407 (8.6) 378 (17.4)
330 (4.4) 402 (4.1) 368 (4.5)
79 (3.3) 68 (5.7) 64 (6.9) 62 (6.6) 61 (7.4) 59 (8.2) 58 (5.7) 56 (4.2) 56 (6.9) 52 (2.6) 47 (4.2) 42 (7.2) 38 (4.5) xx
545 (2.8) 531 (5.7) 553 (8.8) 547 (8.7) 537 (11.8) 573 (12.3) 505 (11.2) 520 (3.7) 533 (9.2) 493 (4.8) 526 (4.7) 490 (16.1) 453 (6.9) xx
549 (4.6) 533 (8.8) 553 (7.5) 545 (9.3) 516 (17.4) 547 (12.0) 505 (5.6) 522 (4.6) 541 (13.4) 465 (5.0) 515 (4.0) 481 (5.2) 466 (6.0) xx
7 (1.6) 9 (2.4) 8 (2.9)
7 (1.7) 5 (1.6) 3 (1.2)
7 (1.7) 5 (1.8) 3 (1.2)
7 (1.7) 5 (2.1) 3 (1.3)
7 (1.8) 6 (2.1) 7 (2.9)
Benchmarking Participants Alberta, Canada Indiana, US Minnesota, US Colorado, US North Carolina, US Massachusetts, US California, US Ontario, Canada Connecticut, US Dubai, UAE Quebec, Canada Alabama, US Abu Dhabi, UAE Florida, US
s r s s s s r s r s
s r s s s r s r s
73 (3.7) 60 (5.3) 57 (7.0) 52 (7.1) 61 (7.4) 47 (9.6) xx 53 (4.3) 47 (7.3) 52 (2.6) 38 (4.2) 34 (7.4) 35 (4.3) xx
s r s s s r s r s
55 (4.3) 32 (6.0) 40 (7.7) 41 (6.0) 44 (7.1) 27 (7.5) xx 36 (4.2) 31 (5.4) 41 (4.6) 18 (2.9) 24 (6.3) 32 (4.2) xx
s r s s s r s r s
55 (4.1) 40 (6.0) 53 (7.1) 41 (6.3) 40 (7.3) 37 (8.1) xx 32 (4.0) 37 (6.8) 45 (2.6) 21 (3.2) 24 (7.1) 31 (4.5) xx
CLASSROOM INSTRUCTION CHAPTER 8
s r s s s r s r s r
55 (4.1) 41 (5.3) 44 (7.3) 46 (6.6) 54 (7.1) 37 (8.4) xx 36 (4.2) 35 (6.2) 46 (3.5) 24 (3.7) 22 (6.5) 30 (4.3) xx
417
s r s s s r s r s
55 (3.9) 41 (6.3) 43 (7.8) 43 (7.7) 47 (7.2) 31 (7.2) xx 33 (4.0) 34 (6.3) 47 (2.8) 24 (3.9) 28 (7.7) 33 (4.2) xx
SOURCE: IEA’s Trends in International Mathematics and Science Study – TIMSS 2011
Exhibit 8.30: Computer Activities During Science Lessons (Continued)
Science Homework Homework is a way to extend instruction and assess student progress. TIMSS has consistently shown that the amount of homework assigned for mathematics and science varies both within and across countries. In some situations, homework is assigned typically to students who need it the most to keep up to their classmates. In other situations, students receive homework for practice or as an enrichment exercise. Because of the different approaches and policies associated with assigning homework, it generally shows mixed results in relation to average student achievement. The eighth grade students in TIMSS were asked how often their teacher gives homework in science (or biology, chemistry, physics, and earth science for separate science countries) and how much time they usually spend on it when it is given. Weekly time on science homework was estimated by multiplying the frequency of assignment by the amount of time spent. Exhibit 8.31 presents the results, with countries ordered by the percentage of students reporting they spent 3 hours or more per week. However, spending as much time as this on science homework was relatively rare. Among countries teaching science as general or integrated subject, the range was from a high of 11 percent of students in Malaysia to 1 percent in England and Korea and to zero in Japan. It should be mentioned that although students in several of the high-performing East Asian countries report relatively small amounts of homework, many of them attend special tutoring schools. On average, internationally, only 5 percent of the eighth grade students reported doing as much as 3 hours of science homework per week, and these students had the lowest average science achievement. The majority of students (67%) reported doing 45 minutes or less of weekly science homework, and a further 29 percent reported doing more than 45 minutes but less than 3 hours—these students had the highest average science achievement. Both Botswana and South Africa at the ninth grade had relatively high percentages of students reporting 3 hours of science homework per week, although the percentages for benchmarking participants were more comparable to the international averages at eighth grade. For each of the four science subjects, eighth grade students in separate science countries reported about the same amount of homework as students in general or integrated science countries reported for science overall. This means, of course, that the total time spent on science homework by students in separate science countries is a lot more than in general or integrated science
418
TIMSS 2011 INTERNATIONAL RESULTS IN SCIENCE CHAPTER 8
Reported by Students The general/integrated science panel summarizes responses for countries where students are enrolled in science as a single subject. The remaining panels for biology, chemistry, physics, and earth science summarize responses for countries where students are taught science as separate subjects. Weekly Time Students Spend on General/Integrated Science Homework
General/Integrated Science
3 Hours or More
Country Malaysia Thailand Ghana Jordan Turkey Palestinian Nat’l Auth. Bahrain Iran, Islamic Rep. of Chinese Taipei Singapore Italy Tunisia Qatar Oman United Arab Emirates Israel Chile United States Saudi Arabia Norway New Zealand Hong Kong SAR Australia England Korea, Rep. of Japan International Avg.
More than 45 Minutes but Less than 3 Hours Average Achievement
45 Minutes or Less
Percent of Students
Average Achievement
Percent of Students
Percent of Students
Average Achievement
11 (0.6) 10 (0.6) 9 (0.6) 8 (0.5) 8 (0.5) 7 (0.7) 6 (0.6) 6 (0.5) 6 (0.6) 6 (0.4) 5 (0.5) 4 (0.4) 4 (0.4) 4 (0.4) 4 (0.2) 4 (0.4) 4 (0.4) 3 (0.3) 3 (0.4) 3 (0.3) 2 (0.5) 2 (0.3) 2 (0.2) 1 (0.2) 1 (0.2) 0 (0.1) 5 (0.1)
417 (6.3) 449 (5.7) 293 (6.4) 447 (6.6) 466 (5.1) 388 (9.4) 415 (9.9) 471 (10.5) 565 (7.4) 609 (6.2) 478 (7.6) 416 (6.2) 398 (11.1) 373 (10.3) 443 (6.6) 499 (10.7) 446 (7.3) 518 (6.3) 401 (13.6) 465 (11.0) ~~ ~~ ~~ ~~ ~~ ~~ 448 (1.9)
52 (1.1) 52 (1.1) 38 (1.3) 32 (0.9) 39 (1.0) 31 (1.3) 25 (1.0) 30 (0.9) 39 (1.3) 49 (0.9) 35 (1.3) 20 (0.7) 28 (1.0) 17 (0.7) 25 (0.7) 23 (1.1) 29 (1.0) 24 (0.8) 14 (0.9) 36 (1.5) 19 (1.6) 24 (1.3) 17 (1.0) 26 (1.4) 8 (1.0) 10 (1.2) 29 (0.2)
437 (6.1) 455 (4.4) 323 (6.0) 464 (3.8) 487 (3.5) 424 (4.1) 465 (4.8) 476 (5.1) 580 (2.9) 603 (3.7) 502 (3.5) 428 (3.3) 445 (6.7) 411 (5.2) 479 (3.2) 511 (5.2) 456 (2.8) 533 (4.0) 425 (4.8) 494 (3.4) 533 (5.9) 540 (3.9) 535 (6.8) 555 (5.4) 541 (4.8) 553 (6.1) 487 (0.9)
37 (1.3) 38 (1.1) 53 (1.3) 61 (1.1) 54 (1.1) 62 (1.6) 69 (1.0) 64 (1.1) 55 (1.5) 46 (1.0) 60 (1.5) 76 (0.9) 68 (1.1) 79 (0.9) 71 (0.7) 74 (1.4) 68 (1.1) 73 (0.9) 83 (1.1) 62 (1.6) 79 (1.7) 74 (1.4) 81 (1.1) 73 (1.5) 91 (1.2) 90 (1.3) 67 (0.2)
420 (8.2) 450 (4.2) 306 (6.0) 456 (3.8) 487 (4.3) 427 (3.5) 457 (2.5) 474 (3.9) 555 (2.6) 576 (5.7) 504 (3.1) 445 (2.6) 414 (3.4) 432 (3.0) 464 (2.6) 522 (4.4) 466 (2.9) 525 (2.6) 441 (3.8) 498 (3.0) 512 (4.7) 536 (3.7) 519 (4.8) 528 (5.3) 563 (2.1) 559 (2.6) 482 (0.8)
13 (0.7) 10 (0.7) –- –-
308 (7.3) 364 (5.0) –- –-
39 (0.7) 35 (0.9) –- –-
346 (4.3) 412 (3.9) –- –-
48 (0.8) 55 (1.1) –- –-
338 (3.9) 415 (3.9) –- –-
8 (1.5) 5 (1.0) 5 (0.8) 4 (0.4) 4 (0.4) 4 (0.6) 3 (0.5) 3 (1.0) 3 (0.6) 3 (0.5) 2 (0.3) 2 (0.4) 2 (0.2) 1 (0.3)
559 (10.3) 516 (12.1) 492 (10.9) 462 (8.4) 439 (11.7) 524 (9.4) 540 (6.6) 537 (17.7) 526 (12.8) 557 (12.9) ~~ ~~ ~~ ~~
41 (2.3) 34 (2.6) 32 (1.7) 33 (0.7) 22 (1.3) 23 (2.0) 28 (1.4) 22 (1.8) 29 (2.0) 23 (1.9) 14 (1.4) 16 (1.3) 24 (1.6) 13 (1.0)
574 (6.0) 539 (6.4) 511 (4.6) 502 (4.0) 471 (6.7) 541 (11.1) 544 (3.9) 530 (7.3) 556 (7.2) 552 (9.1) 490 (11.3) 534 (8.5) 524 (4.2) 519 (5.3)
51 (2.6) 61 (3.0) 64 (2.0) 63 (0.8) 74 (1.4) 73 (2.3) 69 (1.7) 75 (2.3) 68 (2.5) 74 (2.1) 84 (1.5) 82 (1.6) 75 (1.7) 86 (1.1)
563 (5.5) 536 (5.2) 496 (5.8) 481 (2.5) 462 (4.5) 531 (6.2) 549 (2.3) 536 (4.2) 556 (4.4) 527 (7.4) 489 (5.9) 546 (4.8) 521 (2.7) 522 (2.4)
Ninth Grade Participants South Africa Botswana Honduras Benchmarking Participants Massachusetts, US Connecticut, US California, US Dubai, UAE Abu Dhabi, UAE North Carolina, US Alberta, Canada Indiana, US Minnesota, US Florida, US Alabama, US Colorado, US Ontario, Canada Quebec, Canada
r
( ) Standard errors appear in parentheses. Because of rounding some results may appear inconsistent. A dash (–) indicates comparable data are not available. A tilde (~) indicates insufficient data to report achievement. An “r” indicates data are available for at least 70% but less than 85% of the students.
CLASSROOM INSTRUCTION CHAPTER 8
419
SOURCE: IEA’s Trends in International Mathematics and Science Study – TIMSS 2011
Exhibit 8.31: Weekly Time Students Spend on Science Homework
A. How often does your teacher give you homework in ? 1) Every day 2) 3 or 4 times a week 3) 1 or 2 times a week 4) Less than once a week 5) Never
SOURCE: IEA’s Trends in International Mathematics and Science Study – TIMSS 2011
Time Students SpendHomework on Science (Continued) Homework (Continued) Exhibit 8.31:Exhibit Weekly8.31: TimeWeekly Students Spend on Science B. When your teacher gives you homework, about how many minutes do you usually spend on your homework? 1) My teacher never gives me homework 2) 1-15 minutes 3) 16-30 minutes 4) 31-60 minutes 5) 61-90 minutes 6) More than 90 minutes
The weekly time spent on homework was calculated by multiplying how often students were given homework weekly by the minutes they spent on that homework. The values for Part A were: Every day = 5; 3 or 4 times a week = 3.5; 1 or 2 times a week = 1.5; Less than once a week = 0.5; and Never = 0. The values for Part B were: My teacher never gives me homework = 0; 1-15 minutes = 8; 16-30 minutes = 23; 31-60 minutes = 45; 61-90 minutes = 75; and More than 90 minutes = 105.
Separate Science Panels Weekly Time Students Spend on Biology Homework
3 Hours or More
Biology
Percent of Students
Country Kazakhstan Russian Federation Georgia Syrian Arab Republic Ukraine Armenia Indonesia Morocco Lebanon Lithuania Hungary Macedonia, Rep. of Romania Sweden Slovenia Finland
r
r r
17 (0.9) 8 (0.6) 7 (0.7) 7 (0.5) 7 (0.7) 7 (0.5) 5 (0.5) 4 (0.3) 4 (0.5) 4 (0.3) 3 (0.4) 2 (0.3) 2 (0.3) 2 (0.2) 1 (0.2) 1 (0.2)
Average Achievement
482 (7.0) 518 (5.9) 424 (7.2) 410 (5.8) 489 (6.3) 437 (7.9) 409 (6.2) 367 (6.0) 360 (8.2) 486 (8.8) 496 (9.0) ~~ ~~ ~~ ~~ ~~
More than 45 Minutes but Less than 3 Hours Percent of Students
41 (1.1) 35 (0.9) 25 (1.3) 27 (0.8) 35 (1.4) 30 (1.0) 35 (1.0) 24 (0.6) 20 (1.2) 17 (1.0) 17 (0.8) 15 (1.0) 12 (0.8) 16 (0.9) 8 (0.8) 11 (0.8)
T5r41509
420
TIMSS 2011 INTERNATIONAL RESULTS IN SCIENCE CHAPTER 8
Average Achievement
490 (4.7) 540 (3.6) 437 (4.1) 427 (4.0) 498 (4.5) 440 (4.8) 416 (5.4) 383 (3.3) 396 (6.4) 502 (4.2) 509 (4.7) 382 (6.6) 447 (5.7) 508 (4.4) 524 (7.1) 541 (4.8)
45 Minutes or Less Percent of Students
42 (1.4) 57 (1.0) 68 (1.7) 66 (1.0) 58 (1.7) 63 (1.1) 61 (1.0) 72 (0.8) 76 (1.3) 79 (1.2) 79 (1.1) 82 (1.1) 86 (0.9) 82 (0.9) 91 (0.9) 88 (0.8)
Average Achievement
498 (4.7) 549 (3.2) 432 (3.0) 435 (4.1) 507 (3.6) 444 (3.4) 408 (4.9) 384 (2.6) 414 (5.4) 520 (2.6) 531 (2.8) 424 (5.2) 474 (3.5) 518 (2.5) 548 (2.6) 556 (2.6)
Exhibit 8.31: Weekly Time Students Spend on Science Homework (Continued)
3 Hours or More
Chemistry Country Kazakhstan Russian Federation Ukraine Armenia Syrian Arab Republic Lithuania Romania Macedonia, Rep. of Morocco Hungary Lebanon Indonesia Slovenia Finland Sweden Georgia International Avg.
r r r r
More than 45 Minutes but Less than 3 Hours
Percent of Students
Average Achievement
Percent of Students
30 (1.1) 15 (0.7) 12 (0.8) 12 (0.7) 8 (0.6) 7 (0.6) 6 (0.7) 5 (0.5) 5 (0.3) 4 (0.4) 4 (0.4) 3 (0.3) 3 (0.5) 2 (0.2) 2 (0.2) –– 8 (0.2)
486 (5.6) 528 (4.4) 484 (5.6) 432 (4.6) 420 (6.0) 497 (6.4) 450 (11.1) 371 (11.4) 363 (5.6) 495 (7.9) 381 (11.0) 388 (9.0) 499 (10.1) ~~ ~~ –– 446 (2.2)
48 (1.0) 47 (0.9) 40 (1.2) 36 (1.0) 33 (0.9) 28 (1.1) 22 (1.1) 23 (1.2) 25 (0.7) 19 (1.0) 22 (1.2) 24 (1.1) 13 (0.9) 15 (0.8) 17 (1.0) –– 27 (0.3)
Average Achievement
499 (4.3) 545 (3.6) 503 (4.0) 443 (3.9) 432 (4.0) 513 (3.6) 475 (5.5) 409 (7.3) 383 (3.3) 513 (5.0) 390 (6.4) 410 (6.0) 527 (4.6) 545 (3.4) 509 (3.8) –– 473 (1.2)
45 Minutes or Less Percent of Students
22 (1.0) 38 (1.1) 48 (1.4) 53 (1.3) 59 (1.1) 65 (1.5) 72 (1.6) 72 (1.5) 70 (0.7) 77 (1.3) 74 (1.4) 73 (1.2) 85 (1.3) 83 (0.9) 82 (1.0) –– 65 (0.3)
Average Achievement
484 (5.9) 548 (3.5) 508 (3.9) 444 (3.6) 432 (4.5) 519 (2.7) 471 (3.5) 424 (5.3) 385 (2.7) 530 (3.0) 415 (5.3) 413 (3.9) 549 (2.8) 556 (2.6) 519 (2.6) –– 480 (1.0)
Weekly Time Students Spend on Physics Homework
3 Hours or More
Physics Country Kazakhstan Russian Federation Georgia Ukraine Armenia Syrian Arab Republic Lithuania Macedonia, Rep. of Morocco Slovenia Indonesia Romania Lebanon Hungary Finland Sweden International Avg.
r
More than 45 Minutes but Less than 3 Hours
Percent of Students
Average Achievement
Percent of Students
26 (1.1) 13 (0.9) 13 (0.7) 12 (0.8) 11 (0.6) 9 (0.6) 7 (0.6) 7 (0.7) 7 (0.3) 6 (0.8) 6 (0.5) 6 (0.5) 4 (0.5) 4 (0.4) 2 (0.2) 2 (0.2) 8 (0.2)
485 (6.2) 530 (7.0) 437 (4.9) 498 (7.6) 434 (5.5) 419 (5.0) 498 (6.7) 370 (11.4) 364 (5.9) 523 (6.8) 403 (6.2) 445 (9.0) 371 (9.6) 488 (6.8) ~~ ~~ 448 (1.9)
45 (1.2) 42 (1.1) 36 (1.1) 41 (1.2) 36 (0.8) 29 (0.8) 26 (1.0) 23 (1.1) 26 (0.7) 23 (1.0) 40 (1.2) 21 (1.2) 25 (1.1) 17 (1.0) 14 (0.9) 17 (0.9) 29 (0.3)
Average Achievement
497 (4.7) 546 (3.1) 440 (3.2) 503 (4.0) 446 (3.9) 431 (4.6) 513 (3.9) 411 (6.9) 383 (3.6) 533 (4.3) 420 (4.4) 468 (6.2) 400 (6.4) 512 (4.5) 548 (3.9) 511 (4.1) 473 (1.1)
45 Minutes or Less Percent of Students
29 (1.1) 45 (1.3) 51 (1.4) 48 (1.6) 53 (1.0) 62 (1.0) 66 (1.5) 70 (1.4) 67 (0.7) 71 (1.4) 54 (1.3) 74 (1.5) 71 (1.2) 80 (1.2) 84 (0.9) 81 (1.0) 63 (0.3)
Average Achievement
491 (4.9) 545 (4.0) 426 (3.1) 505 (3.7) 442 (3.5) 433 (4.5) 519 (2.7) 423 (5.2) 383 (2.5) 550 (2.9) 404 (5.6) 472 (3.5) 413 (5.3) 530 (2.9) 557 (2.5) 519 (2.6) 476 (1.0)
Weekly Time Students Spend on Earth Science Homework
3 Hours or More
Earth Science Country Kazakhstan Georgia Armenia Russian Federation Syrian Arab Republic Ukraine Lithuania Indonesia Morocco Hungary Romania Macedonia, Rep. of Sweden Slovenia Finland Lebanon International Avg.
r r r r r r
More than 45 Minutes but Less than 3 Hours
Percent of Students
Average Achievement
Percent of Students
17 (0.9) 8 (1.3) 8 (0.6) 7 (0.6) 7 (0.6) 7 (0.5) 6 (0.5) 4 (0.5) 4 (0.3) 3 (0.4) 3 (0.3) 3 (0.4) 2 (0.3) 2 (0.2) 1 (0.2) –– 6 (0.1)
477 (6.0) 432 (6.7) 438 (6.5) 520 (6.3) 404 (6.1) 485 (7.4) 491 (6.7) 401 (6.4) 363 (6.5) 500 (7.4) 433 (10.2) 369 (14.8) ~~ ~~ ~~ –– 443 (2.3)
39 (1.0) 25 (1.0) 29 (1.0) 32 (0.9) 24 (0.9) 33 (1.3) 25 (1.1) 30 (1.0) 25 (0.7) 16 (0.8) 13 (0.9) 12 (0.8) 16 (0.9) 7 (0.5) 11 (0.8) –– 23 (0.2)
Average Achievement
491 (4.8) 437 (4.5) 438 (4.7) 539 (3.8) 423 (4.6) 499 (4.9) 509 (3.4) 414 (4.9) 378 (2.6) 512 (4.6) 462 (6.0) 390 (8.6) 506 (4.4) 519 (5.5) 541 (4.3) –– 470 (1.3)
45 Minutes or Less Percent of Students
43 (1.1) 67 (1.5) 64 (1.3) 60 (1.1) 68 (1.1) 60 (1.4) 69 (1.4) 65 (1.2) 71 (0.8) 81 (1.0) 84 (1.0) 85 (0.8) 82 (1.0) 91 (0.7) 88 (0.8) –– 72 (0.3)
CLASSROOM INSTRUCTION CHAPTER 8
Average Achievement
499 (4.7) 435 (3.2) 445 (3.2) 549 (3.3) 436 (4.3) 509 (3.4) 520 (2.8) 409 (5.3) 386 (2.8) 529 (3.0) 473 (3.4) 422 (5.1) 519 (2.5) 548 (2.7) 556 (2.5) –– 482 (0.9) 421
SOURCE: IEA’s Trends in International Mathematics and Science Study – TIMSS 2011
Weekly Time Students Spend on Chemistry Homework
countries. However, there was an inverse relationship between time spent on homework and average science achievement in the separate science countries, with average achievement highest among students spending 45 minutes or less on each subject. Science Classroom Assessment Teachers have a number of informal and formal ways to evaluate student learning. Informal assessments during instruction help teachers identify the needs of particular individuals, gauge the pace of instruction, and signal the need to adapt or reteach. Formal tests typically are used to make important decisions about the students, such as grades or marks. Exhibit 8.32 presents teachers’ reports about how often they give eighth grade students science tests or examinations. Internationally, on average, the eighth grade students were tested fairly regularly in science—35 percent at least every two weeks, and 41 percent about monthly. Just 24 percent were tested less often, approximately a few times a year.
422
TIMSS 2011 INTERNATIONAL RESULTS IN SCIENCE CHAPTER 8
The exhibit also contains teachers’ reports about the types of questions they included in their tests and examinations. Most frequently, the test questions involved application of knowledge and understanding, which were used always or almost always for 78 percent of the students, on average, across the countries, and at least sometimes for 22 percent of the students. The test questions in science often also required students to provide explanations or justifications for their answers—almost always for 54 percent of students and sometimes for 42 percent, with only 3 percent almost never. Questions involving developing hypotheses and designing scientific investigations were used less frequently— always or almost always for 21 percent of the students, on average, sometimes for 62 percent of the students, and rarely for 17 percent of the students. However, across the eighth grade, ninth grade, and benchmarking participants, there was considerable variation in testing practices.
CLASSROOM INSTRUCTION CHAPTER 8
423
Exhibit 8.32: Classroom Assessment Percentage of Students Whose Teachers Give Test Questions Involving Developing Involving Application of Requiring Explanations Hypotheses and Designing Knowledge and Understanding or Justifications Scientific Investigations
Percentage of Students Whose Teachers Give Science Tests or Examinations
Country
Every 2 A Few Times Always or About Once Weeks or a Year or Almost Sometimes a Month More Less Always
Armenia Australia Bahrain Chile Chinese Taipei England Finland Georgia Ghana Hong Kong SAR Hungary Indonesia Iran, Islamic Rep. of Israel Italy Japan Jordan Kazakhstan Korea, Rep. of Lebanon Lithuania Macedonia, Rep. of Malaysia Morocco New Zealand Norway Oman Palestinian Nat’l Auth. Qatar Romania Russian Federation Saudi Arabia Singapore Slovenia Sweden Syrian Arab Republic Thailand Tunisia Turkey Ukraine United Arab Emirates United States International Avg.
s
r
r
r r
r s
20 (1.8) 9 (2.1) 79 (2.3) 34 (4.2) 98 (1.1) 13 (2.5) 1 (0.5) 19 (2.4) 73 (3.8) 20 (3.6) 42 (2.2) 64 (3.7) 55 (3.3) 7 (2.0) 12 (2.5) 15 (3.3) 46 (4.1) 74 (2.5) 41 (4.1) 70 (3.0) 22 (1.9) 8 (1.1) 13 (2.6) 4 (1.1) 8 (1.8) 2 (1.0) 14 (2.1) 59 (3.1) 70 (4.0) 38 (2.3) 67 (2.2) 56 (4.2) 28 (1.9) 0 (0.2) 1 (0.8) 33 (4.2) 63 (4.1) 4 (1.5) 21 (3.1) 44 (3.0) 57 (2.7) 62 (2.8) 35 (0.4)
47 (2.6) 47 (3.9) 17 (2.2) 65 (4.2) 2 (0.9) 50 (4.1) 21 (1.8) 57 (2.5) 27 (3.8) 39 (4.7) 53 (2.2) 34 (3.7) 32 (3.1) 38 (3.5) 51 (3.6) 28 (3.7) 49 (4.0) 23 (2.4) 41 (3.7) 29 (3.0) 71 (2.1) 30 (2.1) 43 (3.8) 57 (2.4) 69 (3.0) 64 (3.2) 58 (2.9) 37 (3.2) 25 (4.1) 52 (2.3) 28 (1.9) 38 (4.2) 49 (2.5) 1 (0.4) 39 (4.1) 43 (3.9) 32 (3.9) 39 (3.6) 76 (3.2) 43 (2.8) 40 (2.6) 33 (3.0) 41 (0.5)
33 (2.8) 44 (4.3) 4 (0.8) 1 (0.8) 1 (0.6) 36 (3.8) 78 (1.9) 24 (2.1) 0 (0.0) 41 (4.9) 5 (0.8) 3 (1.0) 13 (2.4) 55 (3.2) 37 (3.8) 56 (4.2) 5 (1.5) 3 (0.8) 17 (2.7) 2 (0.9) 8 (1.2) 63 (2.4) 44 (4.1) 39 (2.3) 23 (2.8) 34 (3.2) 29 (3.0) 4 (1.6) 5 (1.7) 11 (1.6) 5 (1.1) 6 (1.7) 23 (2.0) 98 (0.5) 60 (4.1) 25 (3.3) 5 (1.4) 56 (3.7) 2 (1.0) 13 (1.9) 3 (0.7) 6 (1.1) 24 (0.4)
72 (2.3)
s 83 (2.3)
r
r
r r
r s
79 (2.4) 84 (2.5) 83 (3.1) 78 (3.1) 84 (2.1) 84 (2.2) 70 (3.7) 57 (4.1) 82 (1.6) 73 (3.5) 62 (2.8) 91 (2.5) 69 (3.5) 85 (2.9) 79 (3.5) 87 (1.7) 85 (3.2) 83 (2.9) 87 (1.2) 37 (1.8) 64 (3.7) 86 (1.8) 74 (2.9) 66 (3.9) 78 (3.1) 82 (3.2) 68 (3.3) 85 (1.9) 87 (1.5) 74 (3.7) 71 (2.5) 87 (1.6) 91 (1.7) 66 (3.7) 58 (3.7) 85 (2.8) 80 (2.6) 95 (0.9) 84 (1.7) 79 (2.1) 78 (0.4)
27 (2.2) 17 (2.4) 21 (2.4) 16 (2.5) 17 (3.1) 22 (3.0) 16 (2.1) 16 (2.2) 29 (3.8) 43 (4.1) 18 (1.6) 27 (3.5) 37 (2.7) 9 (2.5) 29 (3.7) 14 (3.0) 21 (3.5) 13 (1.7) 15 (3.2) 17 (2.9) 13 (1.1) 52 (2.0) 36 (3.7) 13 (1.7) 26 (2.9) 34 (3.9) 22 (3.1) 18 (3.2) 31 (3.3) 14 (1.8) 13 (1.5) 25 (3.6) 29 (2.5) 13 (1.6) 8 (1.7) 34 (3.7) 42 (3.7) 13 (2.8) 20 (2.6) 5 (0.9) 16 (1.6) 21 (2.1) 22 (0.4)
Never or Almost Never
1 (0.6) 0 (0.2) 0 (0.0) 0 (0.0) 0 (0.0) 1 (0.6) 0 (0.2) 0 (0.2) 1 (0.0) 0 (0.0) 0 (0.1) 0 (0.0) 1 (0.8) 0 (0.0) 2 (1.0) 1 (0.0) 0 (0.0) 0 (0.0) 0 (0.0) 0 (0.0) 0 (0.2) 11 (1.2) 0 (0.0) 0 (0.0) 0 (0.0) 0 (0.0) 0 (0.0) 0 (0.0) 1 (0.7) 0 (0.3) 0 (0.0) 1 (0.6) 0 (0.0) 0 (0.0) 0 (0.1) 0 (0.4) 0 (0.0) 1 (0.8) 0 (0.4) 0 (0.0) 1 (0.5) 0 (0.0) 1 (0.1)
Always or Almost Sometimes Always
5 (1.2)
s 30 (3.0)
r
r
r r
r s
20 (1.5) 26 (3.6) 28 (3.8) 38 (3.2) 4 (1.1) 11 (1.4) 33 (4.0) 14 (3.3) 2 (0.6) 16 (3.3) 18 (2.8) 39 (4.4) 22 (3.0) 24 (3.5) 14 (3.0) 17 (2.0) 33 (3.7) 45 (3.4) 12 (1.3) 23 (2.3) 37 (3.7) 18 (1.8) 23 (3.1) 6 (1.9) 22 (2.6) 16 (2.8) 29 (3.2) 23 (2.2) 5 (0.7) 13 (2.7) 7 (1.5) 17 (1.5) 17 (2.7) 12 (2.6) 28 (3.8) 10 (2.1) 20 (2.8) 63 (2.8) 20 (1.7) 19 (2.1) 21 (0.4)
57 (2.9) 56 (4.4) 66 (2.3) 59 (4.0) 61 (3.7) 55 (2.8) 42 (2.0) 77 (1.9) 61 (4.2) 77 (4.0) 46 (2.2) 72 (3.7) 69 (3.3) 57 (4.3) 59 (3.6) 50 (3.9) 72 (3.7) 78 (2.0) 59 (4.0) 51 (3.4) 72 (1.7) 68 (2.6) 60 (3.9) 67 (2.2) 67 (3.3) 58 (4.5) 68 (3.3) 66 (3.5) 65 (3.2) 63 (2.6) 72 (1.6) 66 (4.0) 52 (2.6) 59 (2.1) 66 (3.8) 61 (4.1) 68 (4.0) 72 (3.4) 61 (3.6) 37 (2.7) 66 (2.2) 65 (2.6) 62 (0.5)
Never or Almost Never
38 (2.7) 14 (3.4) 14 (2.4) 15 (2.8) 12 (2.7) 7 (1.4) 54 (2.0) 12 (1.6) 5 (1.9) 8 (2.3) 51 (2.2) 12 (2.4) 13 (1.9) 4 (1.1) 19 (2.9) 26 (3.6) 14 (2.7) 5 (1.1) 8 (2.2) 4 (1.3) 16 (1.4) 9 (1.5) 3 (1.3) 15 (1.9) 9 (2.1) 36 (4.2) 11 (2.2) 18 (3.2) 6 (1.5) 14 (1.9) 23 (1.7) 21 (3.7) 41 (2.7) 24 (2.0) 18 (2.6) 26 (3.6) 3 (1.5) 19 (3.1) 19 (2.8) 0 (0.2) 14 (1.8) 16 (2.0) 17 (0.4)
Always or Almost Sometimes Always
59 (2.6)
s 59 (3.6)
r
r
r r
r s
75 (2.4) 60 (4.2) 25 (3.8) 58 (3.1) 81 (1.8) 63 (2.4) 63 (4.1) 37 (4.7) 31 (2.0) 38 (4.4) 46 (3.8) 80 (2.8) 52 (3.9) 60 (4.6) 46 (4.2) 67 (2.3) 28 (3.2) 77 (2.7) 72 (1.8) 52 (2.4) 38 (3.4) 51 (2.4) 68 (3.3) 56 (4.3) 60 (3.6) 71 (3.8) 56 (4.5) 63 (2.6) 55 (2.1) 29 (3.7) 50 (3.0) 51 (2.1) 66 (3.1) 35 (3.5) 64 (4.2) 45 (3.8) 23 (2.9) 73 (2.4) 52 (2.4) 49 (2.6) 54 (0.5)
( ) Standard errors appear in parentheses. Because of rounding some results may appear inconsistent. An “r” indicates data are available for at least 70% but less than 85% of the students. An “s” indicates data are available for at least 50% but less than 70% of the students. An “x” indicates data are available for less than 50% of students.
424
TIMSS 2011 INTERNATIONAL RESULTS IN SCIENCE CHAPTER 8
39 (2.4) 40 (3.8) 24 (2.3) 37 (4.1) 59 (3.6) 41 (3.1) 18 (1.7) 37 (2.4) 36 (4.1) 58 (5.0) 58 (2.3) 57 (4.5) 47 (3.8) 20 (2.8) 47 (3.9) 40 (4.6) 51 (4.3) 32 (2.3) 62 (3.5) 23 (2.8) 28 (1.8) 47 (2.4) 60 (3.3) 45 (2.5) 31 (3.3) 44 (4.3) 39 (3.6) 27 (3.7) 40 (4.4) 36 (2.6) 44 (2.0) 62 (4.1) 47 (3.1) 46 (2.0) 30 (3.0) 54 (3.9) 35 (4.1) 52 (4.0) 61 (3.2) 26 (2.4) 44 (2.4) 43 (2.7) 42 (0.5)
Never or Almost Never
2 (0.8) 1 (0.8) 1 (0.8) 3 (1.4) 16 (3.3) 1 (0.6) 1 (0.3) 0 (0.0) 1 (0.7) 4 (1.9) 11 (1.8) 5 (1.6) 6 (2.1) 0 (0.0) 1 (0.6) 0 (0.0) 3 (1.3) 1 (0.5) 10 (2.3) 0 (0.2) 0 (0.2) 2 (0.6) 2 (1.1) 4 (1.1) 1 (0.5) 0 (0.0) 1 (0.6) 2 (1.3) 4 (1.1) 0 (0.2) 1 (0.3) 9 (2.4) 3 (0.9) 3 (0.8) 4 (1.3) 11 (2.3) 1 (0.9) 3 (1.3) 16 (2.5) 1 (0.3) 3 (1.0) 8 (1.5) 3 (0.2)
SOURCE: IEA’s Trends in International Mathematics and Science Study – TIMSS 2011
Reported by Teachers
Percentage of Students Whose Teachers Give Test Questions Involving Developing Involving Application of Requiring Explanations Hypotheses and Designing Knowledge and Understanding or Justifications Scientific Investigations
Percentage of Students Whose Teachers Give Science Tests or Examinations
Country
Every 2 A Few Times Always or About Once Weeks or a Year or Almost Sometimes a Month More Less Always
Never or Almost Never
Always or Almost Sometimes Always
Never or Almost Never
Always or Almost Sometimes Always
Never or Almost Never
Ninth Grade Participants Botswana Honduras South Africa
18 (3.3) 57 (4.3) 23 (3.8)
82 (3.3) 40 (4.3) 63 (4.4)
0 (0.0) 3 (1.3) 14 (2.4)
56 (4.4)
37 (4.3) 51 (4.3) 59 (4.5) 36 (4.6) 40 (2.5) 15 (5.2) 36 (5.4) 43 (7.4) 51 (5.5) xx 34 (5.9) 55 (7.3) 27 (5.3) 33 (8.5)
6 (2.1) 22 (3.5) 14 (3.1) 3 (1.3) 3 (0.6) 0 (0.0) 8 (3.2) 11 (4.2) 15 (4.5) xx 11 (5.0) 2 (1.4) 4 (1.9) 3 (2.6)
75 (3.8) 81 (3.2) 68 (3.6)
25 (3.8) 19 (3.2) 31 (3.6)
0 (0.0) 0 (0.0) 0 (0.3)
79 (3.5) 82 (3.2) 73 (4.0) 80 (3.4) 87 (1.8) 80 (7.0) 74 (5.3) 85 (4.5) 89 (3.8) xx 72 (6.7) 85 (5.0) 87 (3.7) 75 (7.4)
21 (3.5) 17 (3.2) 27 (4.1) 20 (3.4) 13 (1.8) 20 (7.0) 26 (5.3) 15 (4.5) 11 (3.8) xx 27 (6.7) 15 (5.0) 13 (3.7) 25 (7.4)
0 (0.0) 1 (0.5) 0 (0.4) 0 (0.0) 0 (0.0) 0 (0.0) 0 (0.0) 0 (0.0) 0 (0.0) xx 1 (0.8) 0 (0.0) 0 (0.0) 0 (0.0)
15 (3.1) 21 (3.5) 31 (3.5)
75 (3.4) 61 (4.7) 64 (3.8)
10 (2.5) 18 (3.8) 6 (1.7)
18 (3.5) 25 (4.2) 21 (3.9) 14 (3.0) 20 (1.9) 24 (5.6) 13 (3.6) 34 (6.6) 45 (6.4) xx 9 (3.7) 19 (6.0) 15 (5.6) 10 (4.6)
62 (3.9) 60 (4.4) 66 (4.3) 65 (4.3) 73 (2.1) 59 (7.4) 55 (5.2) 60 (7.7) 51 (6.2) xx 69 (5.9) 61 (6.5) 70 (6.9) 72 (6.5)
20 (3.1) 15 (2.7) 13 (3.1) 21 (3.8) 6 (1.0) 17 (5.1) 33 (5.3) 6 (3.8) 4 (1.2) xx 22 (5.3) 20 (5.6) 15 (4.8) 17 (6.6)
62 (4.6) 37 (4.6) 53 (3.4)
38 (4.5) 54 (4.4) 47 (3.4)
1 (0.0) 9 (2.8) 0 (0.0)
51 (4.3) 70 (4.1) 60 (4.2) 48 (4.7) 55 (3.4) 45 (6.4) 31 (5.1) 73 (5.7) 86 (4.3) xx 50 (7.5) 73 (6.3) 48 (5.4) 39 (7.4)
48 (4.3) 29 (4.1) 39 (4.2) 49 (4.9) 44 (3.4) 46 (6.4) 46 (5.4) 27 (5.7) 12 (3.9) xx 41 (6.8) 27 (6.3) 48 (5.7) 52 (7.9)
1 (0.7) 1 (0.9) 0 (0.3) 3 (1.8) 1 (0.2) 9 (4.9) 23 (5.6) 0 (0.0) 1 (1.4) xx 9 (3.2) 0 (0.0) 4 (2.1) 9 (4.2)
Benchmarking Participants Alberta, Canada Ontario, Canada Quebec, Canada Abu Dhabi, UAE Dubai, UAE Alabama, US California, US Colorado, US Connecticut, US Florida, US Indiana, US Massachusetts, US Minnesota, US North Carolina, US
r 27 (3.5) r r s s s s s s r s
27 (3.9) 61 (4.7) 57 (2.5) 85 (5.2) 56 (5.4) 47 (7.3) 34 (6.6) xx 54 (5.9) 43 (7.5) 70 (4.7) 64 (8.5)
r r r r s s s s s s r s
r r r r s s s s s s r s
CLASSROOM INSTRUCTION CHAPTER 8
r r r r s s s s s s r s
425
SOURCE: IEA’s Trends in International Mathematics and Science Study – TIMSS 2011
Exhibit 8.32: Classroom Assessment (Continued)