THE. PROVISION OF THIS DOCUMENT TO YOU DOES NOT PROVIDE YOU WITH ANY LICENSE, EXPRESS OR IMPLIED, BY. ESTOPPEL OR OTHERWISE ...
Chapter #9, FROM CONCEPTION TO DESIGN, A Practical Guide to Designing Ambient Displays Jennifer Mankoff, and Anind Dey IRB-TR-03-025
July, 2003 In Ohara, K. and Churchill, E. (eds.) Public and Situated Displays. Kluwer.
DISCLAIMER: THIS DOCUMENT IS PROVIDED TO YOU "AS IS" WITH NO WARRANTIES WHATSOEVER, INCLUDING ANY WARRANTY OF MERCHANTABILITY NON-INFRINGEMENT, OR FITNESS FOR ANY PARTICULAR PURPOSE. INTEL AND THE AUTHORS OF THIS DOCUMENT DISCLAIM ALL LIABILITY, INCLUDING LIABILITY FOR INFRINGEMENT OF ANY PROPRIETARY RIGHTS, RELATING TO USE OR IMPLEMENTATION OF INFORMATION IN THIS DOCUMENT. THE PROVISION OF THIS DOCUMENT TO YOU DOES NOT PROVIDE YOU WITH ANY LICENSE, EXPRESS OR IMPLIED, BY ESTOPPEL OR OTHERWISE, TO ANY INTELLECTUAL PROPERTY RIGHTS
Copyright 2002, Intel Corporation, All rights reserved.
Chapter #9 FROM CONCEPTION TO DESIGN A practical guide to designing ambient displays Jennifer Mankoff1 & Anind K. Dey1,2 1
EECS Department, UC Berkeley, Berkeley, CA 94720-1770
2
Intel Research Berkeley, Berkeley, CA 94704-1307 Abstract: This chapter discusses displays that sit on the periphery of a user’s attention. Many public displays of information that we encounter are in this category the majority of the time, including clocks, posters, and windows. Computationally enhanced variations on this theme are called peripheral displays. Our work focuses on ambient displays, a subset of peripheral displays that continuously display information to be monitored. Peripheral (and ambient) displays have the peculiar property that they are not meant to be the focus of the user’s attention. Contrast this with desktop applications, which require a user’s attention. In this chapter, we present a case study of two public ambient displays that we developed and evaluated. We present some lessons learned about the design of ambient displays, and conclude with a practical guide to using a modified version of heuristic evaluation that we developed as a result of designing these displays. Key words:
1.
ambient displays, peripheral displays, heuristic evaluation, attention, iterative design
INTRODUCTION
Many of the public displays of information that we encounter sit on the periphery of a user’s attention the majority of the time, including clocks, posters, and windows. Computationally enhanced variations on this theme are called peripheral displays. This chapter is concerned with ambient displays, a subset of peripheral displays that continuously display information that can be monitored by the user without requiring her focused attention. For example, one of the first such displays, created by an artist and technologist in collaboration, was a “dangling string” attached to a motor (Weiser and Brown, 1995). The string spun around at different speeds
2
Chapter #9
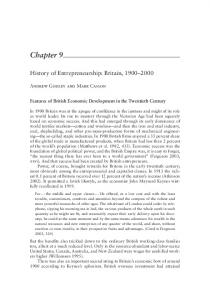
depending on network load (See Figure #9-1). Contrast this with a discrete display of information such as an alarm, an alerting display that only rings when the network load reaches a certain threshold.
Figure #9-1. “The ‘Dangling String’ is an 8 foot piece of plastic spaghetti that hangs from a small electric motor hanging in the ceiling…. A very busy network causes a madly whirling string with a characteristic noise [left]; a quiet network causes only a small twitch every few seconds [right]. Placed in an unused corner of a hallway, the long string is visible and audible from many offices without being obtrusive” (Weiser and Brown, 1995). Courtesy of the Palo Alto Research Center (PARC). Photos by B. Tramontana.
Peripheral displays have the peculiar property that they are not meant to be the focus of a user’s attention. They can be broken into two categories: Ambient displays, are a subclass of peripheral displays that present information in such a way so as to allow people to monitor a data source while not being distracted from their main task. Alerting displays alert a user through more direct means about salient information. This chapter will focus in particular on ambient displays. However, many alerting displays include an ambient component when they are not actively alerting the user about something, and thus alerting display designers may benefit from some of the material in this chapter. Similarly, an ambient display may at times alert a user about something. One of the biggest challenges facing the developers of ambient displays is the lack of information about what constitutes a good design, and which ambient display designs will succeed or fail. Considering the literature regarding ambient displays, there have been few in-depth evaluatio ns, and even fewer examples of design iteration (exceptions are the evaluation work of Mamyinka et al. (2001), and the design iterations of Mynatt et al. (2001)). Far more evaluations of alerting displays exist (including Cutrell et al.
#9. From conception to design
3
(2001); Dumais and Czerwinski (2001); Ho-Ching et al. (2003); Horvitz et al. (1999); Maglio and Campbell (2000); Tiernan, et al. (2001) and van Dantzich et al. (2002)). In these cases, as in the ambient display case, discount evaluation techniques1, useful in the early stages of design, do not exist. The goal of this chapter is to provide a guide to ambient display design and evaluation. After reviewing relevant literature, we present our experiences with the design and evaluation of two ambient displays. We present metrics for successful ambient display design (changes in awareness or behavior), and describe lessons learned designing our displays. We then present an evaluation technique that we adapted explicitly for ambient display design, giving the reader a practical guide for how to apply it. We conclude with a discussion of future work in the design and evaluation of ambient displays.
2.
BACKGROUND
2.1
Peripheral Displays
Peripheral displays are devices that usually reside in the periphery, but show information relevant to a user (Examples may be found in: Dumais and Czerwinski, 2001; Mamyinka et al., 2001; McCrickard et al., 2001; McCrickard et al., 2002; Mynatt et al., 1998; Mynatt et al., 2001). By definition, in today’s world of ubiquitous devices, the majority of applications must reside in the user’s periphery—a person can only interact closely with one or two things at a time. As Weiser states in his seminal article on Ubiquitous Computing “Most of the computers… will be invisible in fact as well as metaphor (Weiser, 1991)” – not at the center of a user’s task or attention. Treismann’s theory of feature integration states that singular focused attention (or spotlight) is a necessity when interacting with complex information (Treismann and Gelade, 1980). In addition, other studies have shown that recognizing a change in a visual environment does not require this spotlight, although knowing what the change is does require it (Sagi and Julesz, 1985). Good design is crucial for applications, or displays of information, that reside in the periphery to succeed without representing a constant distraction, or further overloading users who are already overwhelmed by information in today's world. 1
Discount evaluation techniques are techniques that have a reduced cost. They typically require less time and/or money, may involve fewer participants, and less extravagant equipment (Nielsen, 1994).
4
Chapter #9
Peripheral displays may be public or personal displays of information, and may show ambie nt information, or may show alerts. An example of a personal, alerting display is Yahoo's Instant Messenger program. We classify it as an alerting display because it moves from the periphery to the focus of the user's attention to notify the user that someone wishes to communicate a message to her. Another example in this category is the mobile phone, which grabs the user's attention when it rings. In contrast Mamyinka et al. (2001) designed a personal, ambient display that indicates to a presenter using PowerPoint™ how much time is left in his presentation. We classify this as an ambient display because it presents information continuously to the presenter without interrupting the presentation in any way. An example of a public, ambient display is the Dangling String, described in the introduction and shown in Figure #9-1 (Weiser and Brown, 1995). Both of these ambient displays are abstract (one represents time as a color bar, the other represents network load as the rotation speed of a string. This is typic al of computer-based ambient displays. A focus on aesthetics is also typical: The Dangling String is a piece of artwork, created to explore the idea of embodied information. In summary, work in peripheral displays, whether personal or public, falls into two classes – ambient displays and alerting displays. Ambient displays are peripheral displays that do not attempt to move into the foreground of a user's attention. They are continuous displays of information, and are often abstract, aesthetic, and non-disruptive. In contrast to ambient displays, alerting displays show information at discrete intervals, and are defined by their attempts to move into the foreground of a user's attention. It should be noted that in practice, many peripheral displays include components of both ambient displays and alerting displays. The focus of this chapter is on continuous displays of information, ambient displays, although some of our displays may include alerting features.
2.2
Ambient Displays
Many ambient displays have been built over the years, and those presented here are only a sample. Ambient displays have become an increasingly important focus for artists, designers, and technologists since the introduction of the Dangling String. For example, the Oxygen Flute (Chafe and Niemeyer, 2002) was an art piece designed to reflect the amount of oxygen available in an enclosed space depending on the presence and breathing patterns of human participants. Traditional user interface design had little relevance to this provocative exhibit. In contrast, Hallnäs and Redström’s (2001) work with slow technology was a deliberate exploration of the uses of slowly changing physical artifacts
#9. From conception to design
5
such as moving curtains, wind-blown leaves, and drawers, to show (write) and sense (read) information. As well as being aesthetic and compelling, this work also begins to explore ideas that might guide future design. Researchers approaching the problem from a human-computer interaction perspective have performed studies of detection, distraction, and other factors that can inform ambient display design. For example, Bartram et al. (2001) found that motion is an effective way to notify a user of information, while color change is less effective. McCrickard et al. (2003) studied a variety of different styles of animation and their impact in terms of interruption and comprehension. The result of their studies was a table recommending different types of notifications 2 depending on system design goals. Czerwinski et al. (2000) investigated the impact of interruptions caused by Instant Messaging on different types of primary tasks, showing generally harmful effects on overall task time. In related work, the same authors found that Instant Messaging interruptions can cause a user to forget what they were scanning for in a visual scan task (Cutrell et al., 2001). Intille (2002) demonstrated techniques for supporting change blindness, changing visual information in ways that make the changes difficult to detect, and reduces interruption/distraction. Hudson et al. studied predictors for the interruptibility of administrative assistants, and developed sensing technology that can accurately predict appropriate times to display peripheral information, based on sensors as simple as a noise-detecting microphone. Other work, including our own, has led to an understanding of how different evaluation methods can be adapted to support the evaluation of peripheral and ambient displays (Mankoff et al., 2003; Chewar and McCrickard, 2002). Finally, technologists such as Ishii et al. (1998) and Pederson and Sokolor (1997) have developed tools and techniques for constructing tangible, sensing-based ambient displays. Both sets of authors used their tools to gain experience with ambient display design. Ishii et al. particularly mention the importance of choosing an appropriate modality to display data (“mapping”). They also discuss the importance of understanding when data will transition into a user’s foreground, and the existence of learning effects. Pederson and Sokolor discuss the connection between learning effects and levels of abstraction. Long term use showed them the importance of aesthetics as they became “tired of the abstract displays” they had created. Finally, they suggest that because a user is not constantly attending to a display, information cannot change too quickly, and some sort of memory or history must be provided.
2
Note that the peripheral display community has not entirely settled on a terminology yet. The term “notification systems” has been used in the past to refer to alerting displays, but McCrickard uses it more broadly and includes ambient displays in his definition.
6
Chapter #9
One important question to ask about the evaluation of ambient displays is: “What are the characteristics of a successful ambient display?” In other words, what high-level outcomes should we expect from a good display? Our answer to this question is that a successful ambient display should modify someone’s awareness of certain information and potentially change one’s behavior with respect to that information. The next section presents our design process for two ambient displays, from conception to an evaluation intended to measure successful changes in awareness and behavior.
3.
OUR DESIGN PROCESS
Our design process typically involves three main steps: (1) We conduct interviews and/or surveys of the people using the area where the display will be located to determine which information sources are of interest to them, and how they currently monitor that information. (2) We select an appropriate information source based on that data and design an ambient display that shows that information. (3) We conduct a summative evaluation of the display. Our general approach has been to test awareness and behavior of the information displayed twice – once before and once after the deployment. Next, we give an example of this design process for two recent displays built in our lab, the Bus Mobile and the Light Display.
Figure #9-2. Two displays that were placed at the front of an underground student computing laboratory. Bus Mobile (left): The three images show a token for bus 51 moving upwards, indicating that the bus is approaching the bus stop. Light Display (right): The light dims as sunset approaches, and brightens as dawn approaches.
#9. From conception to design 3.1.1
7
Bus Mobile and Light Display
Both the Bus Mobile and the Light Display were built to address the needs of undergraduate computer science students working in underground laboratories in our building. We designed them to provide a service to the users of two computer labs that do not have windows. To determine what kinds of information would be useful to users, we conducted a preliminary survey, asking participants to rank in order information they would like to see in an ambient display. Some of the choices included how dark it is outside (leaving the lab before dark is important to many students for safety reasons), the weather, the population of the computer labs, the network load on the login servers, when a bus was next scheduled to arrive, and sports statistics. The survey also queried the lab users with questions such as which bus lines they used frequently and which sports teams they followed. Some of the highest ranking information included how full the labs were and which servers had the most traffic. However, it was decided that these data sources would not make effective ambient displays, because the information only need be obtained once before entering the lab, and continual awareness of the information is not needed while one is working. Instead, we chose the highest ranked information sources that included dynamic change (and thus were amenable to an ambient display approach). The two most popular information sources that fit this requirement were bus schedules and the amount of daylight remaining. Students typically memorize bus schedules, or look them up online. Daylight is estimated by checking the time. As students are usually engrossed in their projects, it is very easy for them to lose track of time and more importantly, when their buses arrive or when it gets dark. Once we completed our analysis of what data to show, we built the displays and deployed them in the aforementioned labs for a two week period. It was expected that having the displays in the two computer labs would allow the lab users to make an informed decision to leave the lab within a specific time frame based on their needs. For the Bus Mobile, we hypothesized that there would be an increase in the number of students who leave the lab within an optimal time frame before a given bus arrival, because students would like to catch a bus immediately instead of waiting at the stop for one to arrive. For the Daylight Display, we hypothesized that there would be an increase in the number of students leaving the lab in the time leading up to sunset. Bus Mobile: The Bus Mobile, shown in Figure #9-2 (left), was designed to provide information about how soon local buses would arrive at nearby bus stops. It was constructed using six computer-controlled motors attached to aluminum rods. Around the base of the display hangs a curtain that is
8
Chapter #9
approximately six inches long, behind which the icons, attached to each of the motors with a wire, can be hidden from view. Bus numbers painted on wooden plaques for the six most popular bus lines mentioned on the presurvey were hung from the motors. The display was designed so that the six bus numbers hang at depths corresponding to how many minutes are left before the relevant bus is scheduled to arrive at the stop closest to the building where the labs are located. For example, in Figure #9-2 (left), Bus 51N is further from the bus stop than Bus 51S. For each inch the number hangs below the bottom edge of the skirt, there is one minute remaining before the bus arrives, with a maximum range of twenty-five minutes. If no bus is scheduled to arrive within twenty-five minutes, the bus number moves to its minimum depth and is hidden from view behind the curtain. The display is updated every minute, and the icons move up one inch per minute. After the bus has passed, the bus number is lowered the appropriate number of inches based upon the next scheduled arrival of the same bus line. As mentioned above, we queried students to determine the most popular bus lines to display with the Bus Mobile. Daylight Display: The second display, shown in Figure #9-2 (right), was designed to provide information about whether it was dusky, light, or dark outside. This was of interest to students for safety reasons (i.e. some students are uncomfortable walking home alone after dark) and also as an approximate indicator of time of day. The display consists of a regular floor lamp with an X10 controller, a common home automation device. The display controls the br ightness of a lamp by adjusting how much power is supplied to the lamp. The Daylight Display was designed to adjust its brightness according to the recorded sunrise and sunset times. A number of sunrises and sunsets were observed to determine when it actually begins to get light and dark, so that the display could more accurately show the light level outside. It was determined that during the summer months in Berkeley in 2002, the sun began to set about forty-five minutes before the listed sunset time (taken from a website with weather information), and it was completely dark about thirty minutes after the listed sunset time. For the sunrise, it began to get light thirty minutes before the listed sunrise time, and it was completely light about forty-five minutes after the listed sunrise time. The display was designed to alert a user of the lab that it is beginning to get dark or light outside by flickering the lamp a few times, then beginning the cycle of brightening or dimming the lamp, depending on the time of day. The X10 controller allowed for twenty-two brightness levels from off to on, which meant that the light adjusted its brightness approximately every 3.5 minutes.
#9. From conception to design 3.1.2
9
Study Method
The study was conducted in three phases. The first phase occurred in the week before the displays were deployed in the labs, when a questionnaire was distributed to the users of three labs, which they could fill out at their own leisure. Two of the labs were ones where the displays would be located, and the third lab was one that would have no display and would be used as a control. The questions on the survey covered various topics that could give us an indication of whether or not information about bus arrivals and outdoor light levels affected a subject’s behavior. Phase 2 of the project started about a week and a half after the surveys were first made available. It began with the installation of the two displays in two different labs. The Bus Mobile was suspended from the ceiling on one side of the room in a location where most users in the lab could see it when they looked up from their desktop computers. The Daylight Display was set up in a corner of the other lab where it would be the most noticeable. We hung a sign by each of the displays, explaining how to use them and where a user could go for more information. As soon as the displays were deployed, we removed the Phase 1 surveys from the labs. Phase 2 lasted for two and a half weeks. The first week of deployment allowed the users of the lab comfortable with using the ambient displays, so that when the next survey became available, the novelty of the displays would have worn off. Surveys with different questions were made available to the users of the labs, this time with questions pertaining to how they use the display and whether or not it was useful to them. Users had the opportunity to complete surveys posted on the door, using an online form with the web address advertised in the labs, or completing the survey after being recruited in the hallway after leaving. Phase 3 started when the Bus Mobile and Daylight Display were removed, along with the surveys from the second phase. Surveys were again distributed to the labs in the same manner as the surveys from the second round. The objective of this questionnaire was to find data on the impact of the removal of the displays and whether or not the users of the labs missed having them. In addition to the data collected from the surveys, we monitored the labs for ten minutes a day at random times for approximately two weeks, spread over phases 1 and 2. The observations made during the monitoring sessions consisted of how many people were in the lab initially, how many people entered or left the lab during the time period, how many users were there in the end, and then any observations that could be made about people using the displays, discussing them, or filling out the surveys. Our last source of
10
Chapter #9
data was a system log that listed all of the students’ account login and logout times. This data was retrieved in each of the phases. 3.1.3
Study Results
Qualitative feedback indicated that students preferred the Bus Mobile to the daylight display. For example, one student wrote “bus mobile -> ultra cool. makes life easier [sic]” about the Bus Mobile. Written comments criticized the Daylight Display for being too bright, or indicated that a respondent had not noticed it or thought it was broken. We surveyed a total of 60 students during the study period. Of those, 6 respondents were interested in the bus schedules and 10 were interested in awareness of light (based on a Likert scale response of 4 or 5 out of 5). There was a strong correlation (Spearman's rho=.618, p