1. Applied Statistics for the Behavioral. Sciences. Chapter 9. Two sample tests.
Chapter Outline. ▫ Simple experiments. ▫ Two-sample hypothesis testing.
Applied Statistics for the Behavioral Sciences Chapter 8 One-sample designs Hypothesis testing/effect size
Chapter Outline
Hypothesis testing
null & alternative hypotheses alpha (), significance level, rejection region, & critical values
One-sample t test Converting r to t Interpretation of p Decisions about the null hypothesis One tailed and two tailed tests Effect size index
Hypothesis testing
belief about the state of affairs in nature how some group compares with another one sample case
measure a single group compare their scores with standard/population parameter.
make decision - about true state of nature establish difference between data and some population parameter
1
Hypothesis testing (cont.)
set up conditions so we are predicting that the values we observe will be different than some parameter if wrong, data will be within limits expected if no difference existed in nature if right about a difference existing, data will not be within range expected to occur if no difference. testing a hypothesis about equality. Research hypothesis is that the equality condition is not true end result: decision about null hypothesis.
An example
During recent year, the mean SAT score (math + verbal) was 896 summary statistics for a small high school is this school's performance equal to the national norm? The Data: X = 24,206 X2 = 22,716,411 N = 26 (X)2 = 5.8593 E8 (or 585,930,000) X 931 ŝ = 85 sem = 16.670
Possible relationships between our high school and pop value
1 = 0 1 < 0 1 > 0 observed mean of 931 is larger than population parameter of 896 is this deviation one that is reasonably likely due to chance fluctuation alone?
2
Two hypotheses
Set up two hypotheses that cover all possible values of the parameter first is the hypothesis of equality, our data came from a population with a mean of 896 second hypothesis is that data did not come from a population with a mean of 896.
Which is correct?
tentatively assume equality hypothesis correct calculate the probability of the statistic observed in our sample statistic is the t statistic null hypothesis=our hypothesis of equality
the hs we have data for no different than the national average of 896 H0 : = 896
Alternative hypotheses
potentially infinite number of alternative hypotheses alternatives framed consistently with research hypothesis interested in establishing the likelihood that our hs mean came from a population with a mean of 896 H1 : 896
3
Making the decision
large difference between our observed data and hypothesized value makes us unlikely to accept the assumption that deviation arose by chance alone. difference of 35 points compare difference with sampling distribution of t and determine whether it is a difference that would be expected
Example particulars
null hypothesis= there is not a difference between our HS mean SAT score and the national average of 896 can be thought of as the hypothesis the researcher hopes to disprove or "nullify" Rejection of the null tells us something, failure to reject leaves us with the null as one of many possible hypotheses.
Alpha
Where do we set our cut off for what constitutes a "chance deviation" vs. a statistically significant difference? setting alpha will generally be simply using the "default" value we have discussed, .05, this represents our "break point” we reject the null for any result with a p .05
4
Significance level
The actual probability of observing a difference as large or larger than the one found in the data is the significance level SPSS provides actual significance levels even when we calculate t by hand we can see in the table whether our t statistic exceeds smaller probability levels or not.
Rejection region
alpha of .05, 2.5% of area in each tail alpha of .01, 0.5% of area in each tail. Critical values
value that must be exceeded by the t statistic for a statistically significant difference to reject the null at various values of alpha critical value itself is part of the rejection region
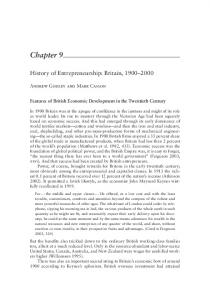
Fig 9.2 pg 184 t dist w/14 df, for α=.05
One-sample t test
can simplify the process we just went through and formalize it into the one-sample t test formula
with N-1 df
t
X 0 sx
5
Converting r to t
test whether a correlation coefficient differs significantly from zero treat sample correlation as a sample mean and the population correlation coefficient (rho) as the "test value" in this case equal to zero
t
r sr
sr
(1 r 2 ) N 2
Converting r to t (cont.)
use the standard error of the sample correlation coefficient sampling distributions for population correlation coefficients other than 0 are not t distributions
N 2 1 r 2
t (r )
Interpretation of p
p value associated with our statistical test represents the probability of a result as large or larger if null true Decisions about the null hypothesis
accepting or rejecting True state of nature
Decision Do not reject based on data H0 Reject H0
H0 true
H0 false
Correct decision
Type 2 error (p=)
Type 1 error (p=)
Correct decision
6
One tailed and two tailed tests
Figure 9.5 (p. 191): A one-tailed test of significance, with = .05, df = 30. The critical value is 1.70. What would the critical value be for 2 tailed test?
Effect size index
gives us a yardstick for comparing the magnitude of differences across studies. the effect size index for a one sample t is d and obtained from the following:
d
X 0
Review guidelines, material re: d from Ch 5
7