Characterization of Different Microsoft Kinect Sensor Models Nicholas M. DiFilippo and Musa K. Jouaneh, Senior Member, IEEE
Abstract— This experimental study investigates the performance of three different models of the Microsoft Kinect sensor using the OpenNI driver from Primesense. The accuracy, repeatability, and resolution of the different Kinect models’ abilities to determine the distance to a planar target was explored. An ANOVA analysis was performed to determine if the model of the Kinect, the operating temperature, or their interaction were significant factors in the Kinect’s ability to determine the distance to the target. Different sized gauge blocks were also used to test how well a Kinect could reconstruct precise objects. Machinist blocks were used to examine how well the Kinect could reconstruct objects setup on an angle and determine the location of the center of a hole. All the Kinect models were able to determine the location of a target with a low standard deviation (< 2 mm). At close distances, the resolutions of all the Kinect models were 1 mm. Through the ANOVA analysis, the best performing Kinect at close distances was the Kinect model 1414, and at farther distances was the Kinect model 1473 .The internal temperature of the Kinect sensor had an effect on the distance reported by the sensor. Using different correction factors, the Kinect was able to determine the volume of a gauge block and the angles machinist blocks were setup at, with under a 10 percent error. Index Terms— Kinect Sensor, Kinect Accuracy, 3-D Image Reconstruction, Kinect for Xbox, Kinect for Windows, OpenNI, Depth Measurement.
I. INTRODUCTION
T
HE Microsoft Kinect is a low cost sensor that integrates many components. It is composed of a traditional RGB camera, a depth sensor consisting of an infra-red (IR) camera and projector, a microphone, and a built-in motor. The built-in motor allows the base of the Kinect sensor to tilt [1]. The Kinect sensor was originally designed to be used to control games on the Microsoft Xbox 360 gaming console. Using their hand with the Kinect sensor rather than a controller, players are able to control characters or menus in a game. Instead of being limited to only gaming applications, multiple libraries are available that open up potential applications of the Kinect sensor to fields involving computer vision [2], 3D mapping [3-5] , robotics [6-10], medicine[11-18], human tracking [19,20] , as well as others. Nicholas M. DiFilippo is a graduate student in the Mechanical Engineering Department at the University of Rhode Island, Kingston, RI 02881 USA (email:
[email protected]). Musa K. Jouaneh is with the Mechanical Engineering Department at the University of Rhode Island, Kingston, RI 02881 USA (e-mail:
[email protected]).
Examples of these applications include the work of Shirwalker et al. [9] and Afthoni et al. [10] who have both used the Kinect sensor to obtain gestures that an operator makes in order to control a robotic arm. Alnowami et al. [12] and Tahavori et al. [13, 14] used the Kinect to monitor patients' respiratory breathing patterns while they are receiving external beam radiotherapy. It was found that the Kinect performs quite well and can determine various types of breathing patterns compared to the equipment that is currently used. Ning and Guo [17] showed that the Kinect sensor can be used to assess the spinal loading of a person. Yang et al. [18] assess how the Kinect sensor performs in measuring the postural stability of a person. It was reported that although the Kinect sensor needs to be calibrated by a set of linear equations, it was able to measure a person’s standing balance comparable to how standard testing equipment is able to. Obdrzálek et al. [21] used the Kinect sensor to estimate human poses and compared this with other known techniques. They found that with controlled postures, such as standing and exercising arms, the Kinect’s performance is comparable with motion capture techniques. However, the Kinect’s estimation of general postures can be off by as much as 10 cm and the Kinect skeletal tracking often fails due to self-occlusions of body parts. The three main libraries that allow programmers access to the Kinect’s camera and depth information are OpenKinect, the Microsoft Kinect Software Development Kit (SDK), and OpenNI [1]. The first library available for developers, OpenKinect , was released in November 2010 via the hacker community [22]. PrimeSense, creator of the hardware in the Kinect sensor, released the OpenNI open source SDK in December 2010. OpenNI is a framework that uses the middleware library, NiTE, to enhance the Kinect sensors gesture recognition and tracking abilities. In June 2011, Microsoft released the Microsoft Kinect SDK [23] which allows development of applications using C++, C#, and Visual Basic. The two types of Kinect sensors available are the Kinect for Xbox 360 and the Kinect for Windows (K4W). The main difference between these sensors is the range at which the sensors can return depth values for using the Microsoft Kinect SDK. While the Kinect for Xbox 360 can only determine the distance of an object between 800 and 4000 mm, the K4W possesses a near mode option allowing it to change this range to see objects between 400 and 3000 mm. Additionally, the Kinect for Xbox 360 has two common models, model 1414 and model 1473. The OpenNI drivers and the Microsoft
Kinect SDK work with all of the sensors however; the OpenKinect libraries currently only support the Kinect model 1414. At the time of this writing, Microsoft has released a new Kinect for Windows v2. This sensor has a full 1080p video, a higher depth fidelity, and can track up to 6 people. However, it is only available on Windows 8 or 8.1 and can only interface with the Microsoft SDK V2[24]. This new Kinect sensor works by using time of flight (ToF) technology [25] where a light source transmits a modulated light signal that travels to an object and is then reflected back to the sensor. The Kinect uses phase detection that measures how long it takes the light to travel to the object and back and can then determine the depth of an object from this time. The Kinect Sensor works by using a speckle pattern 3-D mapping [4, 26]. This is when the sensor projects an IR speckle pattern on the scene and compares this pattern to a reference pattern. If an object in the scene is farther or closer than the reference plane, the speckles that are on the object will shift and using a correlation procedure, the Kinect sensor can determine the distance of that object. Various researchers have attempted to characterize the Kinect sensor and determine the optimal range to use it. Khoshelham and Elberink [4] explained the mathematical model of how the Kinect sensor determines the distance of an object and how to align the depth and RGB images. They concluded, using the OpenKinect framework and the RANSAC plane fitting method with the standard deviation of the residuals on the point cloud data, that the optimal distance to use the Kinect sensor is within 1000 - 3000 mm. At greater distances, the low resolution and noise of the sensor will reduce the accuracy of the data. Alnowami et al. [12] observed a nonlinear relationship between the true depth and the Kinect pixel depth intensity, and they determined that the optimal performance lies between 800 mm and 1500 mm using the Microsoft SDK. Molnar et al. [27] reported a standard deviation of less than 1 mm to up to 10 mm at close ranges and between 7 and 50 mm at 3500 mm using OpenNI drivers. They found the optimal range of the Kinect sensor to be between 700 and 2000 mm. Andersen et al. [2] showed that the depth estimates of a pixel compared to the actual distance follow a linear relationship after being linearized by the OpenNI framework. The resolution of the Kinect was shown to be nonlinear and continues to degrade as the distance from an object increases. Macknojia et al. [28] compared the performance of a K4W and a Kinect for the Xbox 360. They used the Microsoft SDK for the K4W sensor and the OpenNI framework for the Xbox Kinect sensor. They found that both devices have close to the same quantization error (the Xbox Kinect slightly overestimates it) and the optimal operating range was up to 2000 mm with an error of 10 mm. They also discovered that both Kinect sensors could not reconstruct transparent surfaces (since glass and clear materials are IR transparent), but could reconstruct curves and shiny painted surfaces on a car. Stommel et al. [29] describe a method in which missing depth values are estimated to eliminate gaps in images. Stoyanov et al. [30] compared the Kinect against two ToF
cameras (SwissRanger SR-4000 and Fotonic B70) to a laser range sensor (SICK LMS-200) and found that in short distances (< 3m), the Kinect sensor performed the closest to the laser range sensor. Smisek et al. [31] also compared the Kinect to two different sensors, a SwissRanger SR-4000 ToF sensor and a 3.5 M pixel SLR stereo camera. They concluded that the Kinect was much better than the ToF camera and comparable to the stereo camera. Mallick et al. [32] review the work that has been done on the characterization of the noise in the Kinect sensors depth image. They conclude that the three main types of noise that occur are spatial, temporal, and interference noise. Spatial noise happens in a single frame, temporal noise happens over multiple frames, and interference noise happens when two or more Kinects are looking at the same scene. The aim of this research is to compare the performance of different Kinect models using the OpenNI framework. OpenNI was chosen because the alignment of the depth and color images is performed automatically; it works with all the Kinect models, and is cross platform. In some of the tests reported in this paper, we also used the Microsoft Kinect SDK 1.8. The Kinect sensor will also be used to reconstruct 3-D objects of known dimensions. The remainder of this paper is organized as follows. The next section discusses the methods used to characterize the different sensors. This is followed by Section III which shows and discusses the results obtained. Section IV discusses the 3D reconstruction of gauge and machine blocks. II. METHODS A. Accuracy, Repeatability, and Resolution Limit Switches
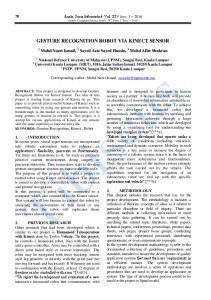
Stepper Motor Target
Kinect Sensor (Connected to Computer)
Linear Slider Homing Position Fig. 1. Experimental setup of the linear slide used for the accuracy, repeatability, resolution, and ANOVA trials.
The experimental setup is shown in Fig 1. A 254 x 254 mm target machined out of plastic and covered with paper to make it non IR-transparent was attached to a stage mounted on a 2 m DryLin linear slide (Igus). A NEMA 23 stepper motor (1.8 deg/step, Minebea Co.) was attached to the linear slide. The stage was controlled by a data acquisition card (PCIMDAS1602/16) which moved the target back in 100 mm increments. The Kinect sensor was mounted on one end of the
linear stage using a Kinect wall mount. This allowed for the model of the Kinect sensor to be interchanged while ensuring positional accuracy. The stepper motor and linear stage were calibrated by a displacement gauge (Mitutoyo) and a linear distance of 100 mm yielded an accuracy of +/-0.01 mm. When a test was started the stage would move towards the Kinect sensor to a homing position located 100 mm in front of the Kinect. The homing position was reached when the limit switch was triggered. Then the linear stage would move back in 100 mm intervals and the Kinect sensor recorded the depth of the target at every interval. The accuracy of each sensor was measured by constructing an area of 50x50 pixels in the center of the target. Twenty five images at 30 FPS were taken and the depth value of every pixel in the 50x50 pixel area was averaged to obtain a final value. For each interval, a total of 62500 pixels were used (25x50x50). The distance returned by the Kinect is the distance from the object to the plane of the Kinect’s camera. An area of 50x50 pixels was chosen so the region of interest that the Kinect was looking at would be at the center of the target at the closest and farthest positions of travel. The repeatability of each sensor was measured by the standard deviation of these final values. A test was completed once the limit switch opposite the Kinect sensor was triggered. Distances greater than 1800 mm were not considered because of the physical limitations of the slider used. Also distances less than 600 mm were not explored because 500mm is very close to the limit of the Kinect in determining distances. The resolution step is the smallest increment that the Kinect can see at a distance. To determine the resolution of a Kinect sensor, pixels in the upper left, center, and lower right portion of the target were chosen and their values were recorded over 5000 images. The initial pixel value was subtracted from the subsequent pixel values and histograms of the differences were used to determine the resolution step. After a Kinect was placed on the holder, the distance from each end of the Kinect was measured to the target to ensure the Kinect was parallel to the target. B. Steady State Temperature To determine the amount of time it took a Kinect sensor to reach an internal steady state temperature, a temperature sensor (LM35) was connected to an Arduino Uno and interfaced to Matlab 2012a. The LM35 temperature sensor is a precision integrated-circuit that outputs an analog voltage proportional to the temperature in centigrade. This sensor does not require any external calibration and is accurate to ±1/4°C. The temperature sensor was attached directly above the infrared camera projector and LED on top of the plastic casing. This location was chosen because it was the location on the Kinect that heats up when the sensor is in use. The Kinect sensor was turned on and the OpenNI example program SimpleViewer was run for the duration of the test. The results of the trials were averaged, and the time constant (τ) was determined to be 1500 seconds. For the system to reach temperature stability, the Kinect sensor has to run for 4τ or ~6000 seconds (100 minutes). Fig. 2 shows the temperature response of all three Kinect models. This operating
temperature will be referred to as the high temperature in the results, while the low temperature will be referred to as the room temperature the Kinect is at before being powered on which for this experiment is ~21-23°C. The Kinect sensor was set up to look at a stationary target 1800 mm away and images were recorded at 30 FPS over a period of 1200 minutes. A 50x50 pixel area was averaged over 25 images to obtain a depth distance. This test was repeated using the OpenNI driver and Microsoft Kinect SDK 1.8. The results of Fig. 2 will be discussed in Section III. C. Statistical Methods The design used for the experiment was a full factorial design whose effects model is shown in (1). Here, 𝜇 is the overall mean effect, 𝜏𝑖 is the effect of the ith level of the Kinect model and βj is the effect of the jth level of the operating temperature. (𝜏𝛽)𝑖𝑗 is the interaction effect between the Kinect model and the operating temperature, and (𝜀𝑖𝑗𝑘 ) is the random error term. 𝑦𝑖𝑗𝑘 is the distance returned by the Kinect sensor when the Kinect model is at the ith level, the operating temperature is at the jth level and it is the kth replicate. Using Minitab’s DOE tool, a random run order for the experiment was generated and a total of 18 tests were performed. (1) 𝑦𝑖𝑗𝑘 = 𝜇 + 𝜏𝑖 + 𝛽𝑗 + (𝜏𝛽)𝑖𝑗 + 𝜀𝑖𝑗𝑘
An ANOVA test (p= 0.05) was performed in Minitab on the response (depth data) of the Kinect sensor at 600 to1800 mm in 100 mm increments. This was used to examine if the Kinect model, the operating temperature, and/or and the interaction between the Kinect model and operating temperature were significant factors that influence the depth data. The ANOVA model was verified using Bartlett’s test for equal variance (p=0.05) and checking the normality of residuals (p=0.05). A comparison of the means was performed using Tukey’s test with a 95% confidence interval and the final recommendations were made by looking at the interactions plot.
Fig. 2. Temperature response of the three Kinect models.
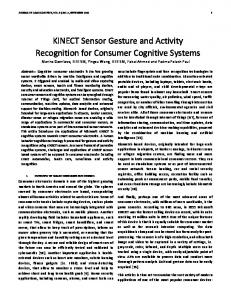
D. 3D Image Reconstruction Reconstructing objects and locating holes is an important step in automated vision guided assembly and disassembly operations. In a disassembly operation, the vision system needs to be able to identify holes in order to try to remove a screw. It also requires precise reconstruction of objects and holes that might not always be flat or completely intact. The Kinect model used for image reconstruction was the 1414 model which was mounted on a camera tripod on the top of a leveled surface 600 mm away from the object as shown in Fig. 3. This Kinect was chosen because it performed the best at close distances. Closer distances are better for applications involving precise reconstruction because the resolution of the Kinect is lower (1mm). These results are talked about more in Section III. Thus the purpose of the work in this section is to investigate how well the Kinect could reconstruct and identify features on these objects. The intent is not to perform comparison between different Kinect models. The Kinect sensor was then leveled using its depth image, making sure all sides of the image returned the same depth value. Using the 150 x 90 pixel RGB image in Fig.4 the amount of pixels a 101.6 mm gauge block took up could be determined by subtracting the pixels of both sides of the gauge block on the same row (X2 - X1 where Y1 = Y2.) A millimeter to pixel (mm/px) resolution of 1.116 was calculated for this setup. Using the built in Matlab function “surf” and various sized gauge blocks, the Kinects sensor ability to accurately reconstruct 3D objects was tested. The experimental volumes of the gauge blocks were determined by separating the background from the gauge block using a height threshold. Gauge blocks were chosen to be the objects reconstructed by the Kinect sensor because they are manufactured to known dimensions and tolerances. This makes them ideal to test the performance of the Kinect sensor. Machinist blocks with a dimension of 25.4 x 50.8x 76.2 mm and containing six 12.7 mm through holes were used to test the Kinect sensors ability to reconstruct an angle an object was at and an object containing holes. The machinist blocks were angled using a height support and the angle was verified with a protractor. The angle of the machinist block was experimentally determined by using the depth image to obtain the y1, y2, z1, and z2 points shown in Fig.5. The angle of the machinist block could then be calculated using trigonometric relationships. The Hough circle transform method (Tao Peng, Matlab Central File Exchange) was performed on the RGB image to obtain the location of the center of the holes for each of the six holes on the machinist block. The labels of these holes are given in Fig. 6a. Fig. 6b shows the calculation of the offset (r) between the between the center of the hole (A) and the center of the circle found with the circle transform algorithm (A’). This offset is given by (2). The offset was calculated with and without adjusting for the Kinect sensors position being directly above to the machinist block and a rotation in the X-Y plane. The theoretical locations of the center of the holes are determined by using the mm/px resolution, the dimensions of the machinist block, and the row of pixels in the RGB image
Kinect (to Computer)
Object to Reconstruct
Tripod Leveled Surface
Fig. 3. Experimental Setup for 3D image reconstruction of gauge and machinist blocks.
(X1,
Y1)
(X2,
Y2)
Fig. 4. Gauge block used for determining pixel to mm ratio. The X and Y values are used to determine the length of the gauge block in pixels.
Fig. 5. Schematic showing how the angle of the machinist block is determined.
that the top of the block is at. These center hole locations work well for a flat object but as soon as the object is at an angle, the adjacent values A1, A2, and A3 in Fig. 6c become a more accurate estimation of the location of the centers. Using similar triangle relations, the equations for the Ai values are given by (3) while the Hi values are found from the dimensions of the machinist block. The machinist block used in this setup has a hypotenuse of 7.62 mm. The other adjustment, shown in Fig. 6d is performed to offset any rotation that the machinist block may have undergone in the x-y plane of the image. Since the locations of
the center of the holes are determined by their distance from the side of the block (in px), O1, O2, and O3 allow for a more accurate starting pixel point. These points are also determined using similar triangles relations shown in (4). The values for Hi are found by using the dimensions of the machinist block. Fig. 6d only shows this adjustment on the side of the machinist block however, the same procedure will work for the rotation of the top part of the machinist block. Using the depth image obtained from the Kinect sensor, at the location of the center holes, the amount of pixels in a 12x12 square that have a depth value of zero are added up. The size of the square was determined by calculating the pixel equivalent of the area of a 12.7 mm hole. This can be used to tell if there are patches of 0 depth pixels. These patches of pixels with 0 depth values can be used to validate a hole at these locations. ∆𝑥 = 𝑥2 − 𝑥1 ∆𝑦 = 𝑦2 − 𝑦1 𝑟 = √(∆𝑥 2 + ∆𝑦 2 )
𝐴𝑖 = 𝐻𝑖 cos(𝛼) 𝑤ℎ𝑒𝑟𝑒 𝛼 = cos −1 (
(2)
𝑑𝑦 ) 𝐻
𝑂𝑖 = 𝐻𝑖 sin(𝛽) 𝑤ℎ𝑒𝑟𝑒 𝛽 = sin−1 (
𝑑𝑥 ) 𝐻
(3)
(4)
Fig. 6. a) Labeling of the holes on the Machinist Block b) Calculation of the offset between the hole and circle from the image c) Correction for the way the Kinect is positioned over the machinist block d) Correction for rotation of machinist block.
III. RESULTS A. Accuracy and Repeatability Each model of the Kinect sensor was used for three trials at
a high and a low temperature as part of the ANOVA test (Section C). The averaged results of all three Kinect models are shown in Fig. 7. This figure plots the actual distance the target is from the Kinect sensor vs. the distance calculated by the Kinect sensor at different temperatures. The standard deviations of all the points from these trials with all the Kinect models are very small with the greatest standard deviation being just over 2mm (Kinect 1414 at 1700mm). Due to the small size of the standard deviation and the scale of the graph these error bars are not shown. At low temperatures (~21 ºC temperature when Kinect was just turned on) and close distances less than 800 mm, all the calculated results are close to the actual distances (within 2.1mm), but at greater distances than 1300 mm, the Kinect model 1473 starts to calculate distances farther away than the actual distance. At a high temperature (temperature after turning on the Kinect for more than 100 minutes), the Kinect 1473 improves the distances it reads as the target gets farther away while the other two Kinect models get worse and underestimate the depth. B. Depth Resolution The depth resolution histogram of each Kinect sensor was obtained at different distances. A histogram of the resolution at 600mm with the Kinect model 1414 is shown in Fig. 8. This figure shows a resolution of 1 pixel. These histograms are summarized in Fig. 9. As the distance from a target increases, the resolution of the Kinect sensor for all models becomes coarser. The most accurate resolutions occur at the closer distances (distances < 700 mm) when the resolution of all the models are 1 mm. At 1800 mm, the resolutions of the models are still less than 10 mm. All of the different Kinect models exhibit the same upward sloping graph and the same resolution. The results presented agree with the results presented by Andersen et al. [2] and Macknojia et al. [28] at these distances. Andersen et al. [2] reported approximately a 1 mm resolution at a distance of 600mm to around a 10 mm resolution at a distance 1800mm. Macknojia et al. [28] also reported a 1 mm resolution at a distance of 600 mm to 9 mm at a distance of 1800 mm. Both of these authors also demonstrated that at distances of around 3000mm, the resolution can be as poor as 30 mm. This was not explored with this setup due to the size of the linear slider. C. ANOVA Testing For all of the distances, the Kinect Model and the Temperature were significant factors with p-values of 0.000. The p-value of the interaction between these two factors was a significant (p value